Nền tảng Big Data với PySpark
Upendra Devisetty
Science Analyst, CyVerse
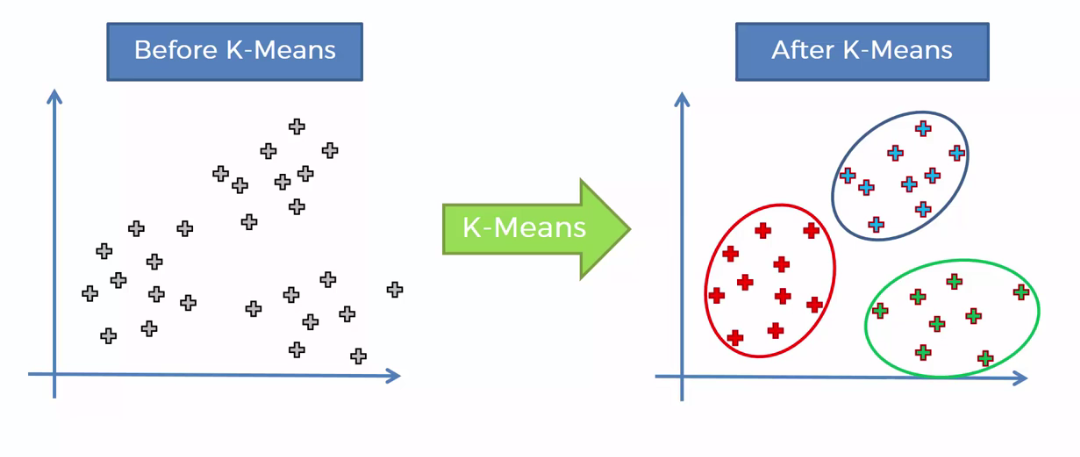
Phân cụm là bài toán học không giám sát để tổ chức dữ liệu thành các nhóm
Thư viện PySpark MLlib hiện hỗ trợ các mô hình phân cụm sau

RDD = sc.textFile("WineData.csv"). \
map(lambda x: x.split(",")).\
map(lambda x: [float(x[0]), float(x[1])])
RDD.take(5)
[[14.23, 2.43], [13.2, 2.14], [13.16, 2.67], [14.37, 2.5], [13.24, 2.87]]
KMeans.train()from pyspark.mllib.clustering import KMeans
model = KMeans.train(RDD, k = 2, maxIterations = 10)
model.clusterCenters
[array([12.25573171, 2.28939024]), array([13.636875 , 2.43239583])]
from math import sqrt
def error(point):
center = model.centers[model.predict(point)]
return sqrt(sum([x**2 for x in (point - center)]))
WSSSE = RDD.map(lambda point: error(point)).reduce(lambda x, y: x + y)
print("Within Set Sum of Squared Error = " + str(WSSSE))
Within Set Sum of Squared Error = 77.96236420499056

wine_data_df = spark.createDataFrame(RDD, schema=["col1", "col2"])
wine_data_df_pandas = wine_data_df.toPandas()
cluster_centers_pandas = pd.DataFrame(model.clusterCenters, columns=["col1", "col2"])
cluster_centers_pandas.head()
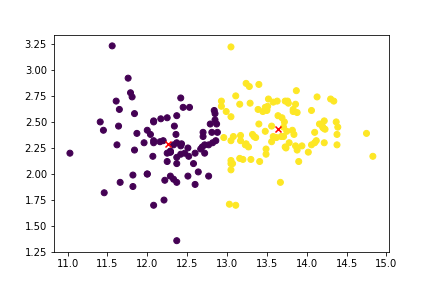
plt.scatter(wine_data_df_pandas["col1"], wine_data_df_pandas["col2"]);
plt.scatter(cluster_centers_pandas["col1"], cluster_centers_pandas["col2"], color="red", marker="x");
Nền tảng Big Data với PySpark