Facet labels and order

Trực quan hóa dữ liệu nâng cao với ggplot2

Rick Scavetta

Founder, Scavetta Academy

A new dataframe
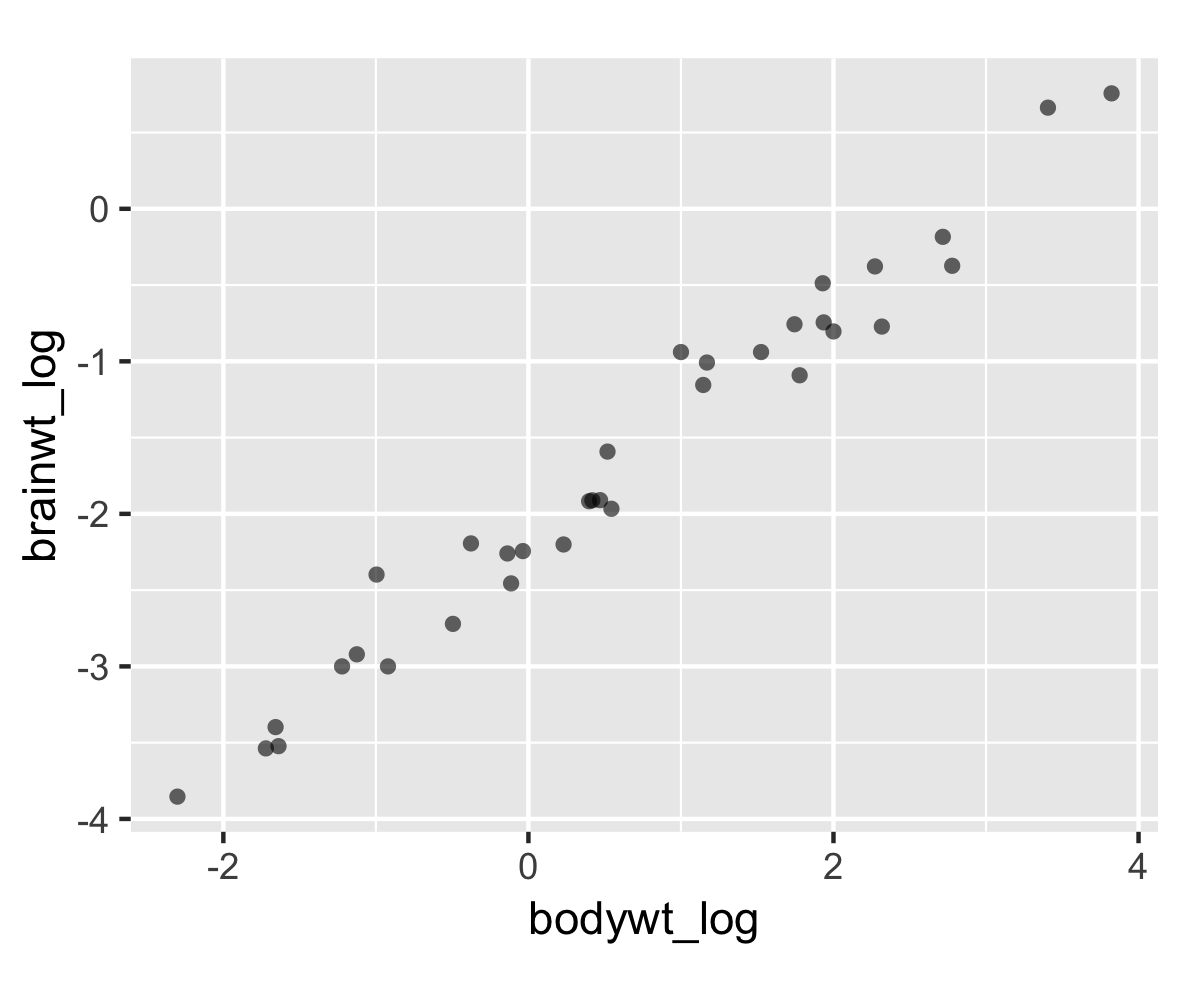
# Plot
p <- ggplot(msleep2, aes(bodywt_log,
                         brainwt_log)) +
  geom_point(alpha = 0.6, shape = 16) +
  coord_fixed()

p

Trực quan hóa dữ liệu nâng cao với ggplot2

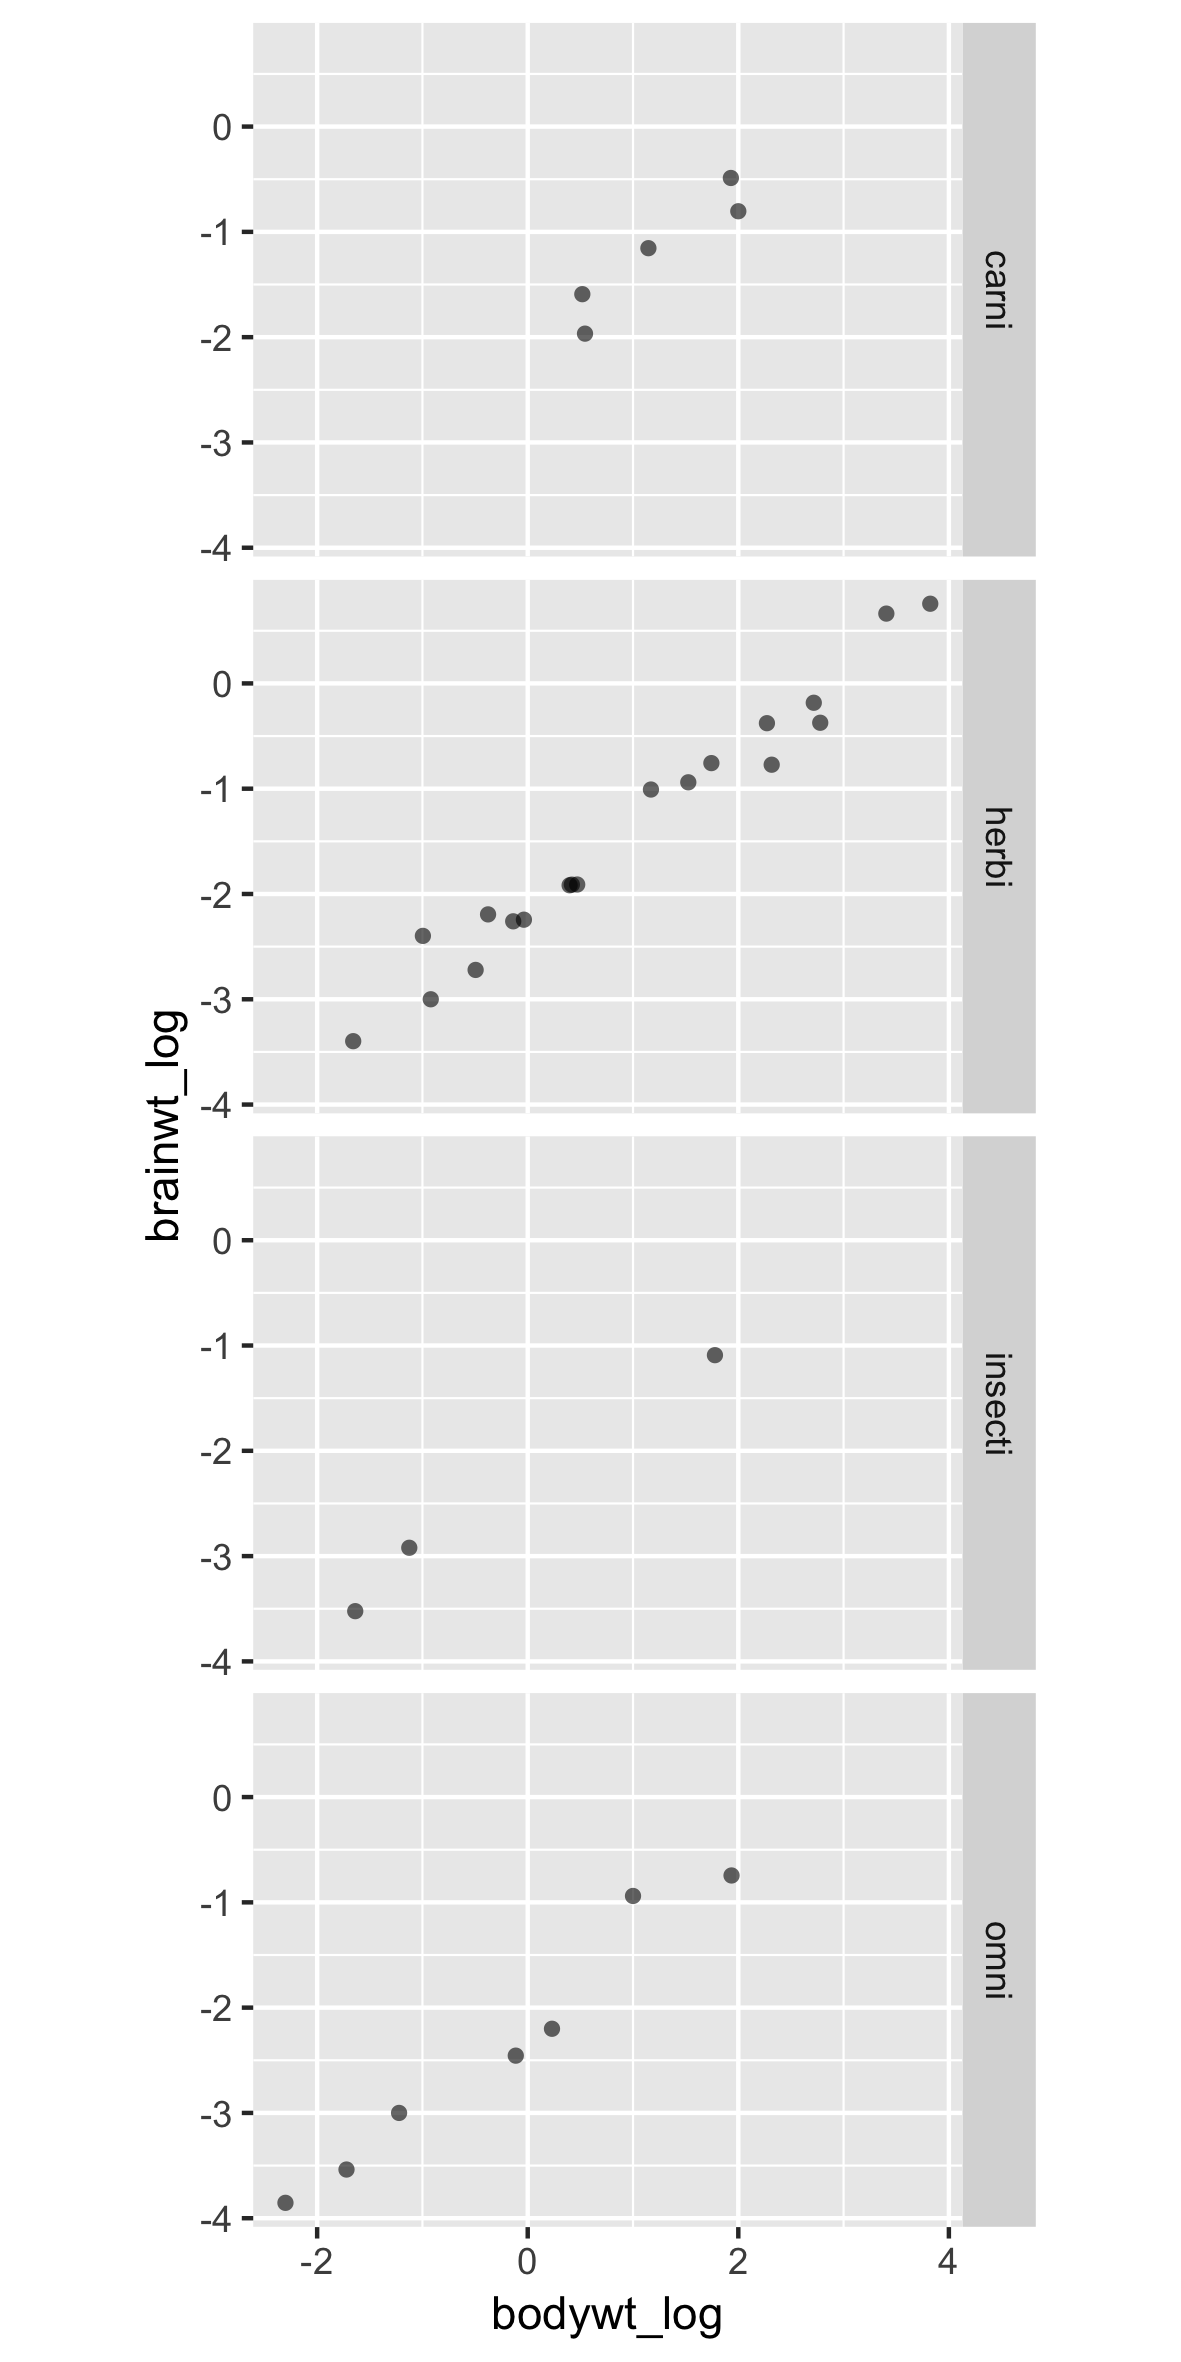
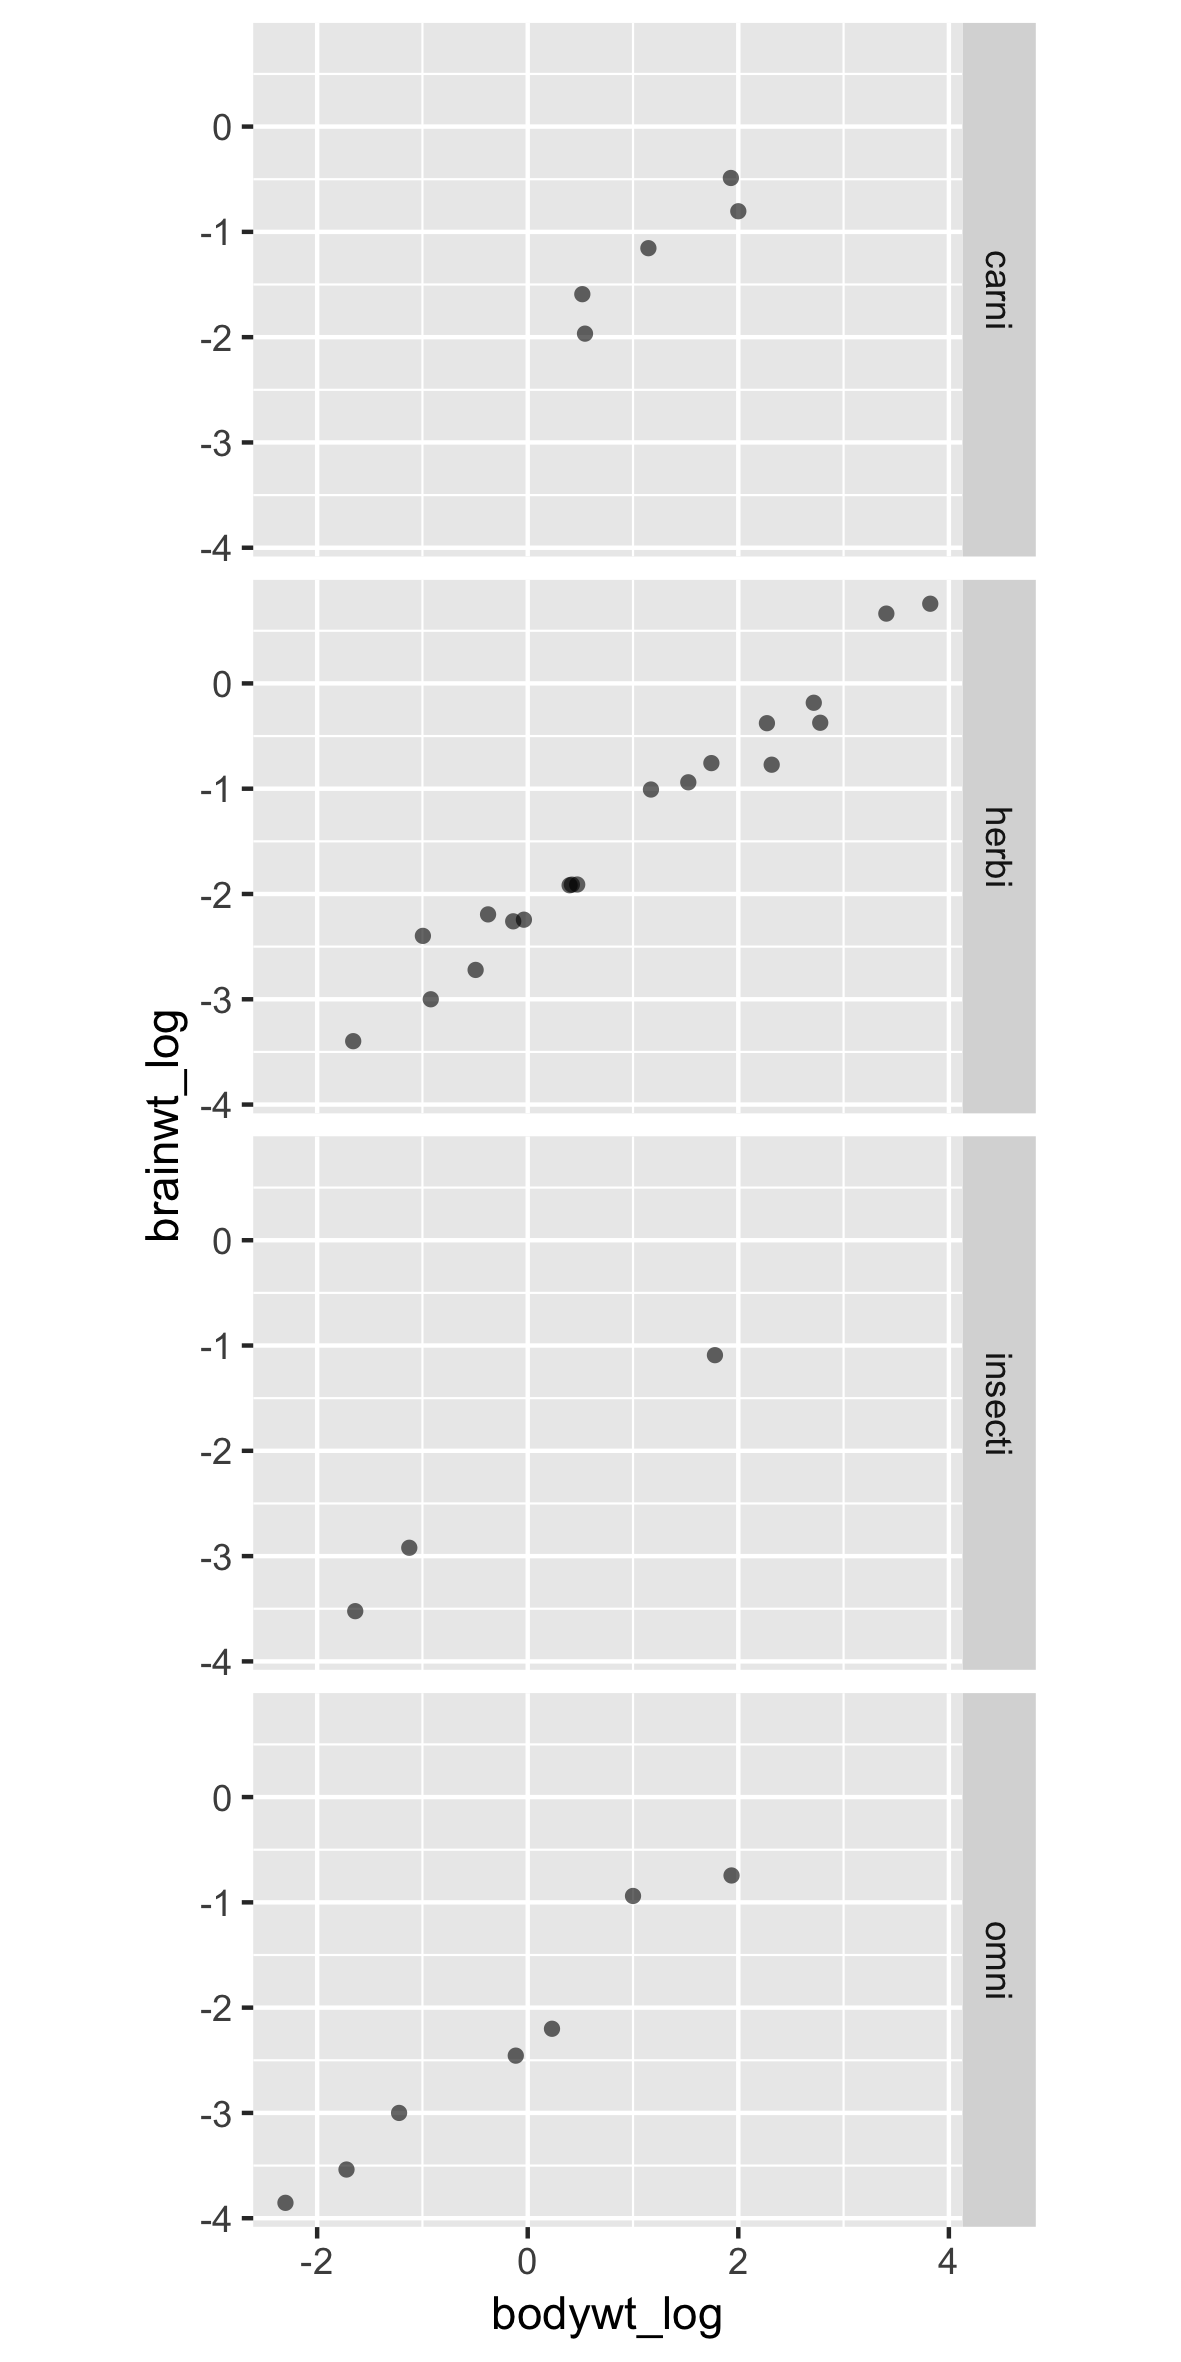
A new dataframe, with facets

p +
  facet_grid(rows = vars(vore))

Trực quan hóa dữ liệu nâng cao với ggplot2

A new dataframe, with facets

p +
  facet_grid(rows = vars(vore))

Trực quan hóa dữ liệu nâng cao với ggplot2

Poor labels and order

p +
  facet_grid(rows = vars(vore))

Two typical problems with facets:

  • Poorly labeled (e.g. non descriptive)
  • Wrong or inappropriate order

Trực quan hóa dữ liệu nâng cao với ggplot2

Poor labels and order

p +
  facet_grid(rows = vars(vore))

Solutions:

  • Easy: Add labels in ggplot
  • Better: Relabel and rearrange factor variables in your dataframe

Trực quan hóa dữ liệu nâng cao với ggplot2

The labeller argument

# Default is to label the value
p +
  facet_grid(rows = vars(vore), 
             labeller = label_value)

Trực quan hóa dữ liệu nâng cao với ggplot2

Using label_both adds the variable name
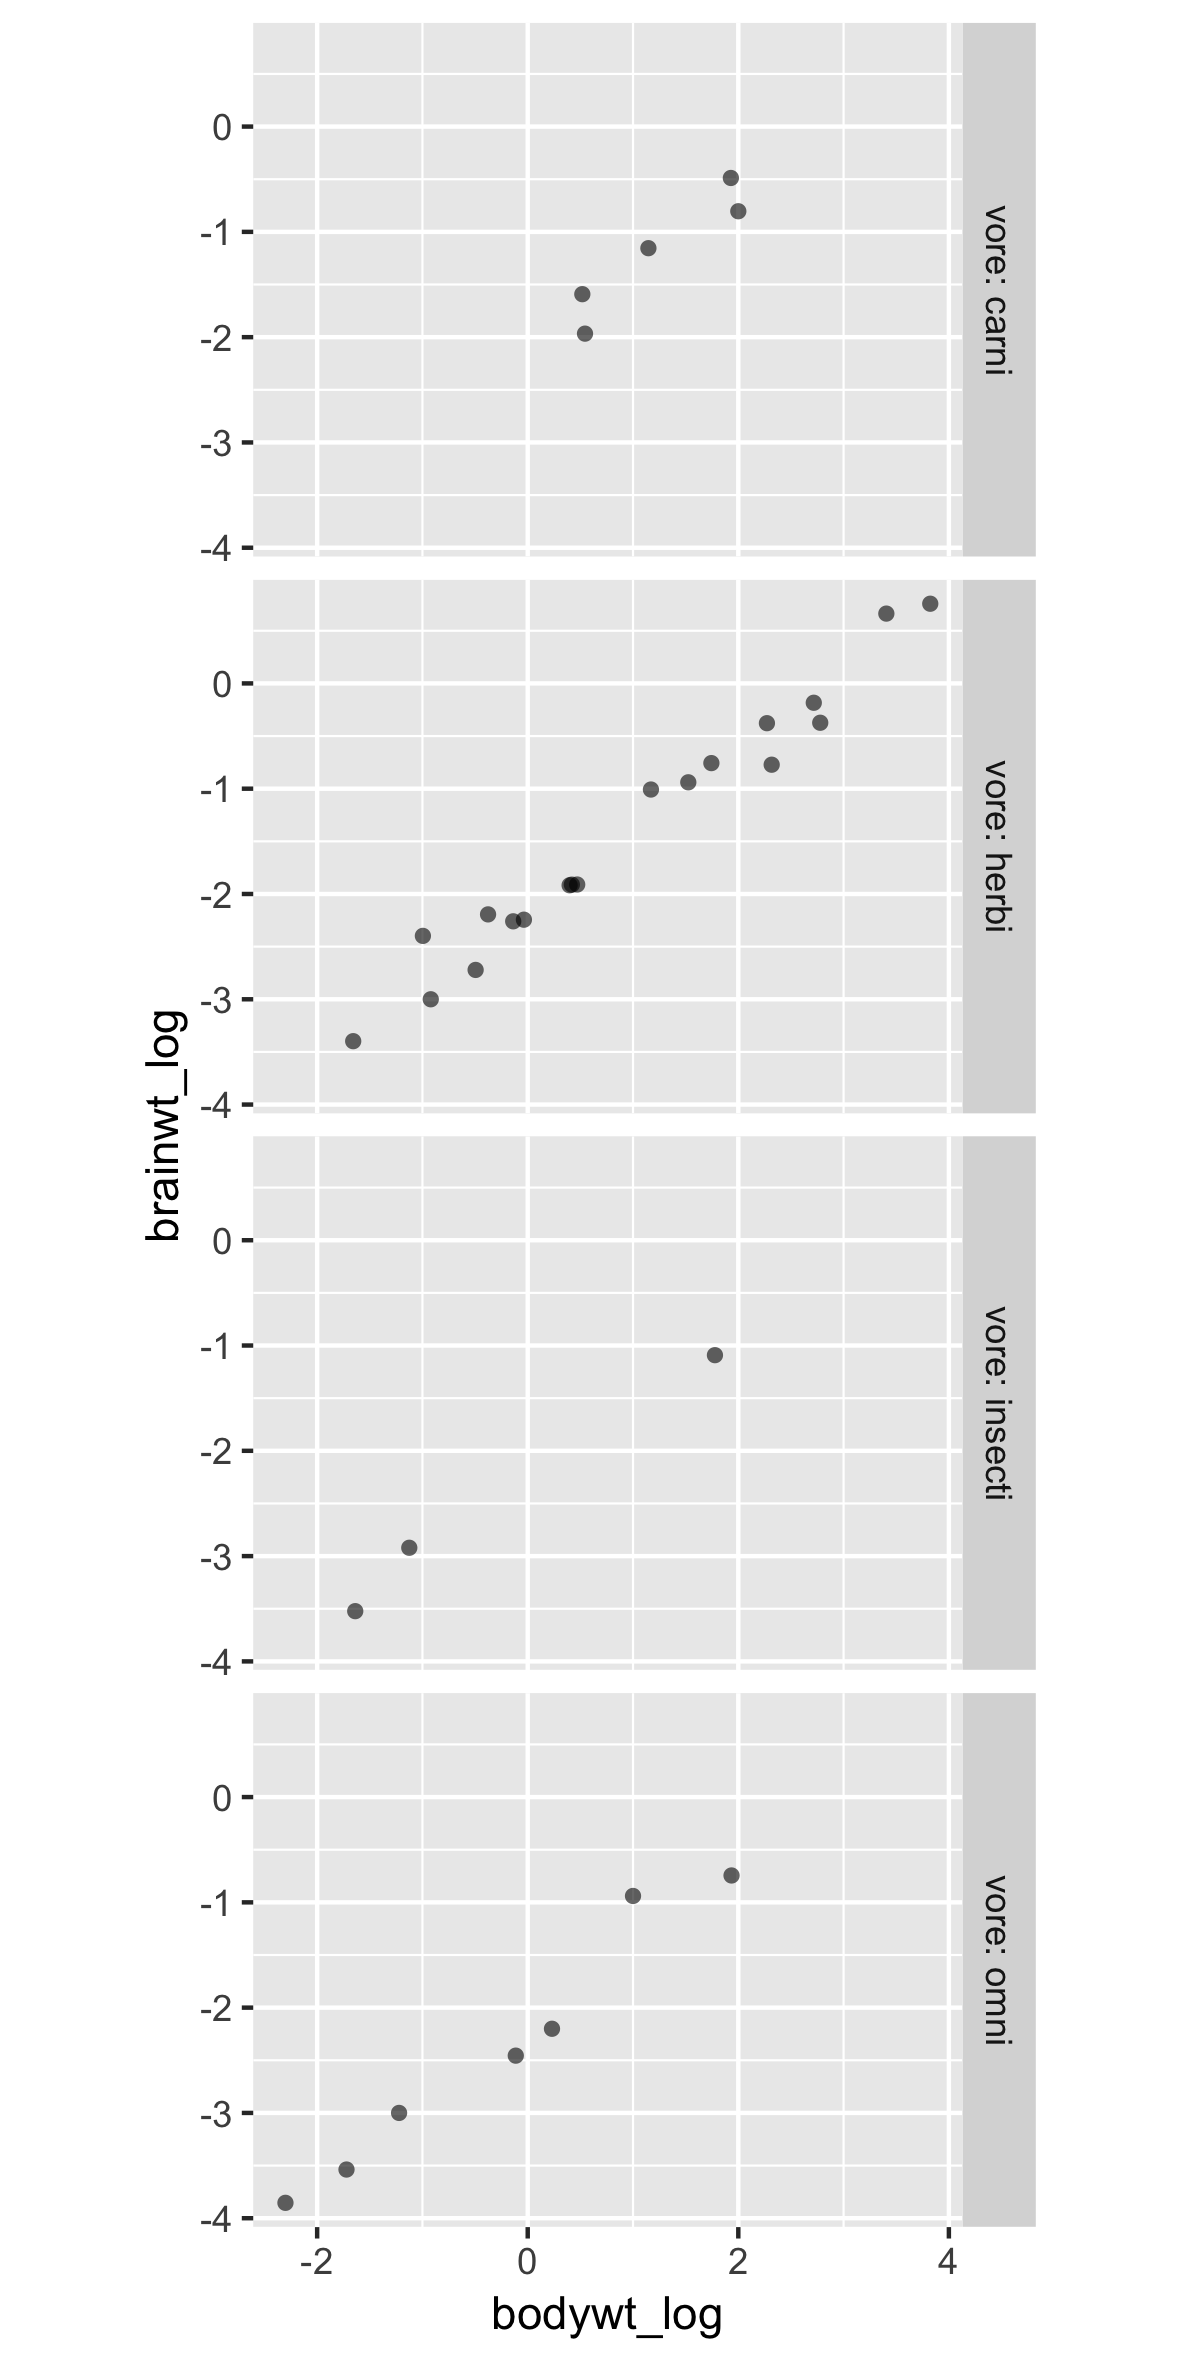
# Print variable name also
p +
  facet_grid(rows = vars(vore), 
               labeller = label_both)

Trực quan hóa dữ liệu nâng cao với ggplot2

Two variables on one side

p +
  facet_grid(rows = vars(vore, 
                         conservation))

Trực quan hóa dữ liệu nâng cao với ggplot2

Using label_context avoids ambiguity

p +
  facet_grid(rows = vars(vore,
                         conservation),
               labeller = label_context)

Trực quan hóa dữ liệu nâng cao với ggplot2

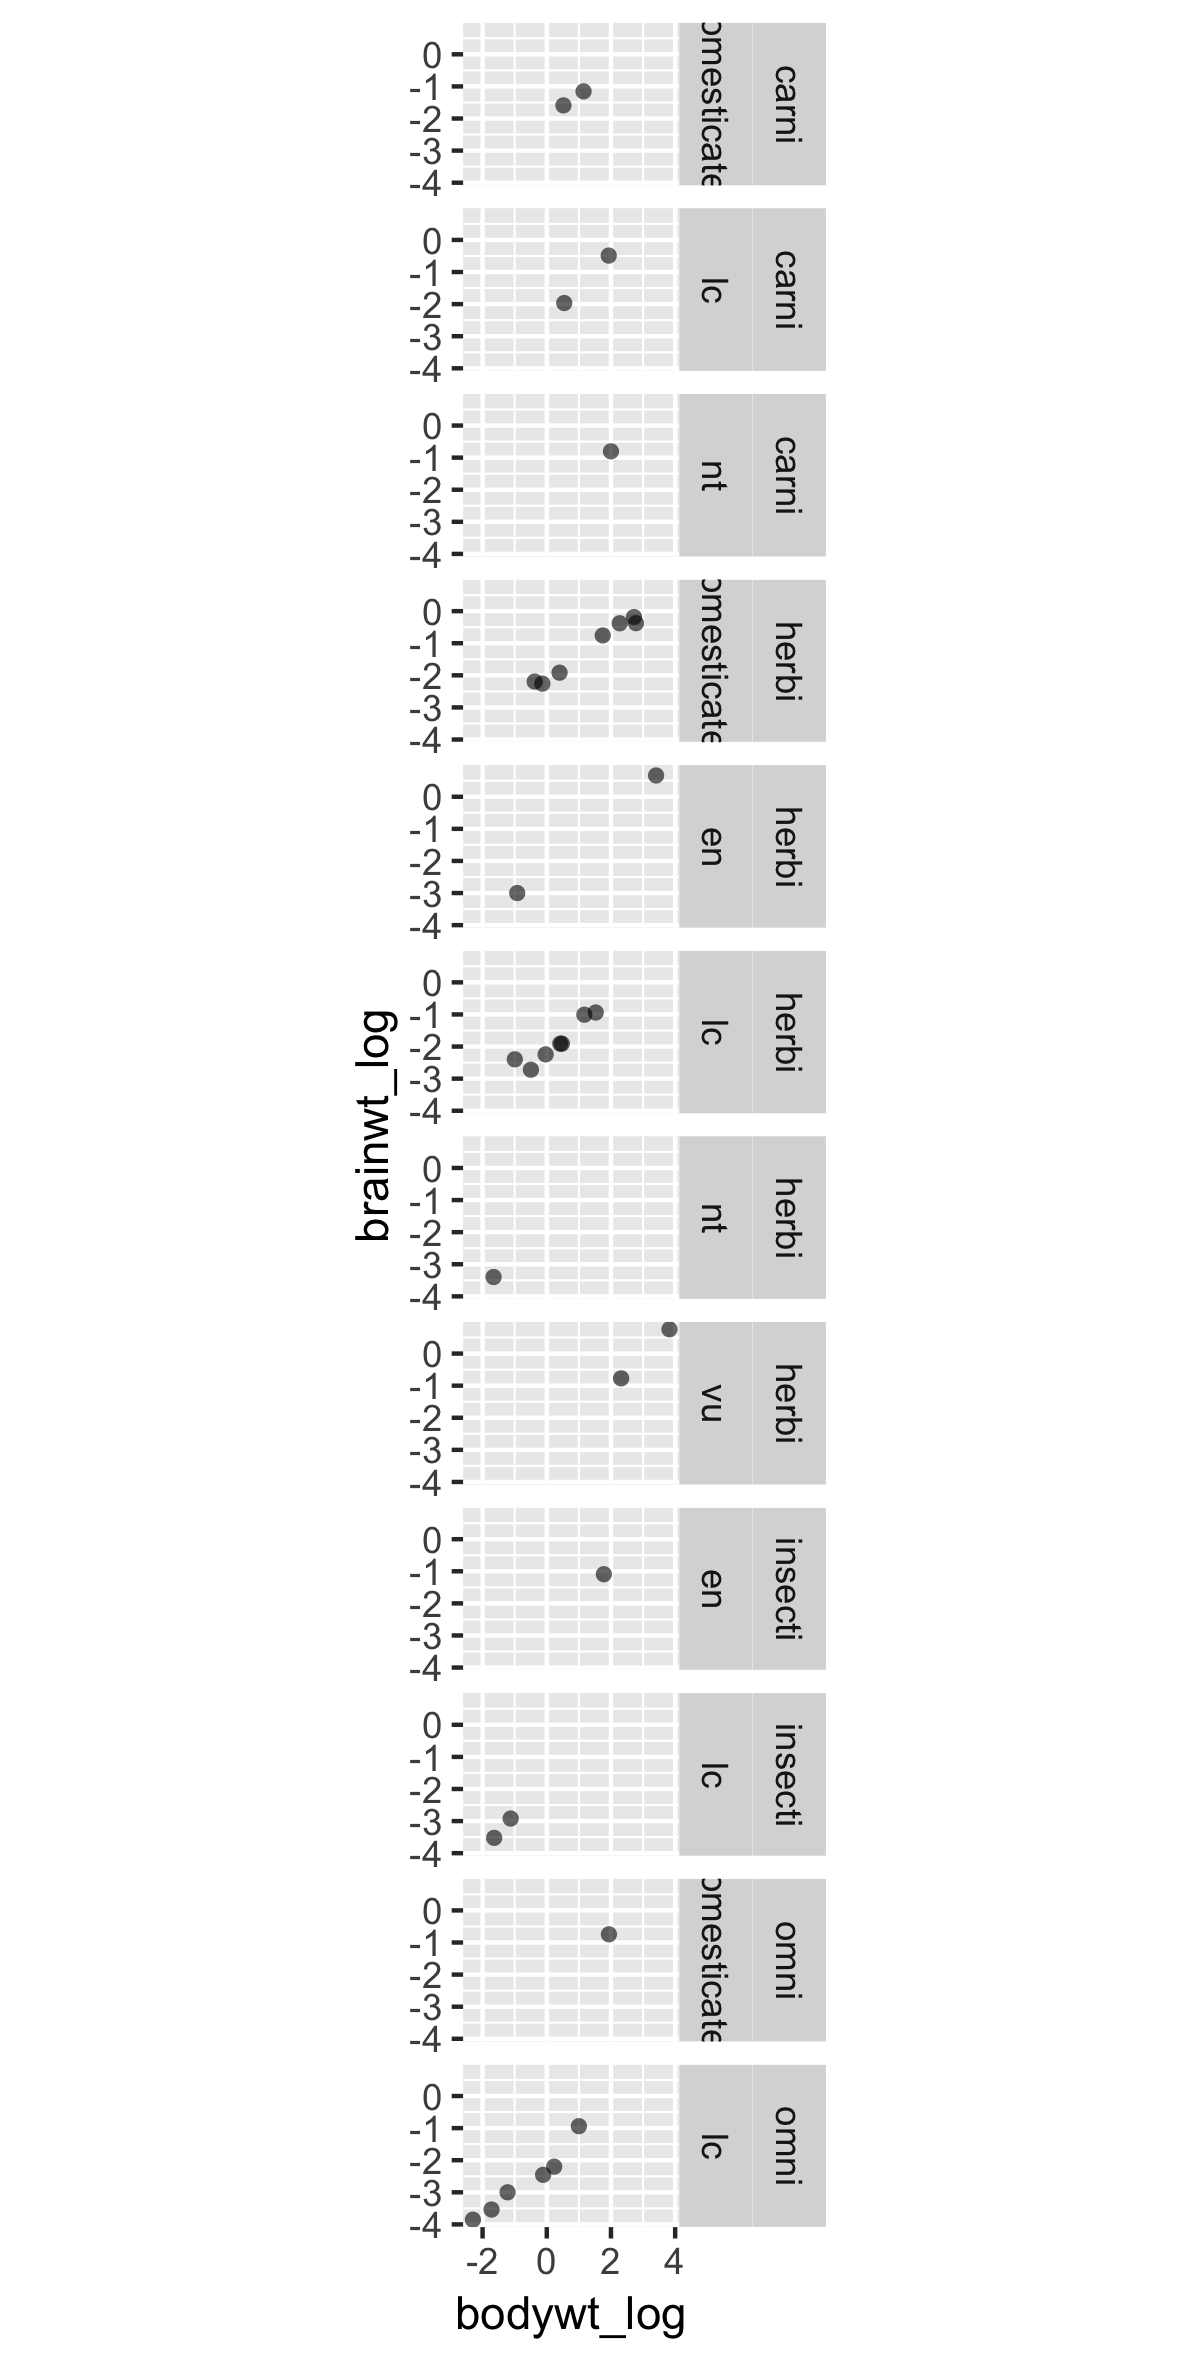
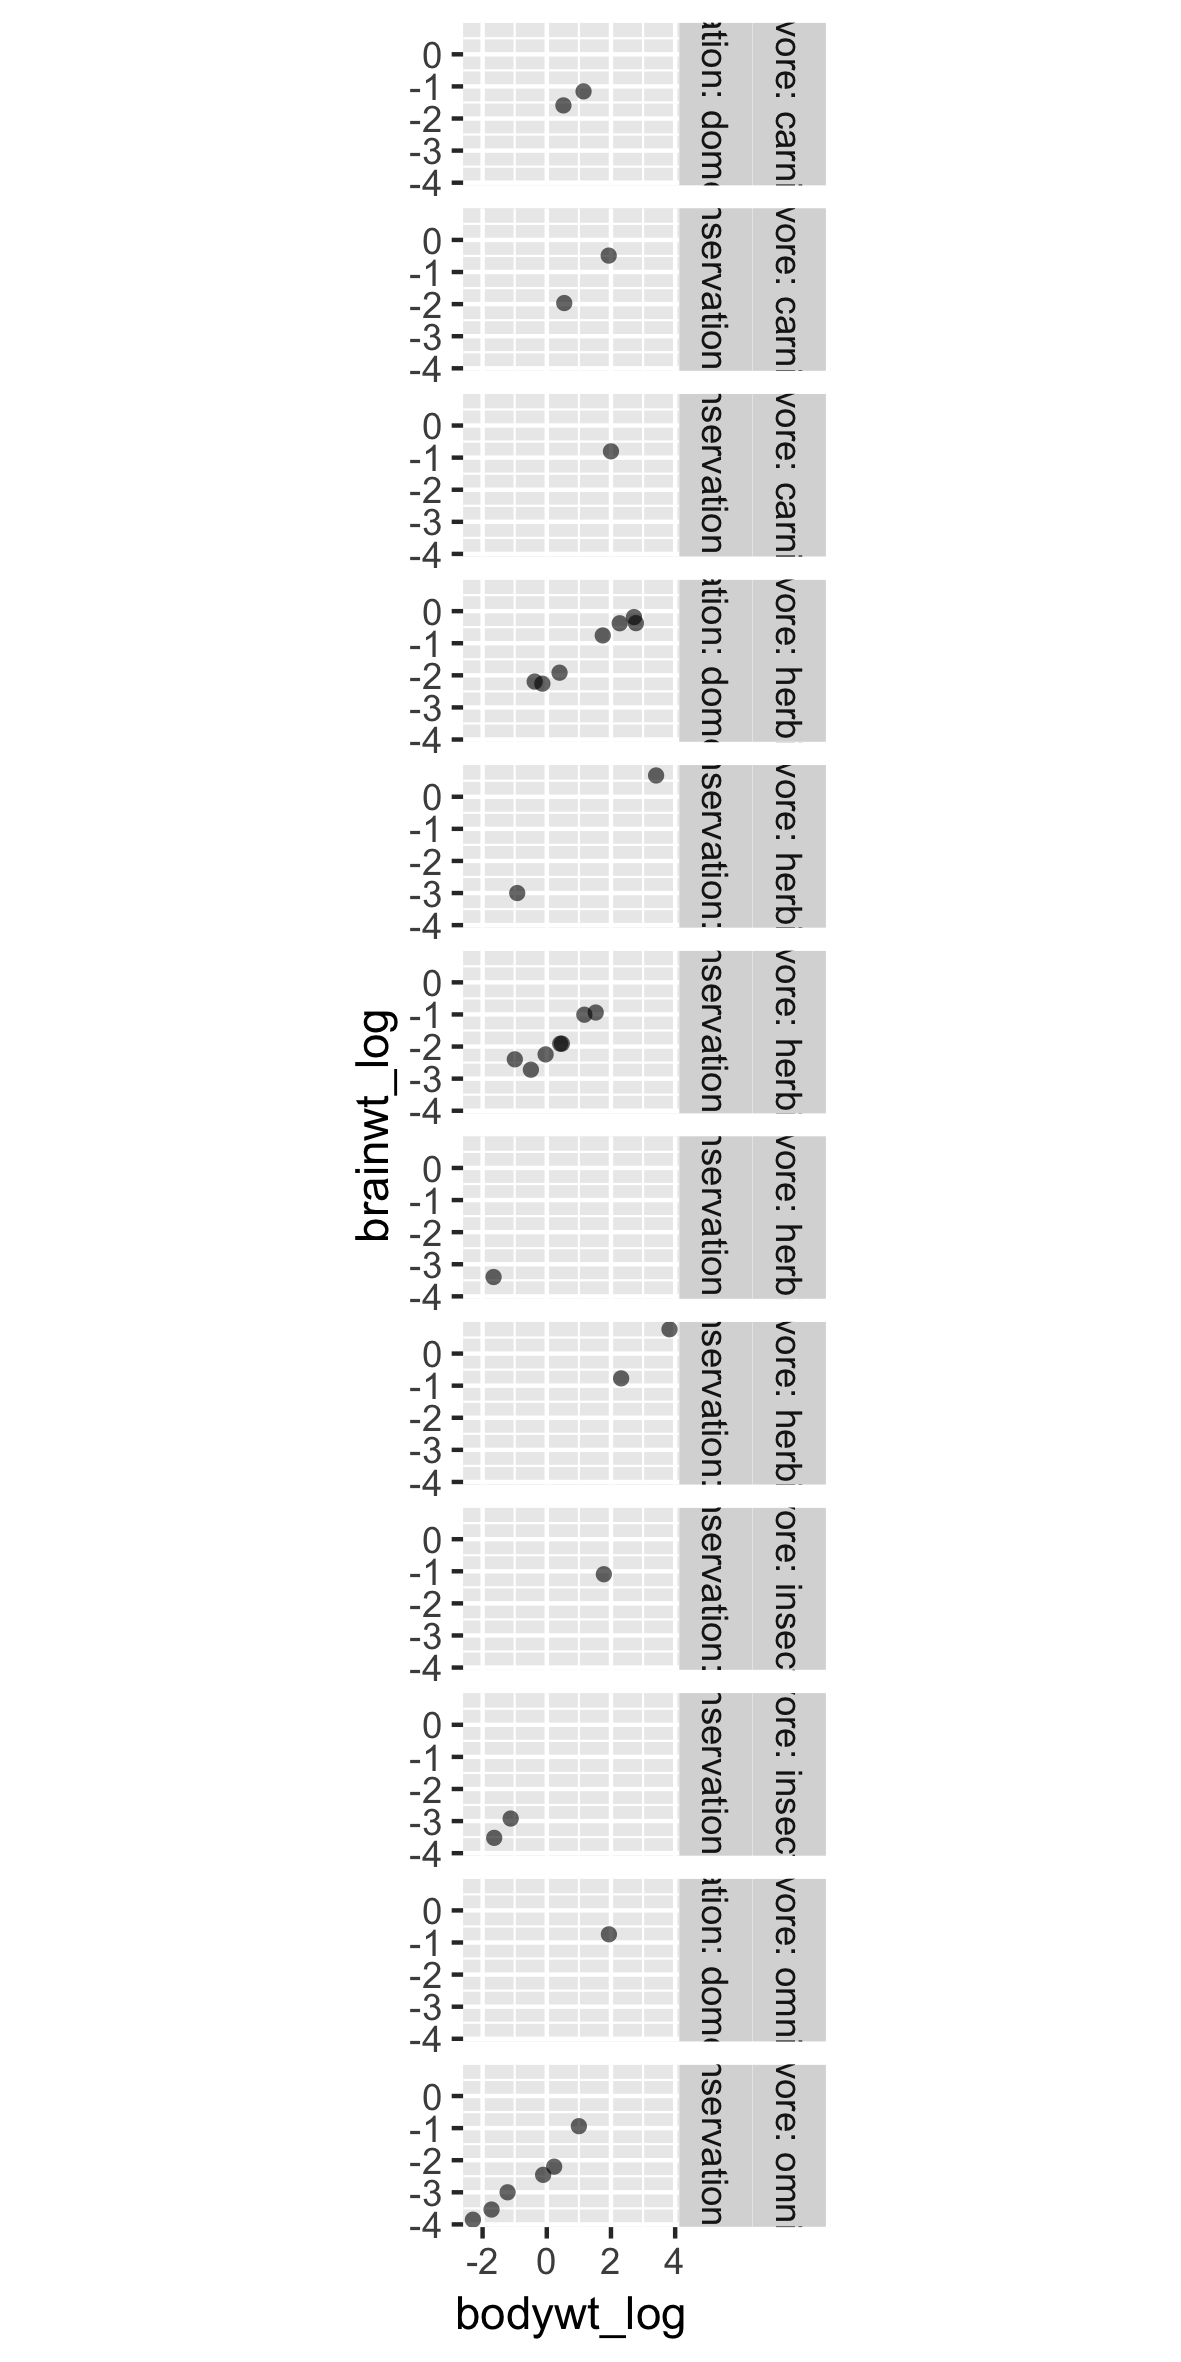
Use rows and columns when appropriate
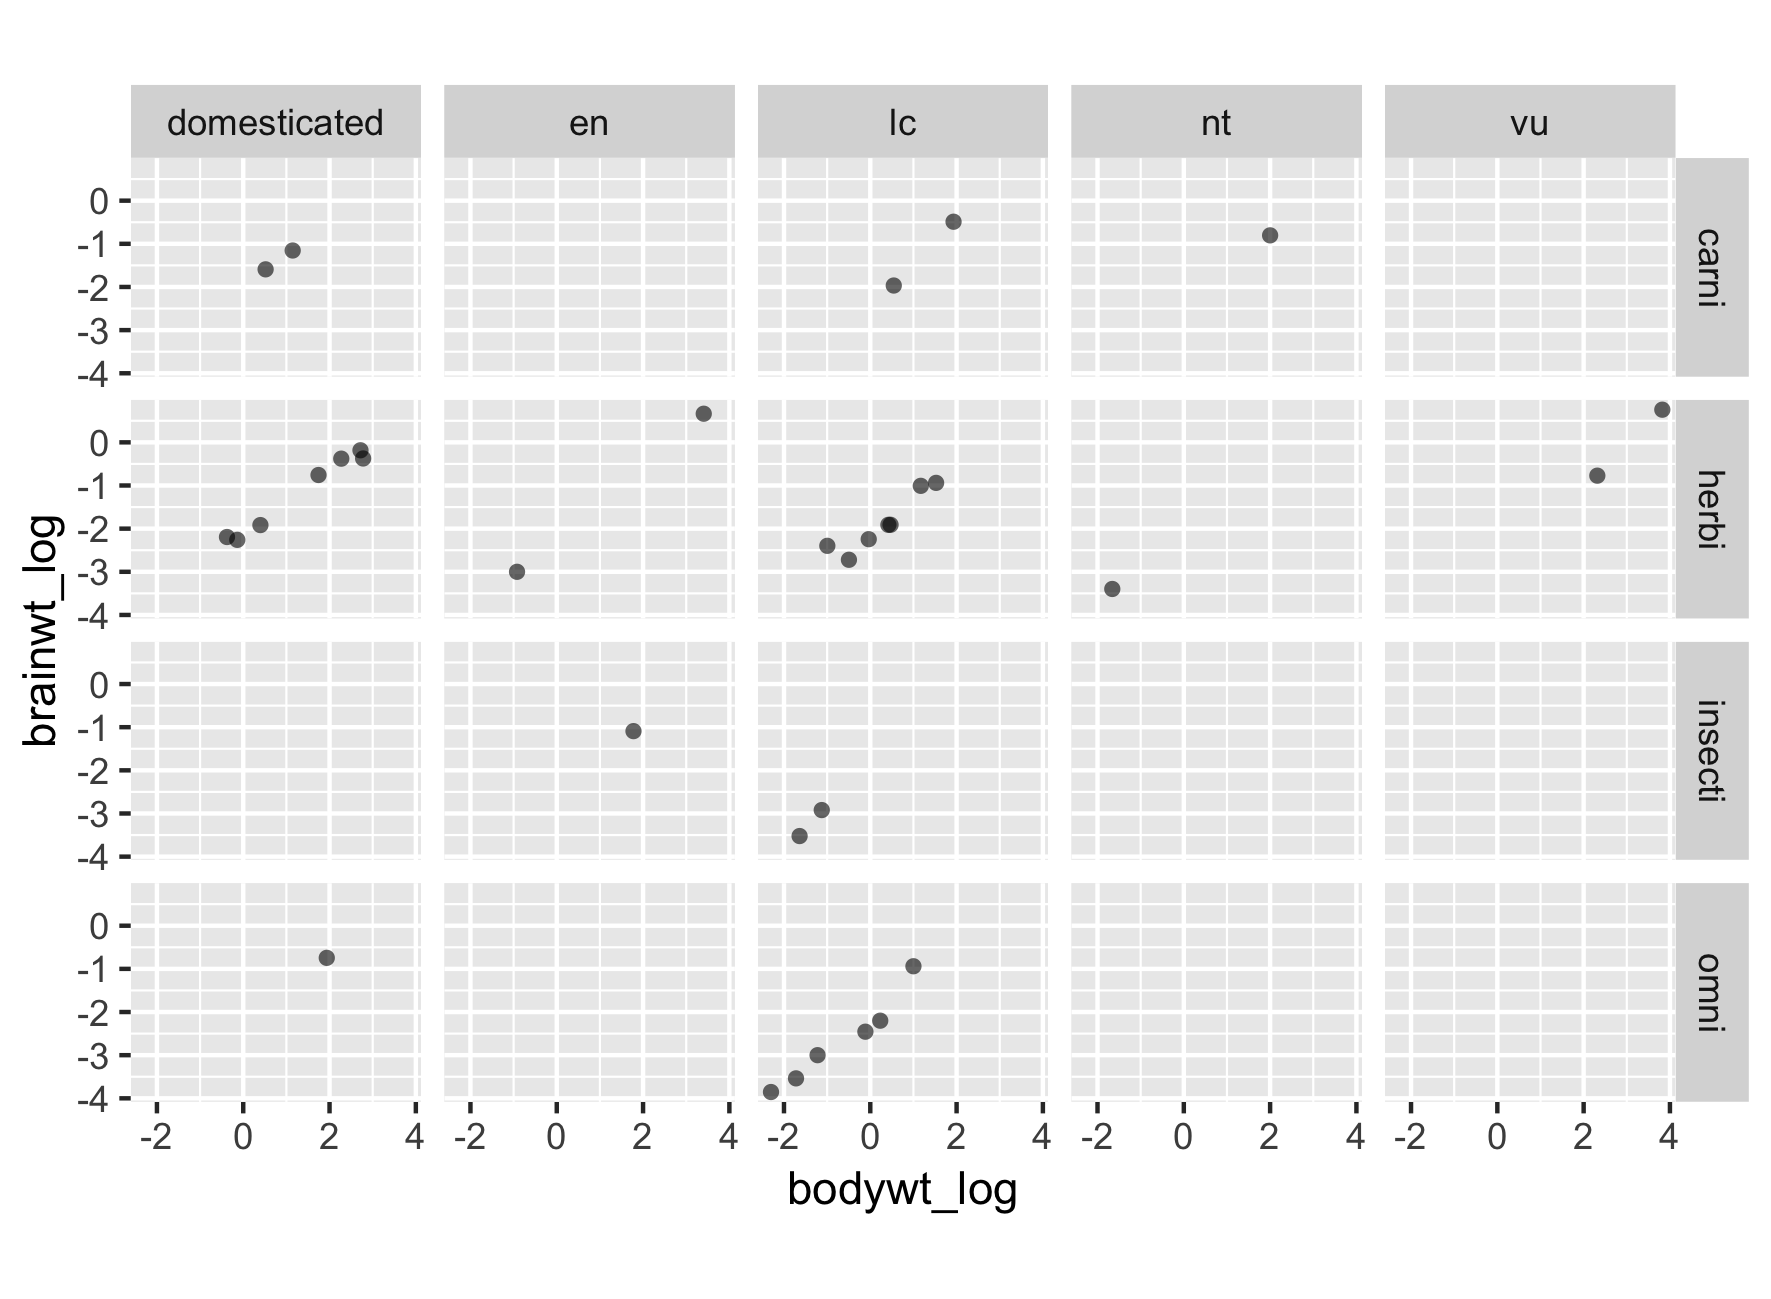
p +
  facet_grid(rows = vars(vore), 
             cols = vars(conservation),
             labeller = label_context)

Trực quan hóa dữ liệu nâng cao với ggplot2

Use rows and columns when appropriate

p +
  facet_grid(rows = vars(vore), 
             cols = vars(conservation))

Trực quan hóa dữ liệu nâng cao với ggplot2

Use rows and columns when appropriate

Trực quan hóa dữ liệu nâng cao với ggplot2

Relabeling and reordering factors

msleep2$conservation <- fct_recode(msleep2$conservation,
                                   Domesticated = "domesticated",
                                   `Least concern` = "lc",
                                   `Near threatened` = "nt",
                                   Vulnerable = "vu",
                                   Endangered = "en")

msleep2$vore = fct_recode(msleep2$vore,
                          Carnivore = "carni",
                          Herbivore = "herbi",
                          Insectivore = "insecti",
                          Omnivore = "omni")
Trực quan hóa dữ liệu nâng cao với ggplot2

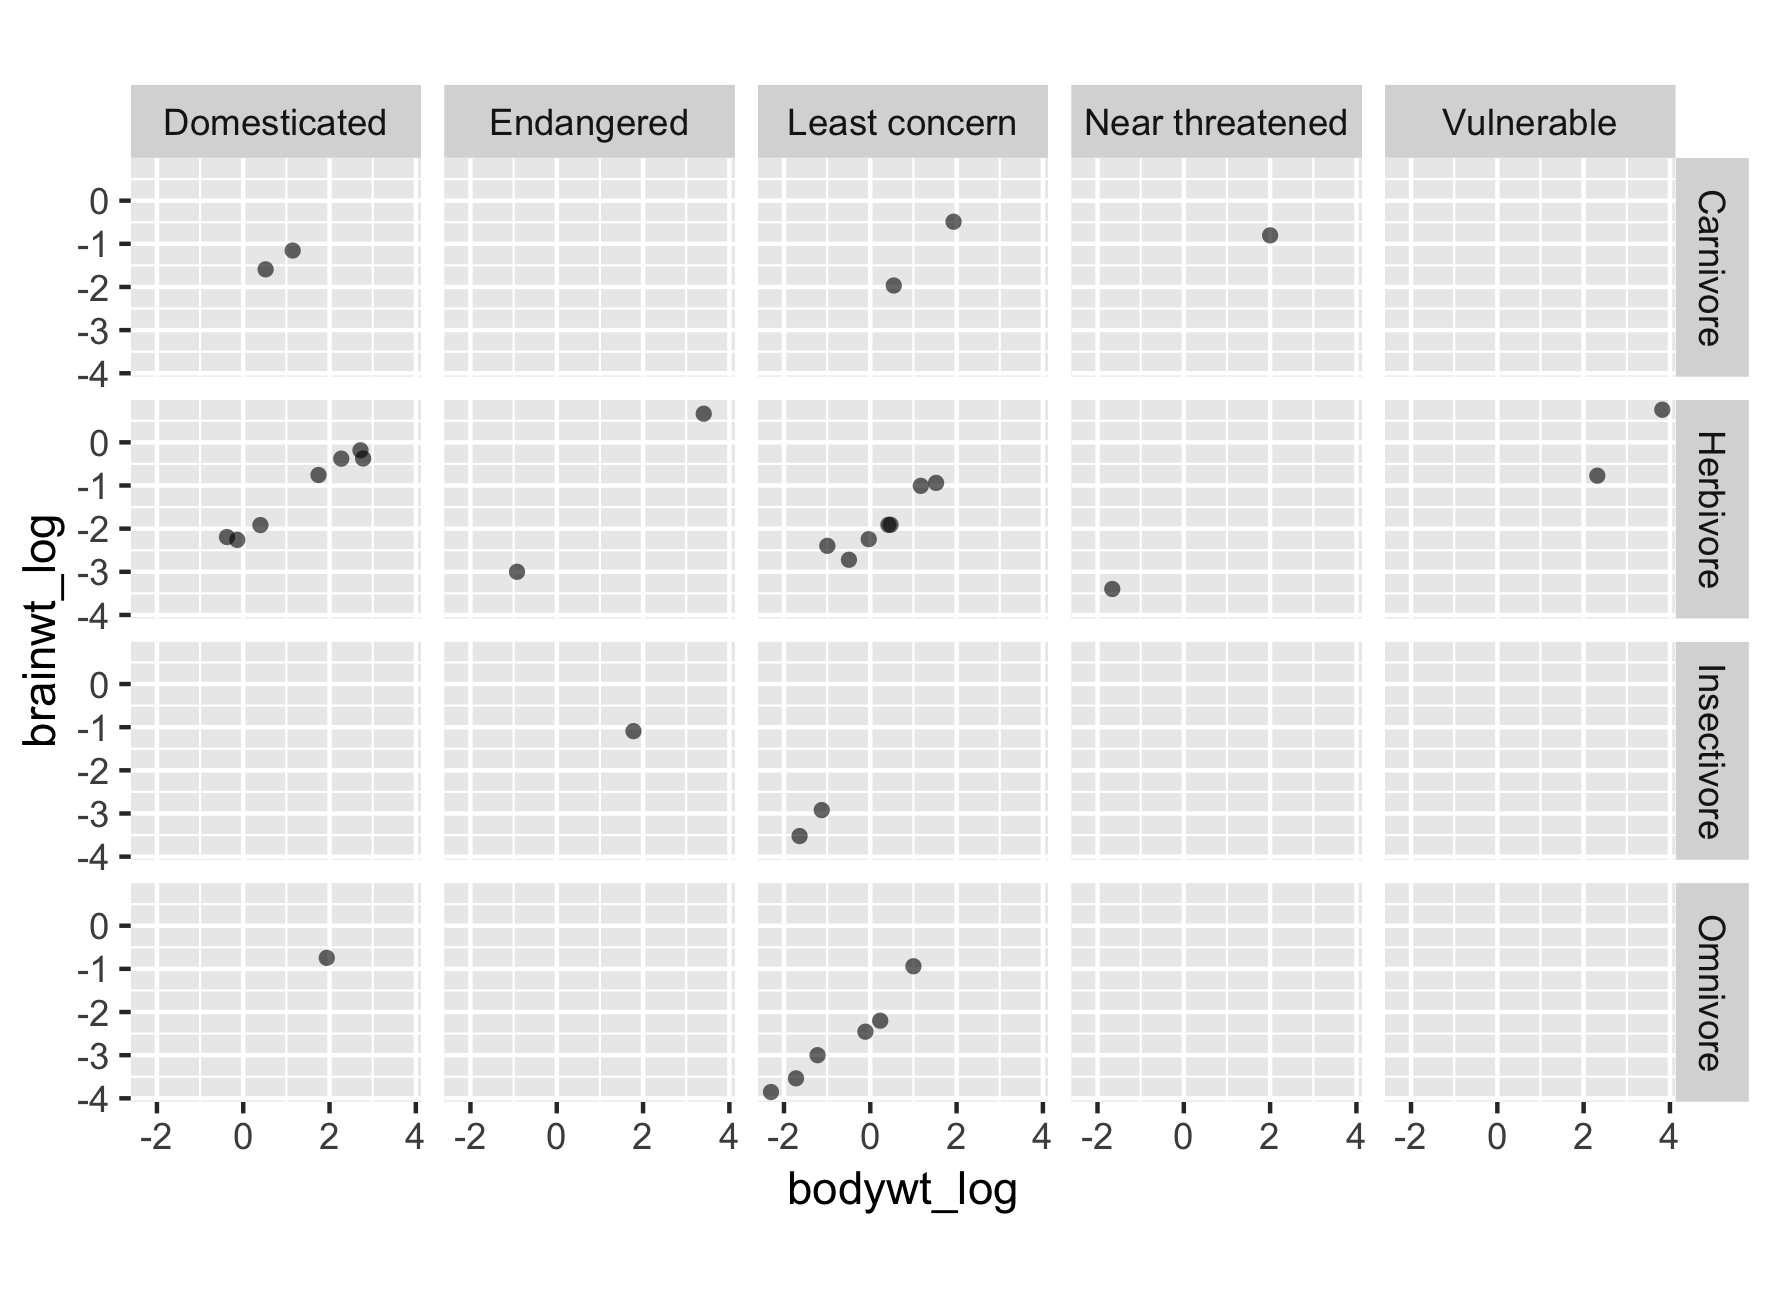
Reinitialize plot with new labels

# Plot
p <- ggplot(msleep2, aes(bodywt_log,
                         brainwt_log)) +
  geom_point(alpha = 0.6, shape = 16) +
  coord_fixed()

p +
  facet_grid(rows = vars(vore), 
             cols = vars(conservation)) 

Trực quan hóa dữ liệu nâng cao với ggplot2

Reinitialize plot with new labels

Trực quan hóa dữ liệu nâng cao với ggplot2

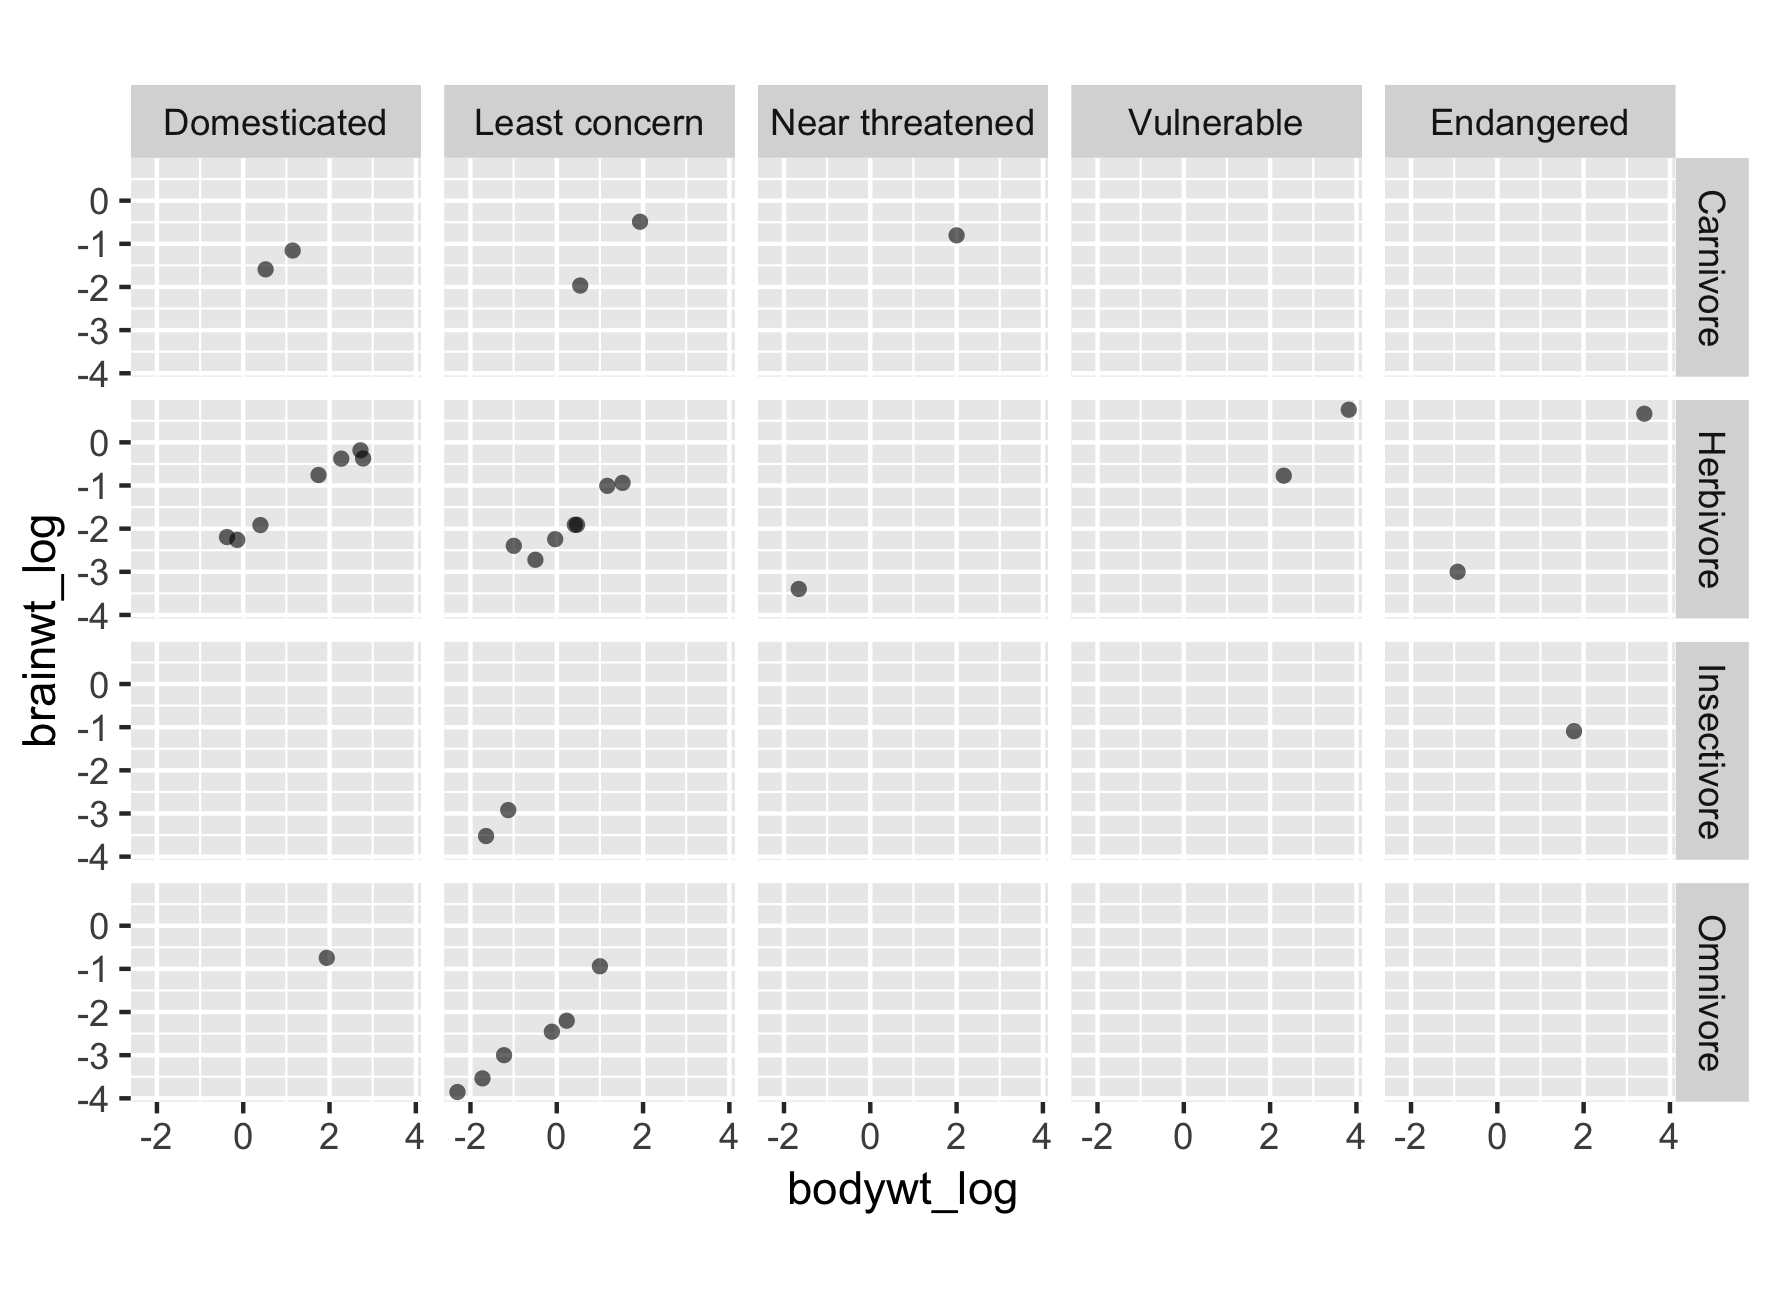
Changing the order of levels

# Change order of levels:
msleep2$conservation = fct_relevel(msleep2$conservation,
                                   c("Domesticated",
                                     "Least concern",
                                     "Near threatened",
                                     "Vulnerable",
                                     "Endangered"))

Trực quan hóa dữ liệu nâng cao với ggplot2

Reinitialize plot with new order

Trực quan hóa dữ liệu nâng cao với ggplot2

Let's practice!

Trực quan hóa dữ liệu nâng cao với ggplot2

Preparing Video For Download...