Best practices: bar plots

Trực quan hóa dữ liệu nâng cao với ggplot2

Rick Scavetta

Founder, Scavetta Academy

In this chapter

  • Common pitfalls in Data Viz
  • Best way to represent data
    • For effective explanatory (communication), and
    • For effective exploratory (investigation) plots
Trực quan hóa dữ liệu nâng cao với ggplot2

Bar plots

  • Two types
    • Absolute values
    • Distributions
Trực quan hóa dữ liệu nâng cao với ggplot2

Mammalian sleep

Observations: 76
Variables: 3
$ vore  <chr> "carni", "omni", "herbi", "omni", "herbi", "herbi", "carni", …
$ total <dbl> 12.1, 17.0, 14.4, 14.9, 4.0, 14.4, 8.7, 10.1, 3.0, 5.3, 9.4, …
$ rem   <dbl> NA, 1.8, 2.4, 2.3, 0.7, 2.2, 1.4, 2.9, NA, 0.6, 0.8, 0.7, 1.5…
Trực quan hóa dữ liệu nâng cao với ggplot2

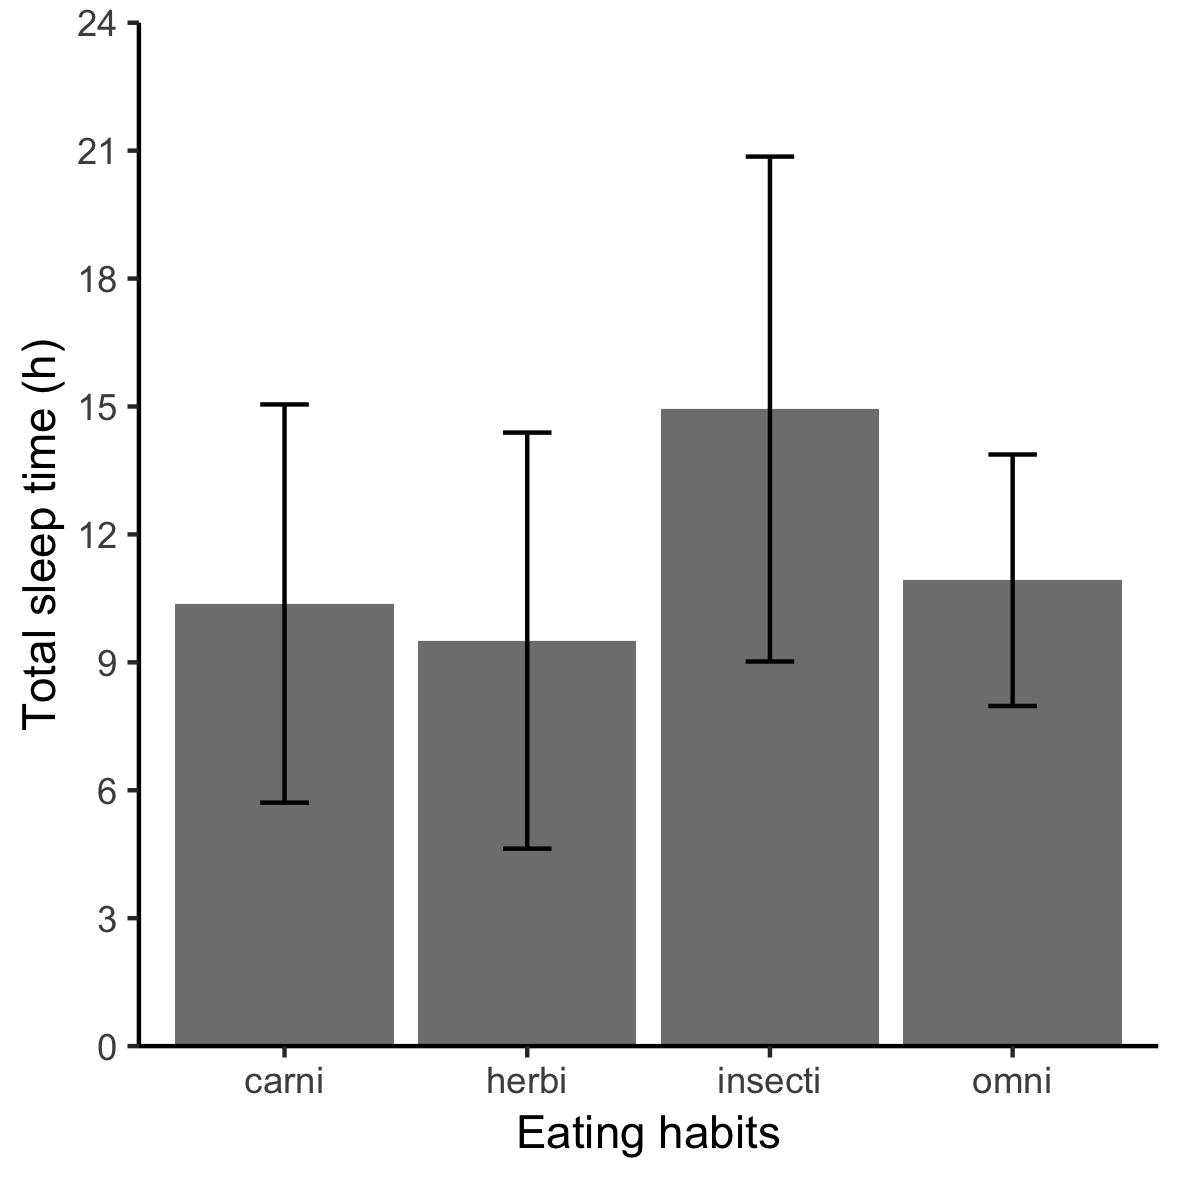
Dynamite plot

d <- ggplot(sleep, aes(vore, total)) +
 # ...

d + 
  stat_summary(fun = mean,
               geom = "bar",
               fill = "grey50") +
  stat_summary(fun.data = mean_sdl,
               fun.args = list(mult = 1),
               geom = "errorbar", 
               width = 0.2)

Trực quan hóa dữ liệu nâng cao với ggplot2

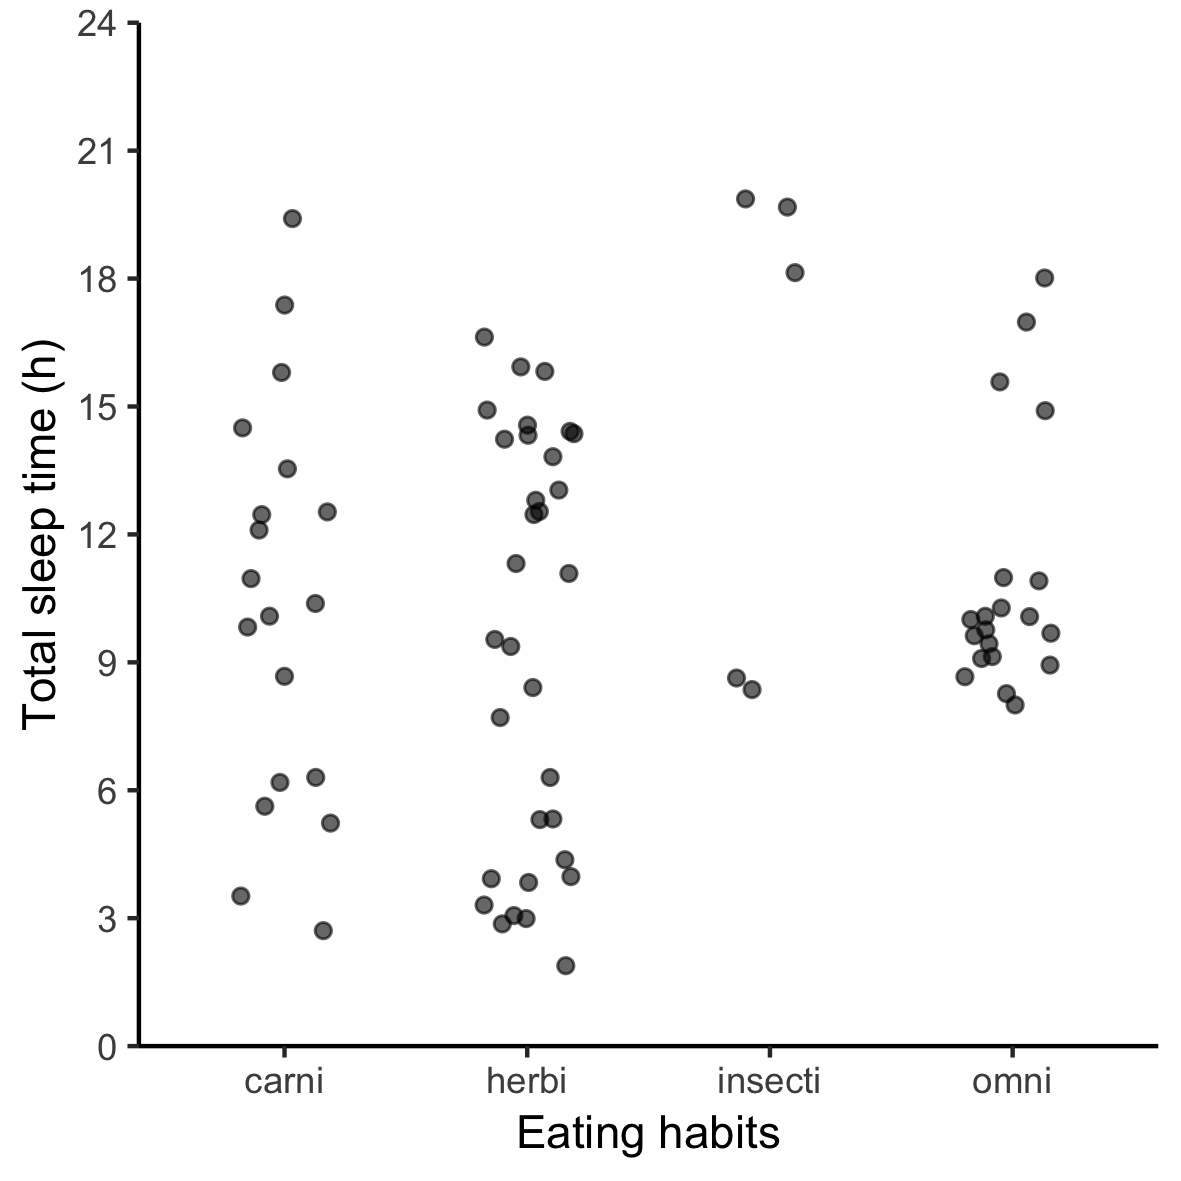
Individual data points

# position
posn_j <- position_jitter(width = 0.2)

# plot
d +
  geom_point(alpha = 0.6, 
             position = posn_j)

Trực quan hóa dữ liệu nâng cao với ggplot2

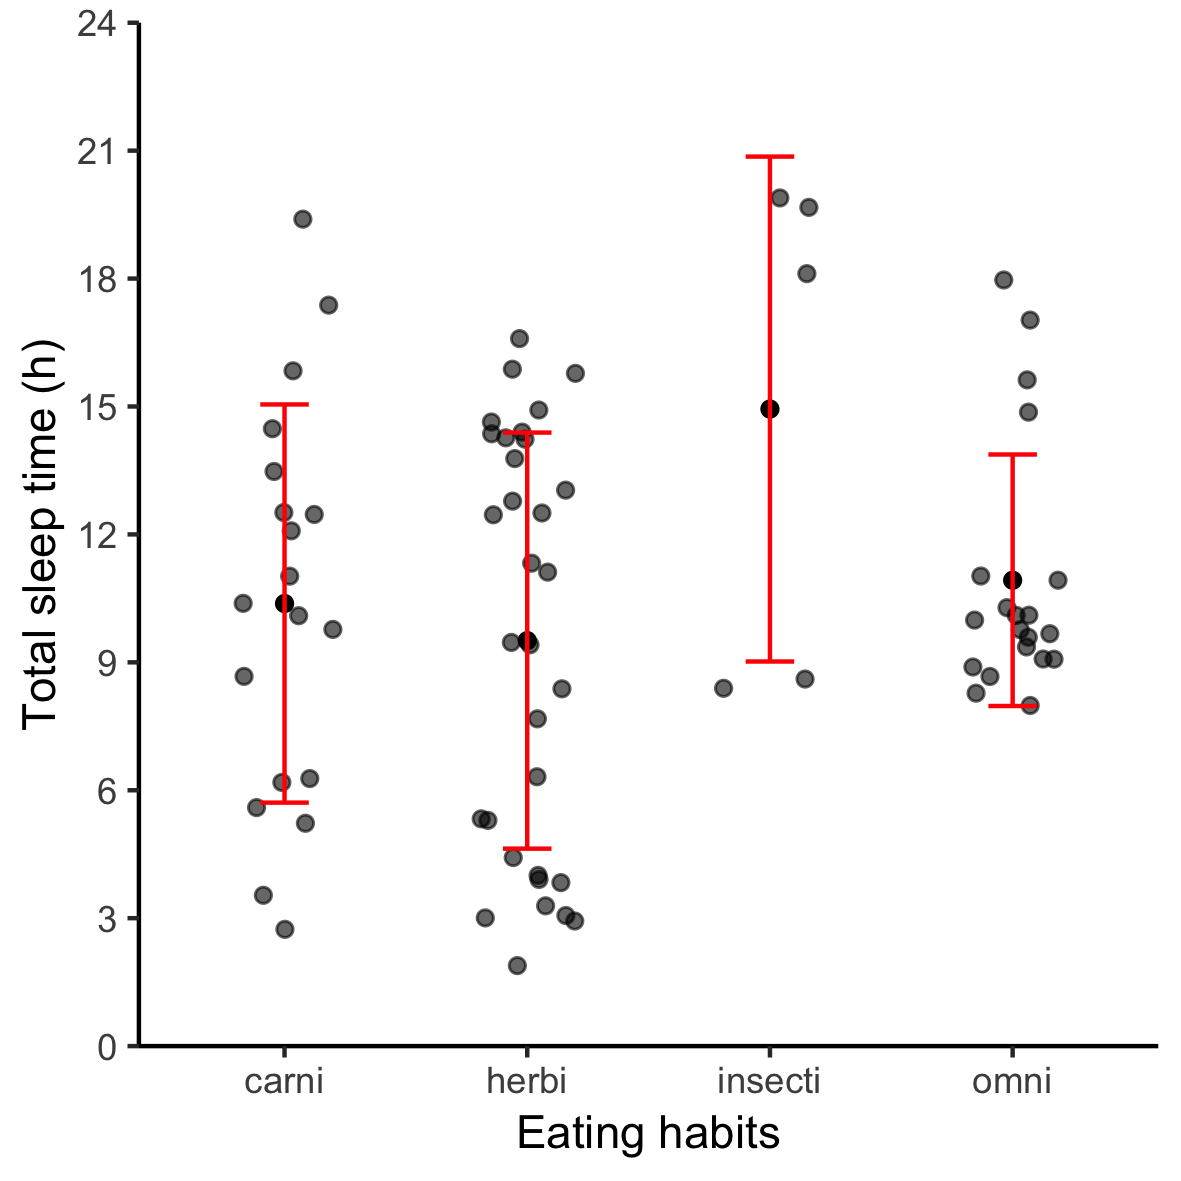
geom_errorbar()

d +
  geom_point(...) +
  stat_summary(fun = mean, 
               geom = "point", 
               fill = "red") +
  stat_summary(fun.data = mean_sdl, 
               fun.args = list(mult = 1), 
               geom = "errorbar", 
               width = 0.2, 
               color = "red")

Trực quan hóa dữ liệu nâng cao với ggplot2

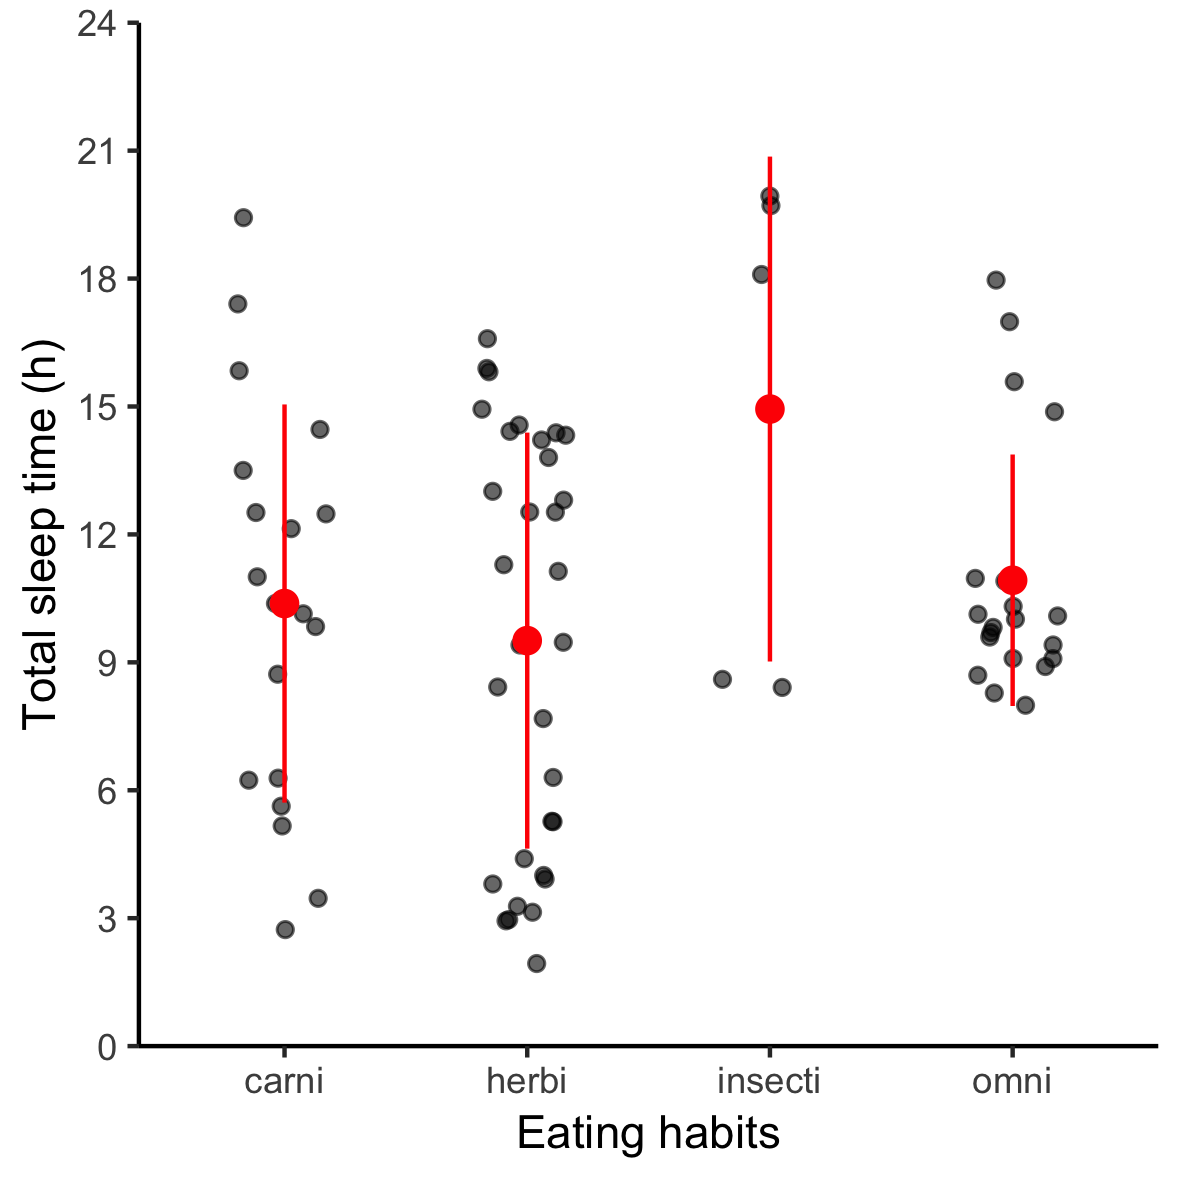
geom_pointrange()

d +
  geom_point(...) +
  stat_summary(fun.data = mean_sdl, 
               mult = 1, 
               width = 0.2, 
               color = "red")

Trực quan hóa dữ liệu nâng cao với ggplot2

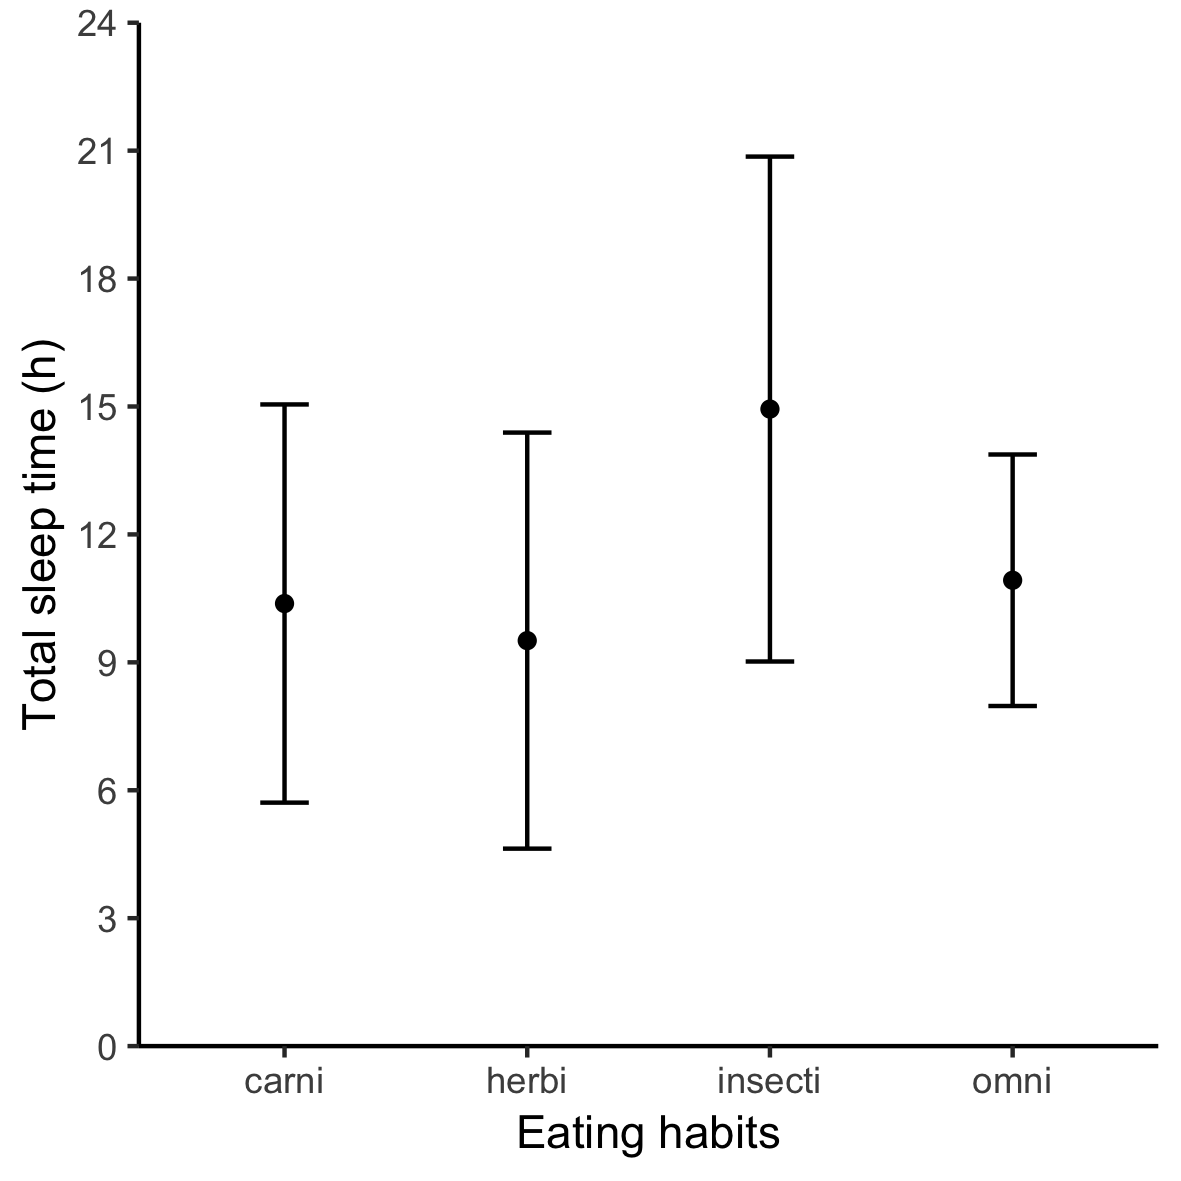
Without data points

d +
  stat_summary(fun = mean, 
               geom = "point") +
  stat_summary(fun.data = mean_sdl, 
               fun.args = list(mult = 1), 
               geom = "errorbar", 
               width = 0.2)

Trực quan hóa dữ liệu nâng cao với ggplot2

Bars are not necessary

Trực quan hóa dữ liệu nâng cao với ggplot2

Ready for exercises!

Trực quan hóa dữ liệu nâng cao với ggplot2

Preparing Video For Download...