Coordinates vs. scales
Trực quan hóa dữ liệu nâng cao với ggplot2

Rick Scavetta
Founder, Scavetta Academy
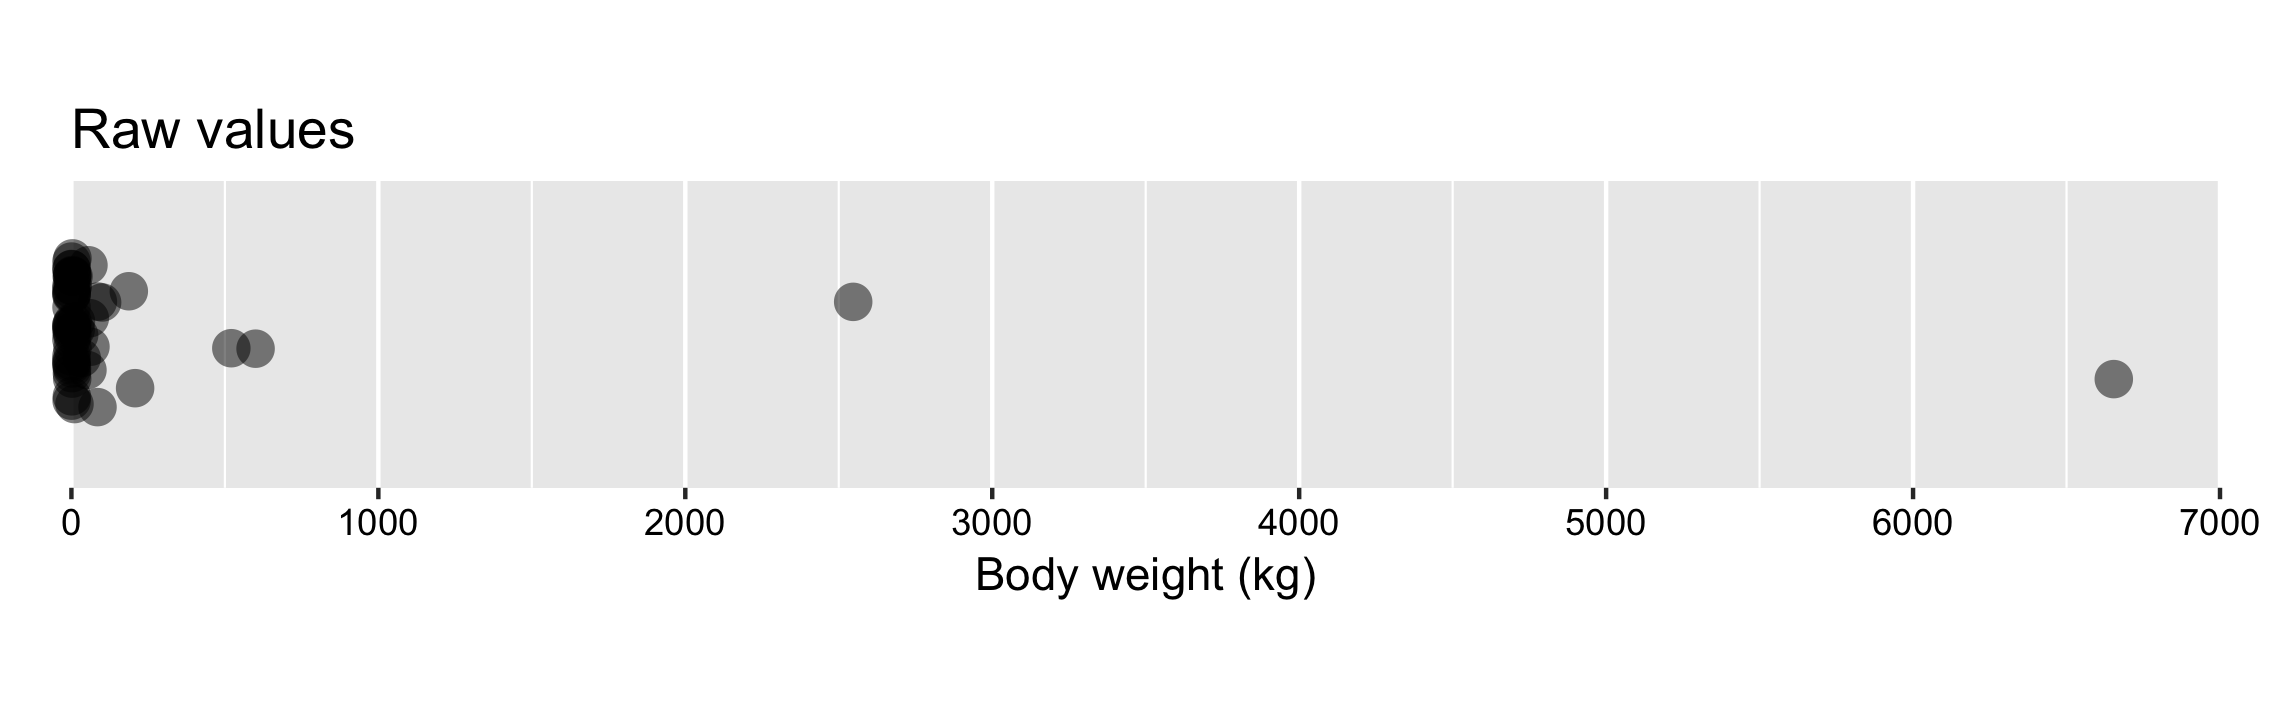
Plot the raw data
ggplot(msleep, aes(bodywt, y = 1)) +
  geom_jitter() +
  scale_x_continuous(limits = c(0, 7000),
                     breaks = seq(0, 7000, 1000))
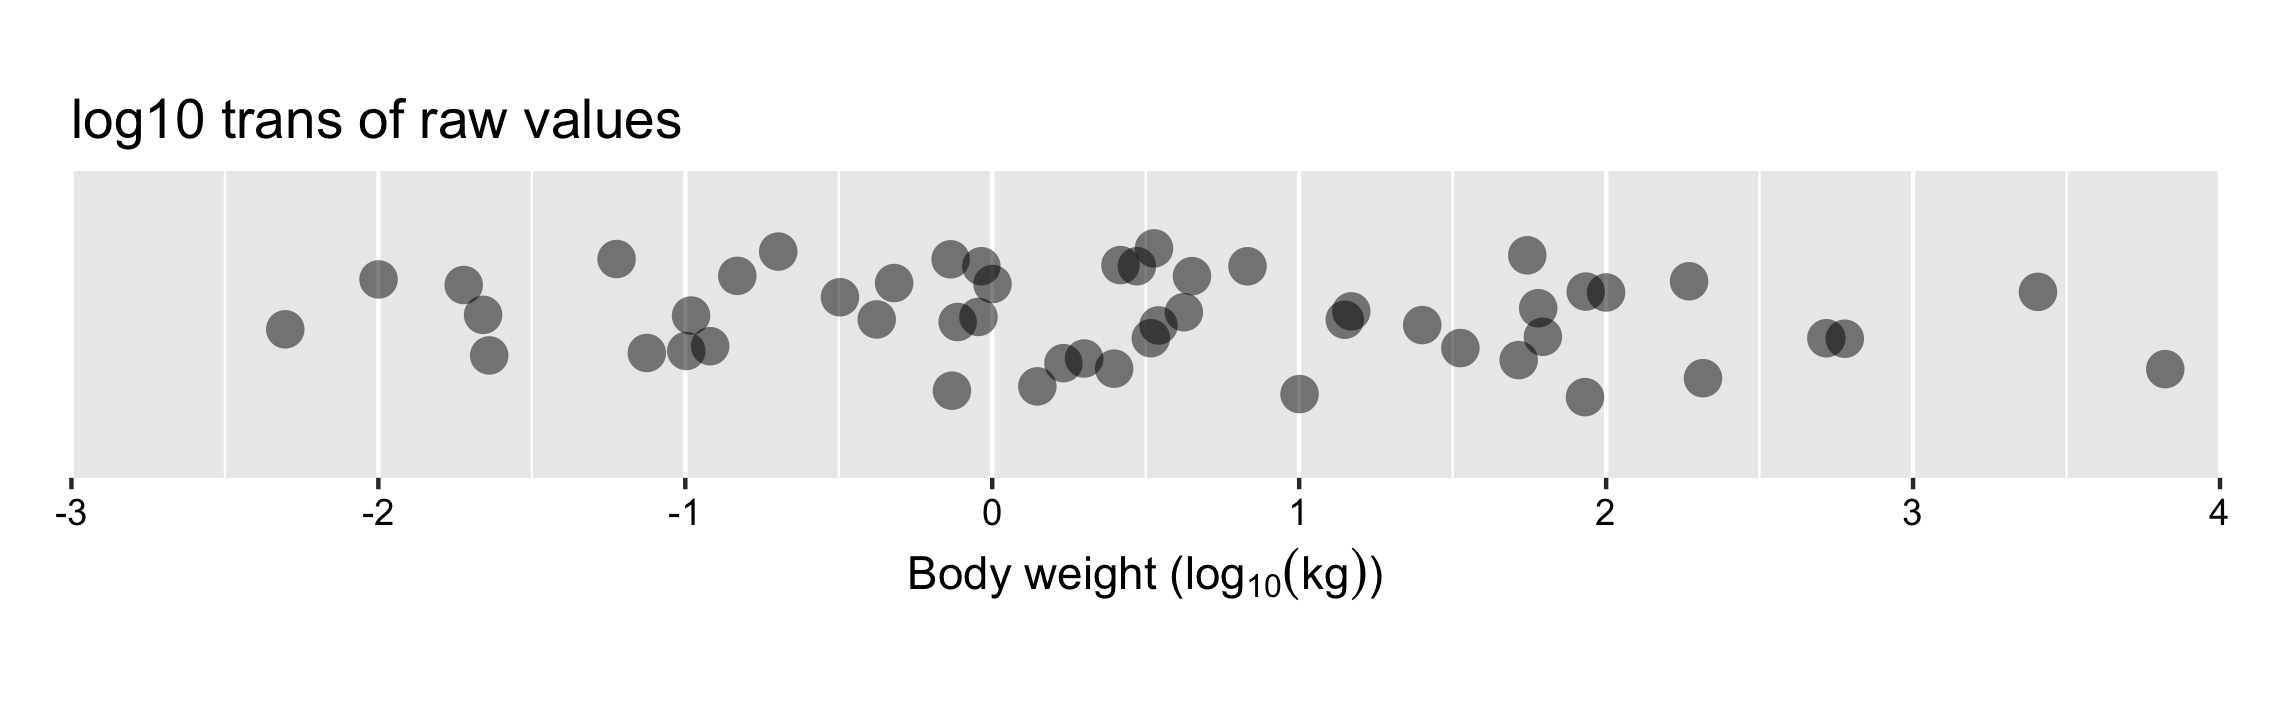
Transform the raw data
ggplot(msleep, aes(log10(bodywt), y = 1)) +
  geom_jitter() +
  scale_x_continuous(limits = c(-3, 4),
                     breaks = -3:4)
Add logtick annotation
ggplot(msleep, aes(log10(bodywt), y = 1)) +
  geom_jitter() +
  scale_x_continuous(limits = c(-3, 4),
                     breaks = -3:4) +
  annotation_logticks(sides = "b")
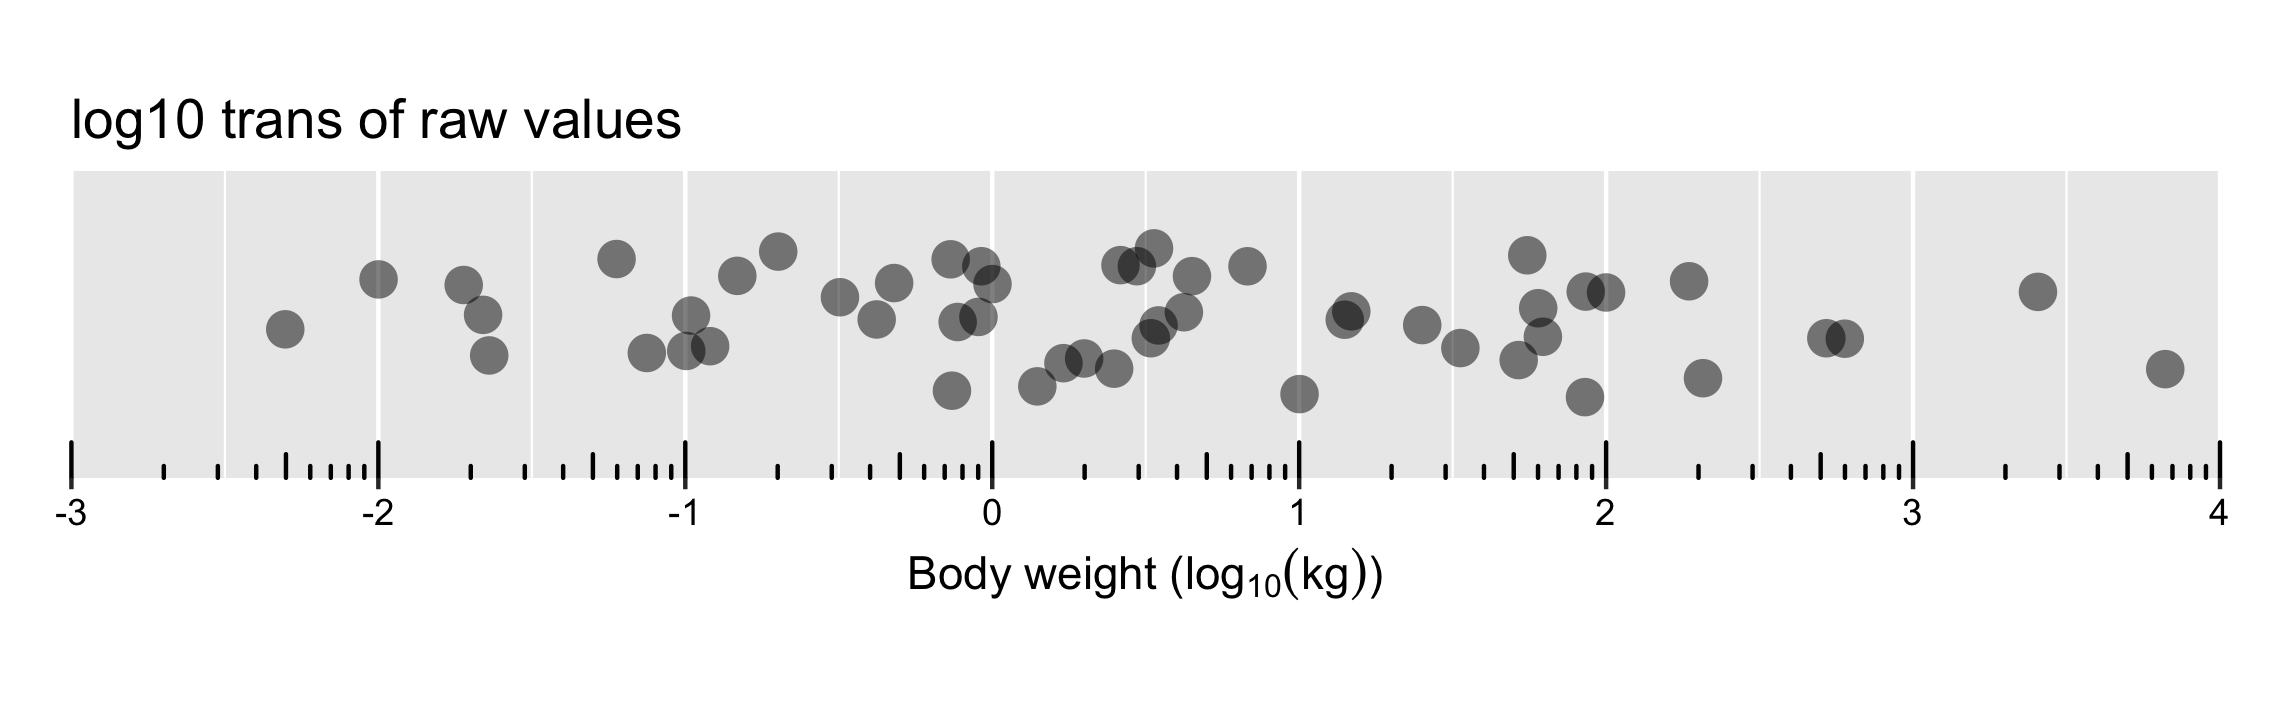
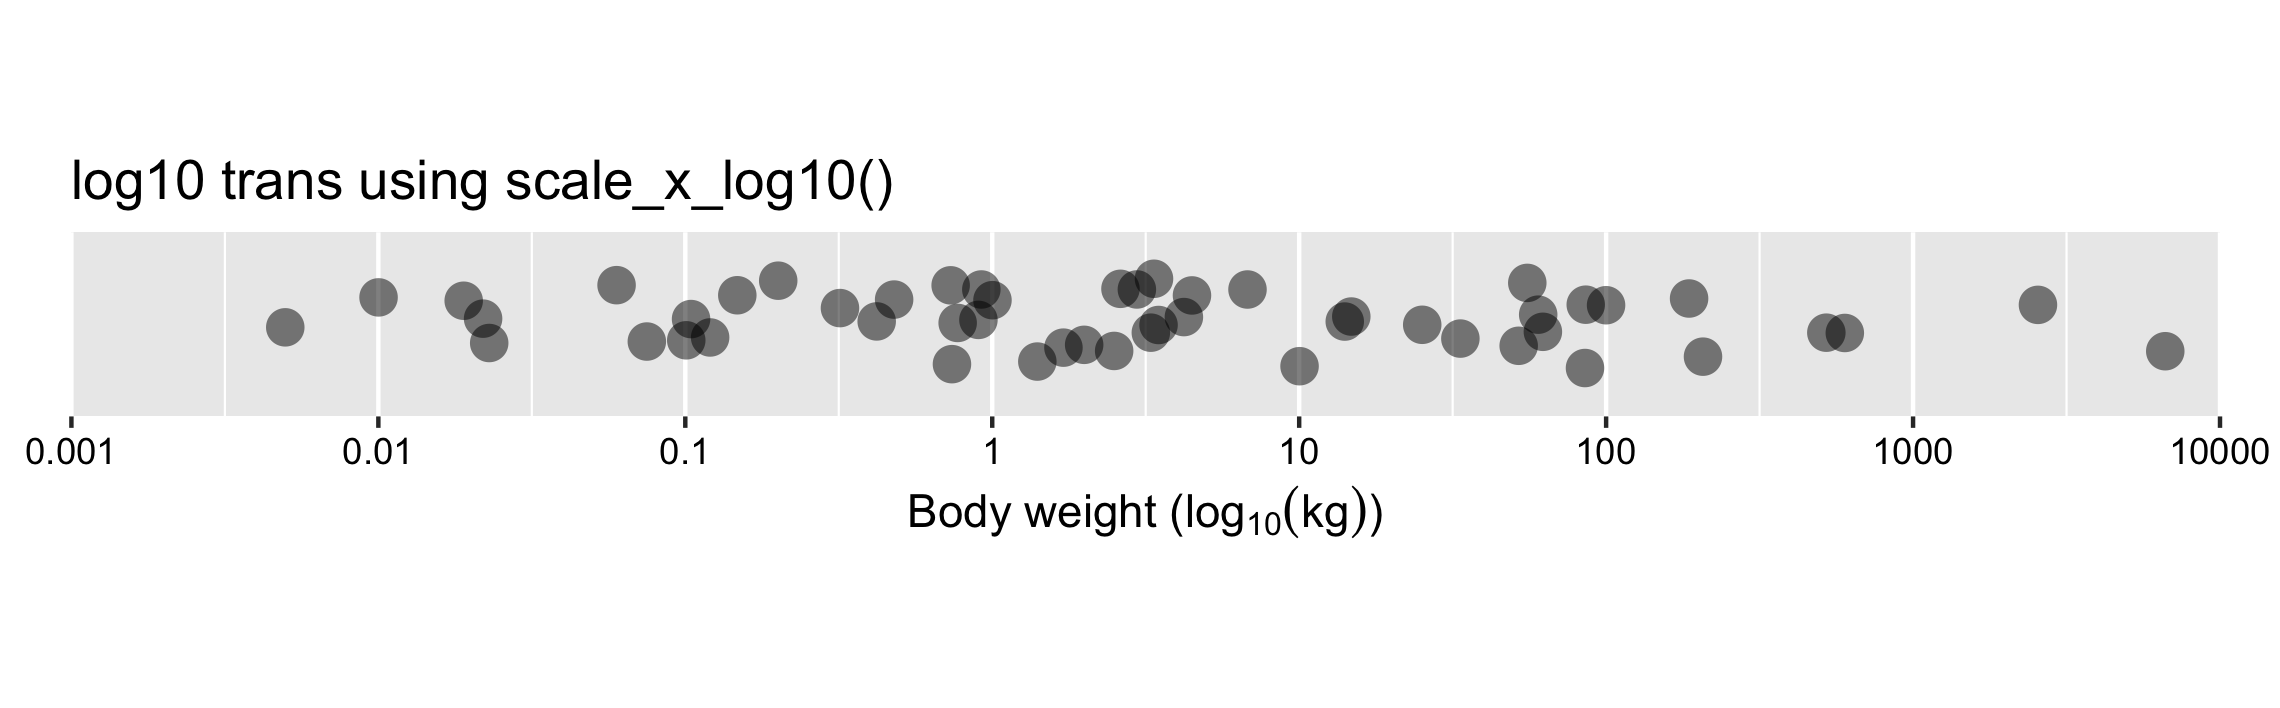
Use scale_*_log10()
ggplot(msleep, aes(bodywt, y = 1)) +
  geom_jitter() +
  scale_x_log10(limits = c(1e-03, 1e+04))
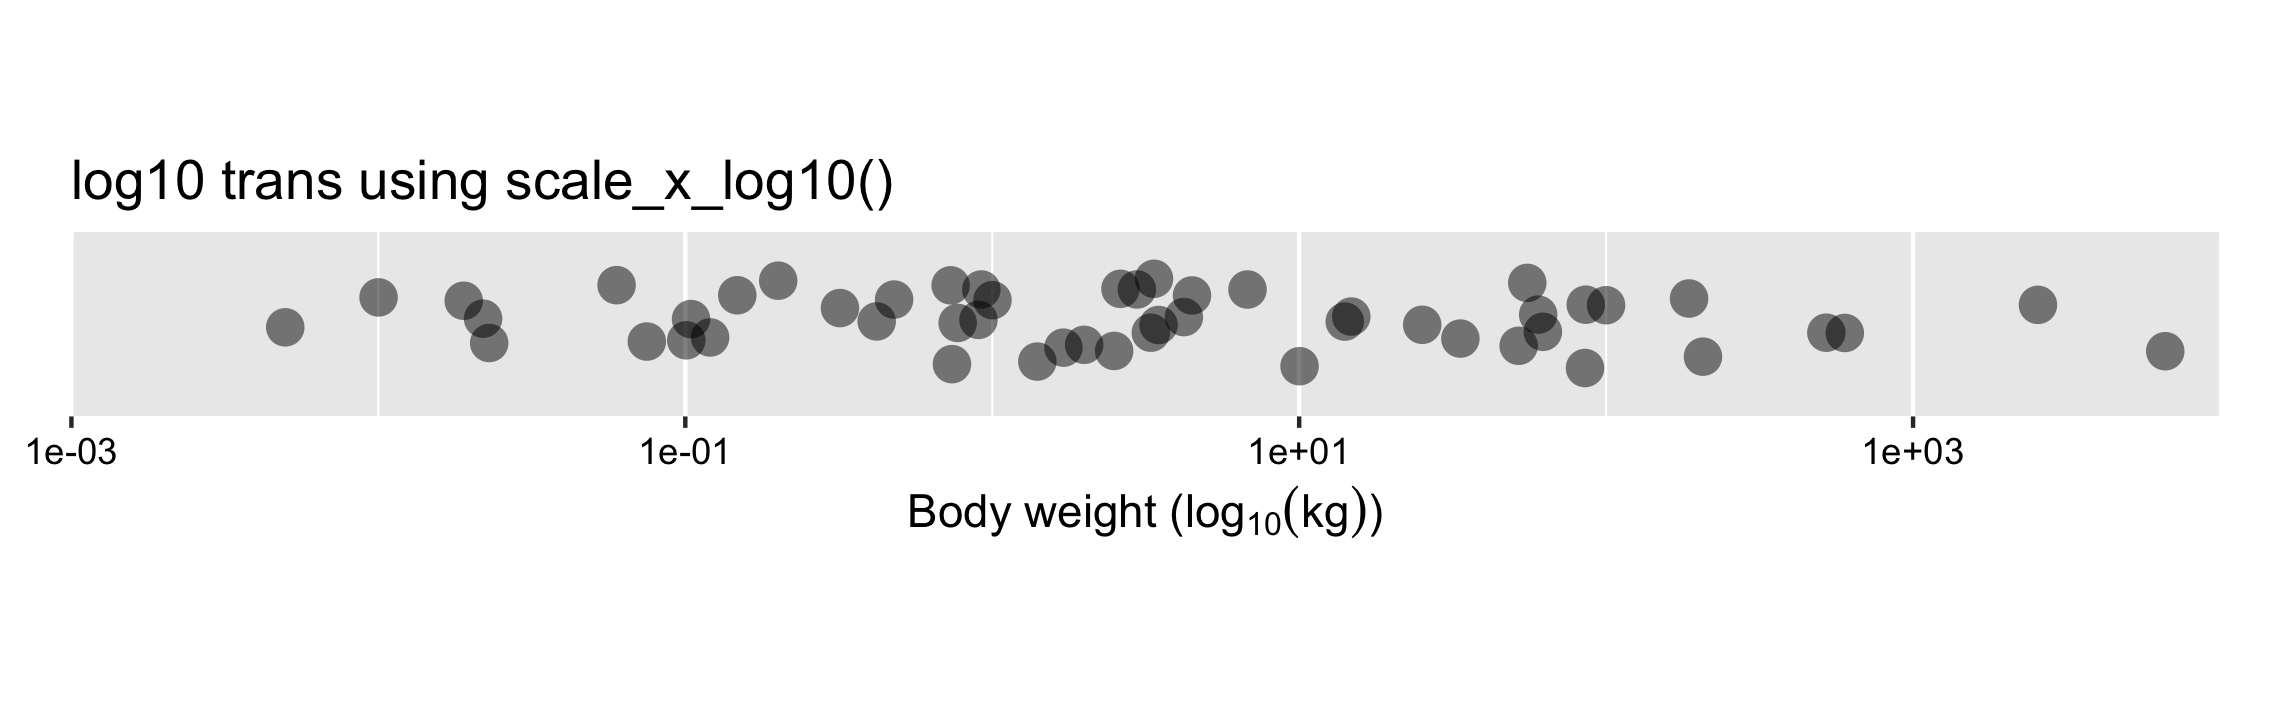
Compare direct transform and scale_*_log10() output
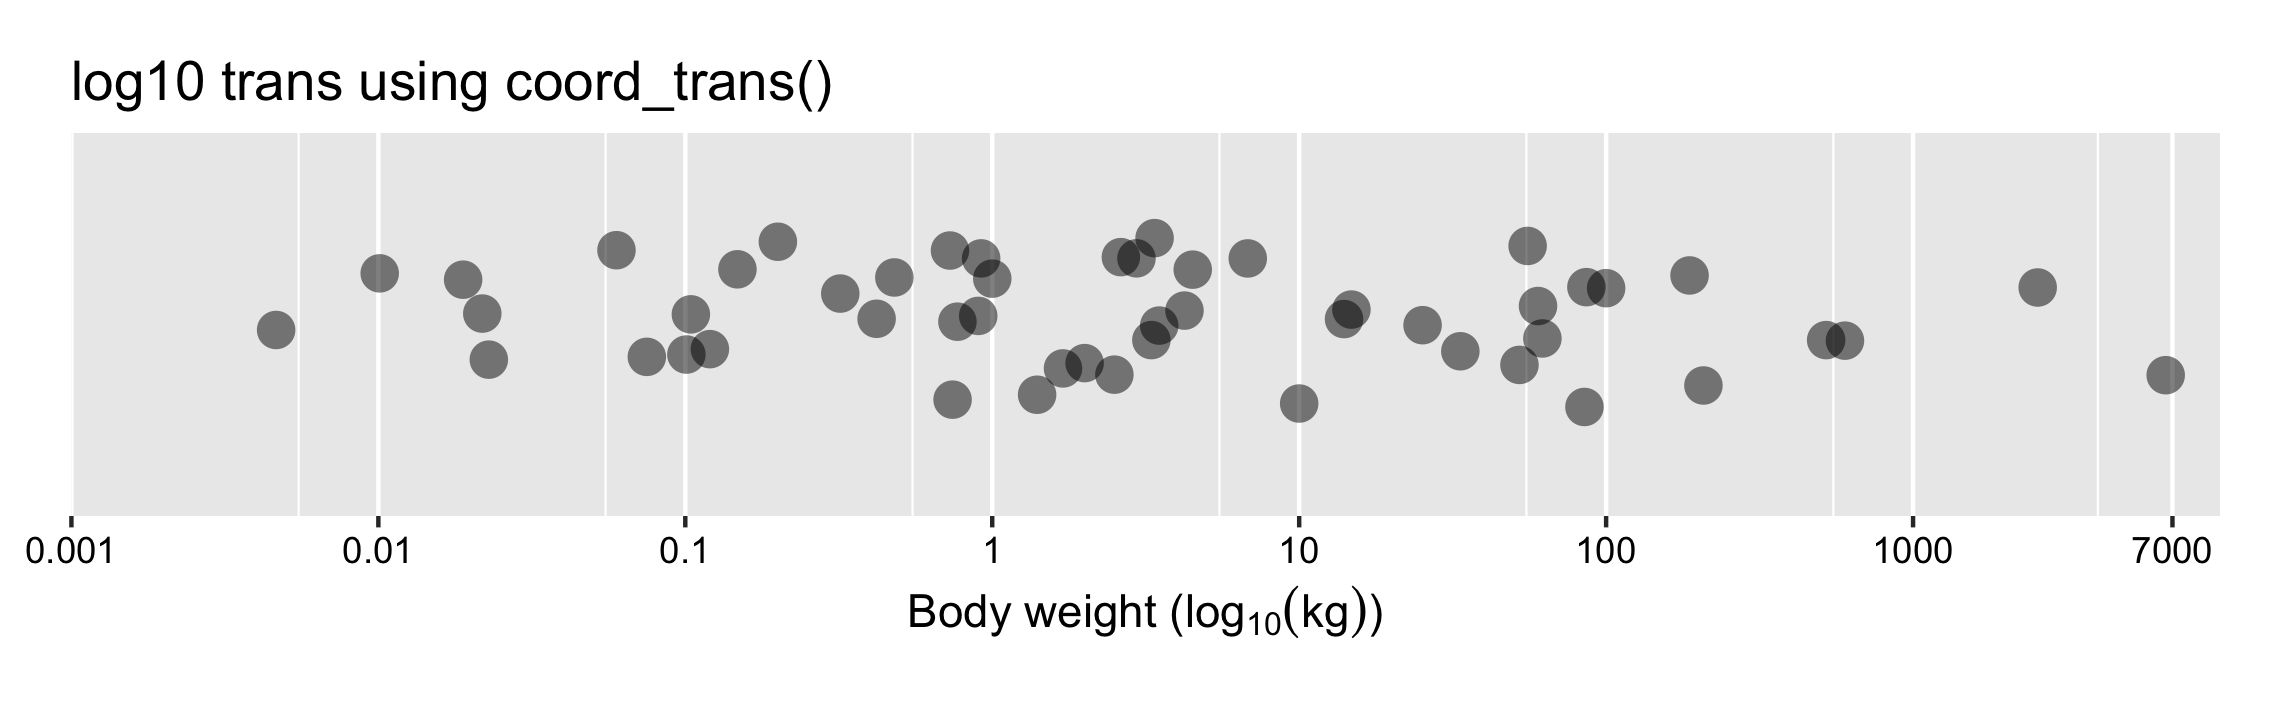
Use coord_trans()
ggplot(msleep, aes(bodywt, y = 1)) +
  geom_jitter() +
  coord_trans(x = "log10")
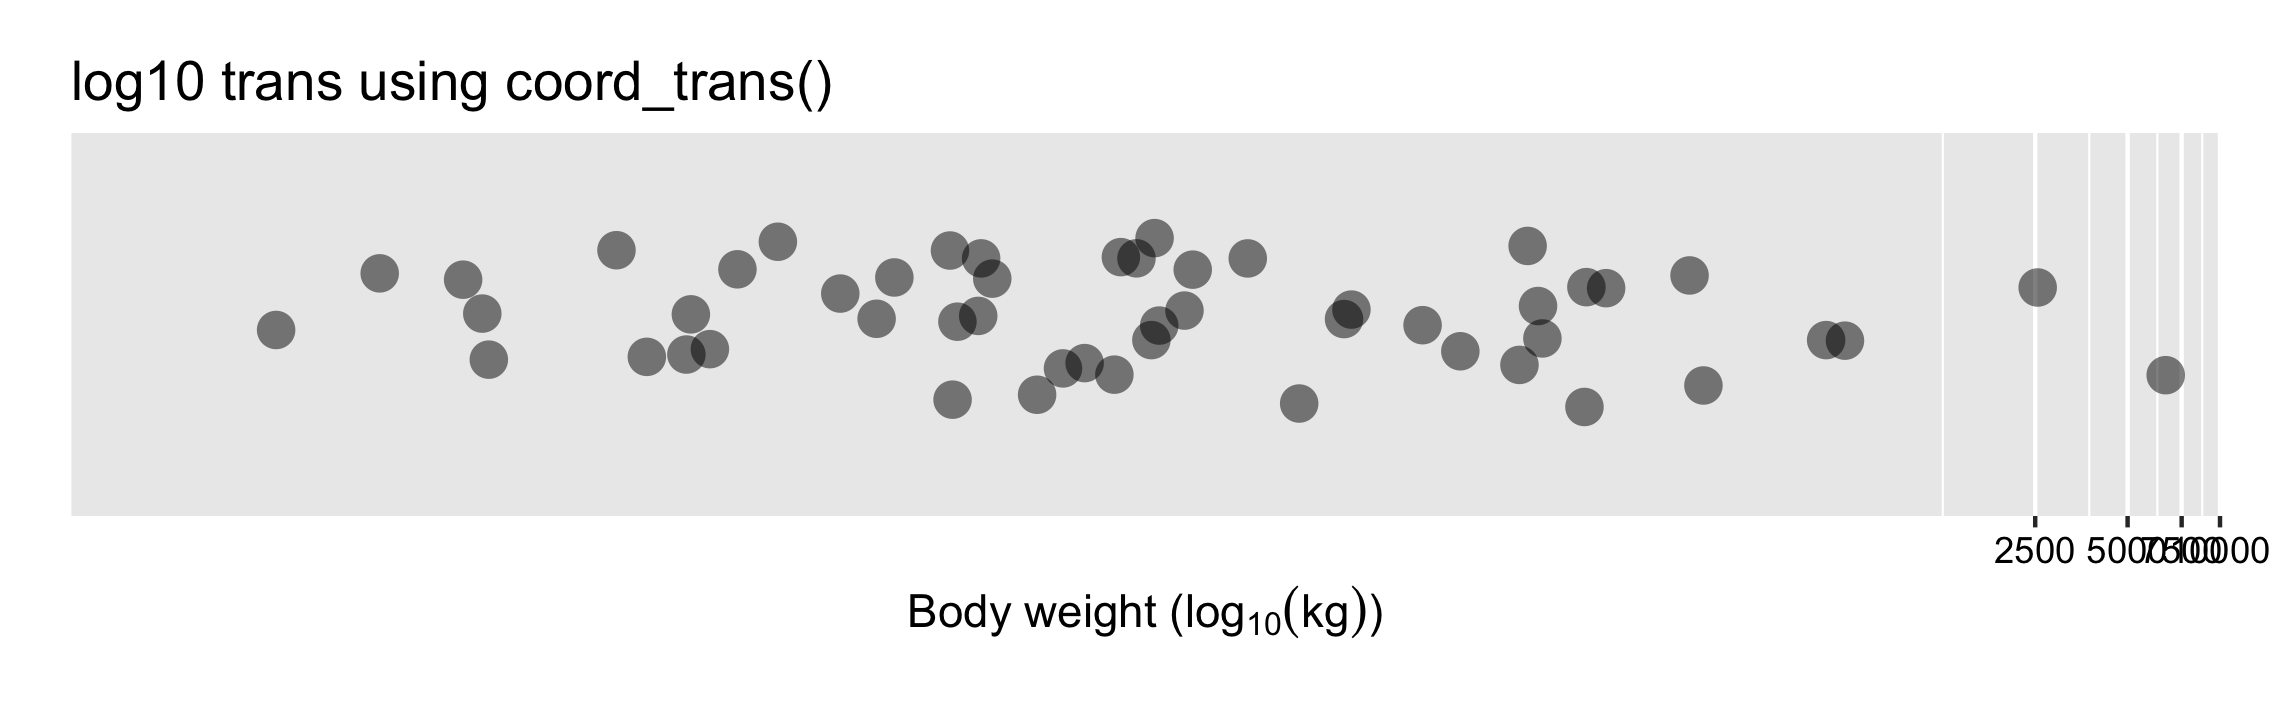
Compare scale_*_log10() and coord_trans() output
Adjusting labels