Mở rộng cửa sổ với pandas

Xử lý dữ liệu chuỗi thời gian trong Python

Stefan Jansen

Founder & Lead Data Scientist at Applied Artificial Intelligence

Expanding windows trong pandas

  • Từ rolling sang expanding
  • Tính chỉ số cho đến ngày hiện tại
  • Chuỗi thời gian mới phản ánh toàn bộ lịch sử
  • Hữu ích cho lãi suất tích lũy, min/max tích lũy
  • Hai cách với pandas:
    • .expanding() - giống .rolling()
    • .cumsum(), .cumprod(), cummin()/max()
Xử lý dữ liệu chuỗi thời gian trong Python

Ý tưởng cơ bản

df = pd.DataFrame({'data': range(5)})

df['expanding sum'] = df.data.expanding().sum()
df['cumulative sum'] = df.data.cumsum()
df
   data  expanding sum  cumulative sum
0     0            0.0               0
1     1            1.0               1
2     2            3.0               3
3     3            6.0               6
4     4           10.0              10
Xử lý dữ liệu chuỗi thời gian trong Python

Lấy dữ liệu cho S&P 500

data = pd.read_csv('sp500.csv', parse_dates=['date'], index_col='date')
DatetimeIndex: 2519 entries, 2007-05-24 to 2017-05-24
Data columns (total 1 columns):
SP500    2519 non-null float64
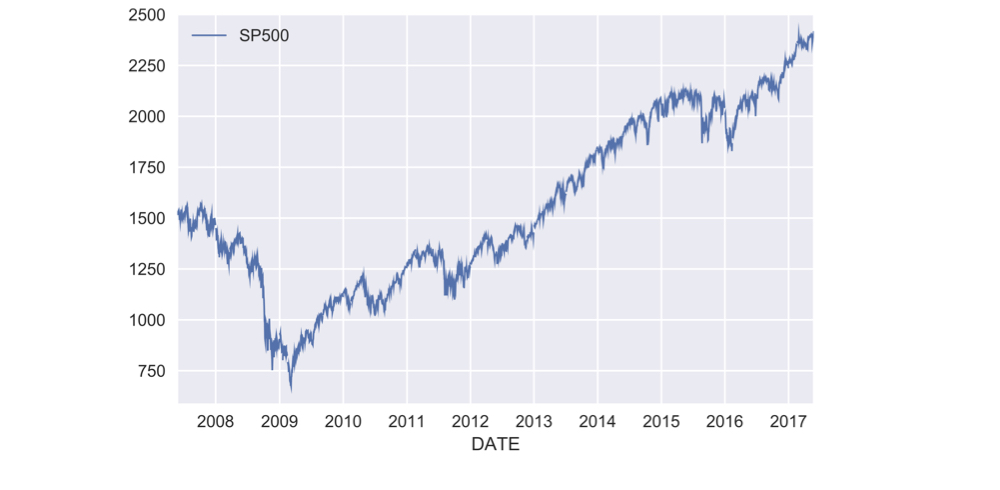
ch3_2_v2 - Expanding Window Functions with Pandas.013.png

Xử lý dữ liệu chuỗi thời gian trong Python

Cách tính lợi suất tích lũy

  • Lợi suất một kỳ $r_t$: giá hiện tại chia giá kỳ trước trừ 1:

    $$r_t = \frac{P_t}{P_{t-1}} - 1$$

    • Lợi suất nhiều kỳ: tích của $(1 + r_t)$ cho mọi kỳ, trừ 1:

    $$R_T = (1 + r_1)(1 + r_2)...(1 + r_T) - 1$$

    • Lợi suất kỳ: .pct_change()
    • Toán cơ bản .add(), .sub(), .mul(), .div()
    • Tích lũy: .cumprod()
Xử lý dữ liệu chuỗi thời gian trong Python

Thực hành tính lợi suất tích lũy

pr = data.SP500.pct_change() # period return

pr_plus_one = pr.add(1)
cumulative_return = pr_plus_one.cumprod().sub(1)
cumulative_return.mul(100).plot()

ch3_2_v2 - Expanding Window Functions with Pandas.021.png

Xử lý dữ liệu chuỗi thời gian trong Python

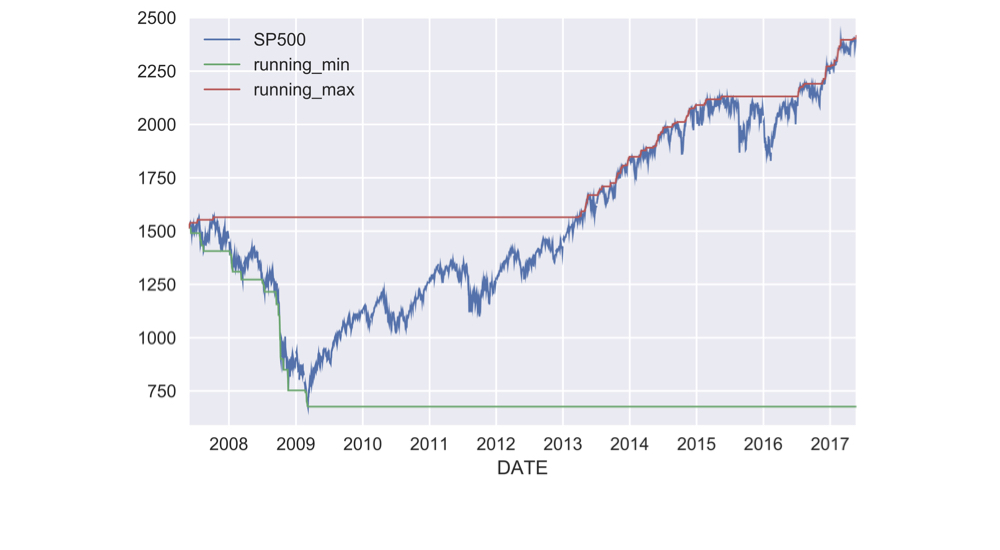
Min & max tích lũy

data['running_min'] = data.SP500.expanding().min()

data['running_max'] = data.SP500.expanding().max()
data.plot()

ch3_2_v2 - Expanding Window Functions with Pandas.023.png

Xử lý dữ liệu chuỗi thời gian trong Python

Lợi suất cuộn theo năm

def multi_period_return(period_returns):
    return np.prod(period_returns + 1) - 1

pr = data.SP500.pct_change() # period return
r = pr.rolling('360D').apply(multi_period_return)
data['Rolling 1yr Return'] = r.mul(100)
data.plot(subplots=True)
Xử lý dữ liệu chuỗi thời gian trong Python

Lợi suất cuộn theo năm

data['Rolling 1yr Return'] = r.mul(100)

data.plot(subplots=True)

ch3_2_v2 - Expanding Window Functions with Pandas.027.png

Xử lý dữ liệu chuỗi thời gian trong Python

Cùng luyện tập nào!

Xử lý dữ liệu chuỗi thời gian trong Python

Preparing Video For Download...