Tương quan chỉ số & xuất sang Excel

Xử lý dữ liệu chuỗi thời gian trong Python

Stefan Jansen

Founder & Lead Data Scientist at Applied Artificial Intelligence

Phân tích bổ sung cho chỉ số của bạn

  • Tương quan lợi nhuận ngày:

  • Tính cho tất cả thành phần

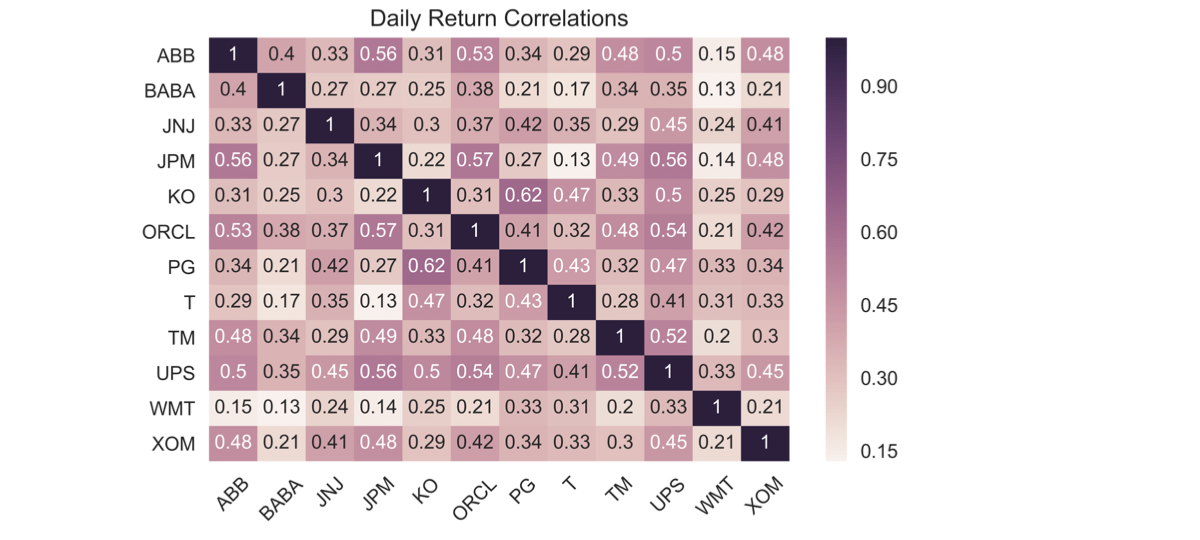
  • Trực quan hóa bằng heatmap

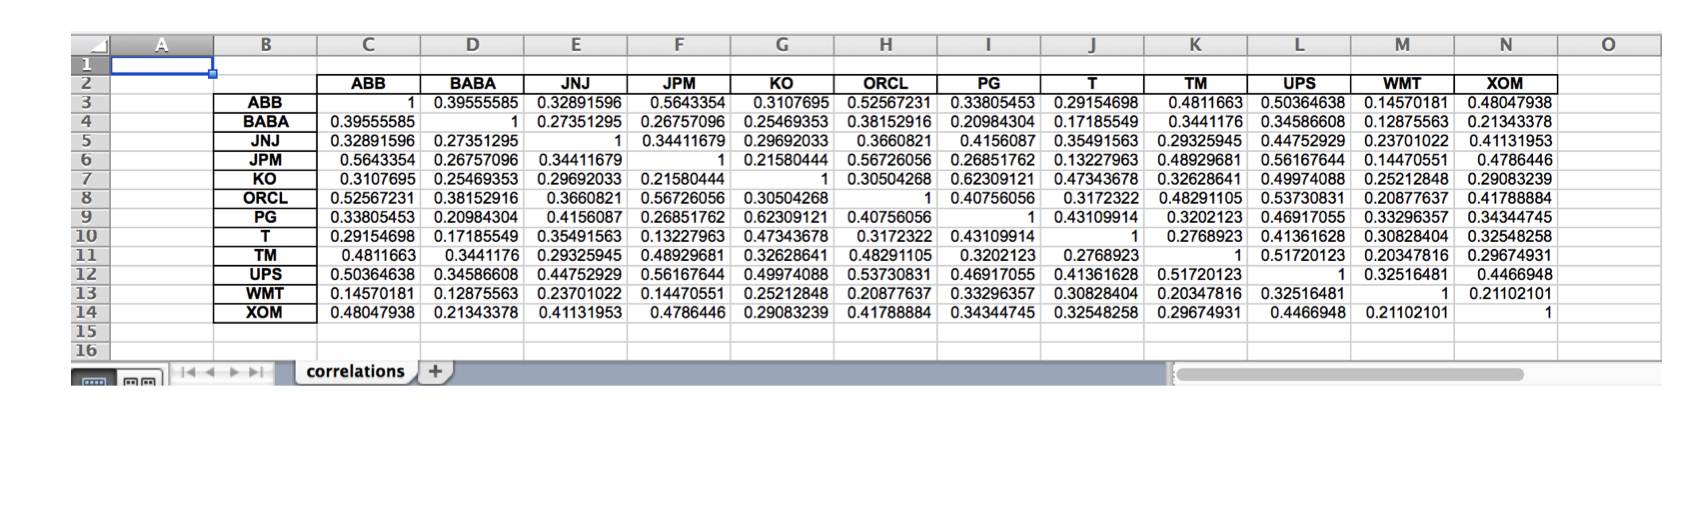
  • Ghi kết quả ra excel với định dạng .xls.xlsx:

  • Một worksheet

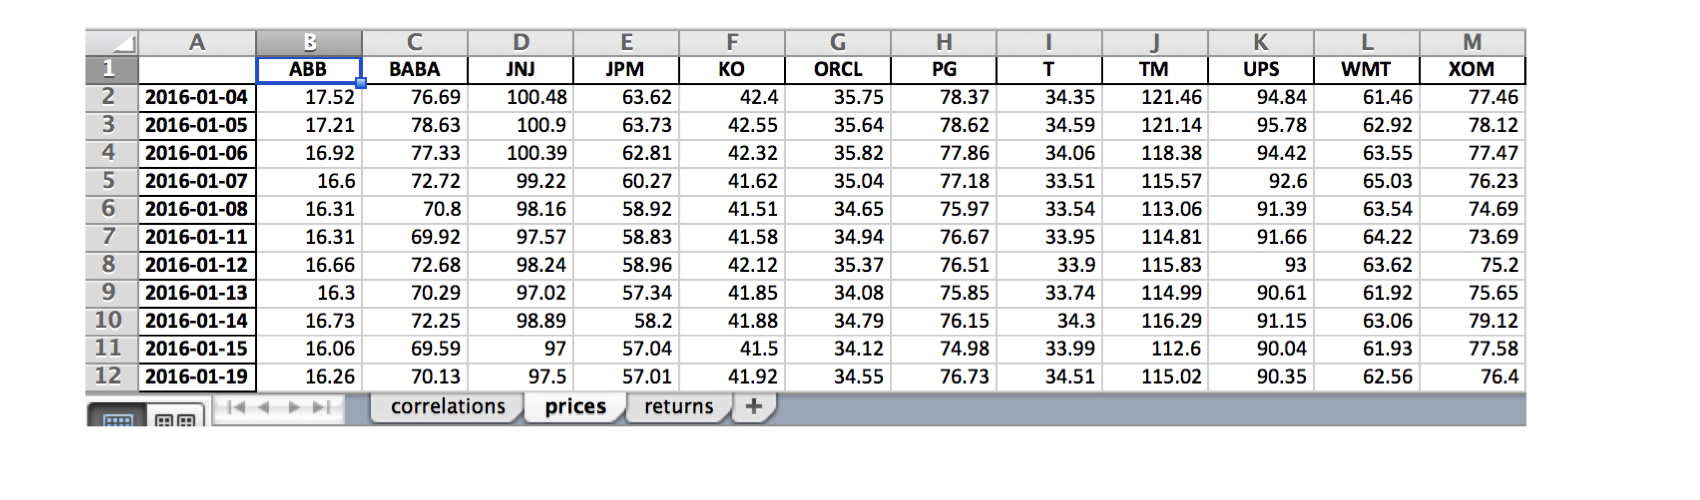
  • Nhiều worksheet

Xử lý dữ liệu chuỗi thời gian trong Python

Thành phần chỉ số - dữ liệu giá

data = DataReader(tickers, 'google', start='2016', end='2017')['Close']

data.info()
DatetimeIndex: 252 entries, 2016-01-04 to 2016-12-30
Data columns (total 12 columns):
ABB     252 non-null float64
BABA    252 non-null float64
JNJ     252 non-null float64
JPM     252 non-null float64
KO      252 non-null float64
ORCL    252 non-null float64
PG      252 non-null float64
T       252 non-null float64
TM      252 non-null float64
UPS     252 non-null float64
WMT     252 non-null float64
XOM     252 non-null float64
Xử lý dữ liệu chuỗi thời gian trong Python

Thành phần chỉ số: tương quan lợi nhuận

daily_returns = data.pct_change()

correlations = daily_returns.corr()
ABB  BABA  JNJ  JPM   KO  ORCL   PG    T   TM  UPS  WMT  XOM
ABB  1.00  0.40 0.33 0.56 0.31  0.53 0.34 0.29 0.48 0.50 0.15 0.48
BABA 0.40  1.00 0.27 0.27 0.25  0.38 0.21 0.17 0.34 0.35 0.13 0.21
JNJ  0.33  0.27 1.00 0.34 0.30  0.37 0.42 0.35 0.29 0.45 0.24 0.41
JPM  0.56  0.27 0.34 1.00 0.22  0.57 0.27 0.13 0.49 0.56 0.14 0.48
KO   0.31  0.25 0.30 0.22 1.00  0.31 0.62 0.47 0.33 0.50 0.25 0.29
ORCL 0.53  0.38 0.37 0.57 0.31  1.00 0.41 0.32 0.48 0.54 0.21 0.42
PG   0.34  0.21 0.42 0.27 0.62  0.41 1.00 0.43 0.32 0.47 0.33 0.34
T    0.29  0.17 0.35 0.13 0.47  0.32 0.43 1.00 0.28 0.41 0.31 0.33
TM   0.48  0.34 0.29 0.49 0.33  0.48 0.32 0.28 1.00 0.52 0.20 0.30
UPS  0.50  0.35 0.45 0.56 0.50  0.54 0.47 0.41 0.52 1.00 0.33 0.45
WMT  0.15  0.13 0.24 0.14 0.25  0.21 0.33 0.31 0.20 0.33 1.00 0.21
XOM  0.48  0.21 0.41 0.48 0.29  0.42 0.34 0.33 0.30 0.45 0.21 1.00
Xử lý dữ liệu chuỗi thời gian trong Python

Thành phần chỉ số: tương quan lợi nhuận

sns.heatmap(correlations, annot=True)
plt.xticks(rotation=45)
plt.title('Daily Return Correlations')
ch4_4_v2 - Index Correlation & Saving Results to Excel.010.png

Xử lý dữ liệu chuỗi thời gian trong Python

Lưu vào một worksheet Excel

correlations.to_excel(excel_writer= 'correlations.xls',
                      sheet_name='correlations',
                      startrow=1,
                      startcol=1)
ch4_4_v2 - Index Correlation & Saving Results to Excel.012.png

Xử lý dữ liệu chuỗi thời gian trong Python

Lưu vào nhiều worksheet Excel

data.index = data.index.date # Chỉ giữ phần ngày

with pd.ExcelWriter('stock_data.xlsx') as writer:
corr.to_excel(excel_writer=writer, sheet_name='correlations')
data.to_excel(excel_writer=writer, sheet_name='prices')
data.pct_change().to_excel(writer, sheet_name='returns')
ch4_4_v2 - Index Correlation & Saving Results to Excel.015.png

Xử lý dữ liệu chuỗi thời gian trong Python

Cùng luyện tập nào!

Xử lý dữ liệu chuỗi thời gian trong Python

Preparing Video For Download...