Xử lý dữ liệu chuỗi thời gian trong Python
Stefan Jansen
Founder & Lead Data Scientist at Applied Artificial Intelligence
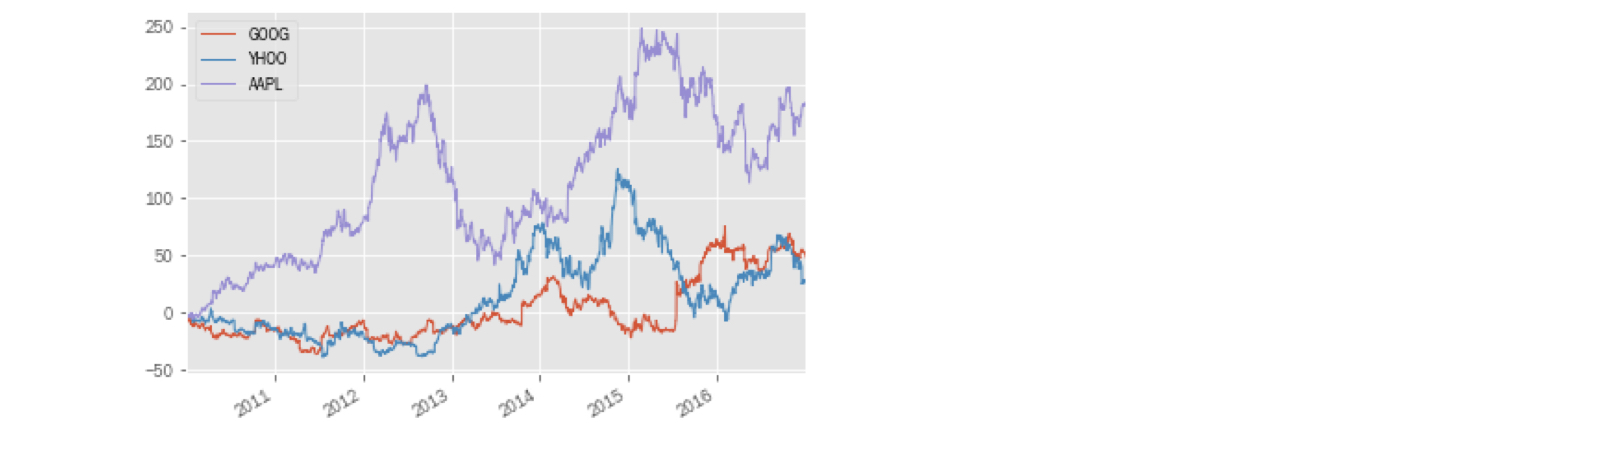
Chuỗi giá cổ phiếu: khó so sánh khi mức giá khác nhau
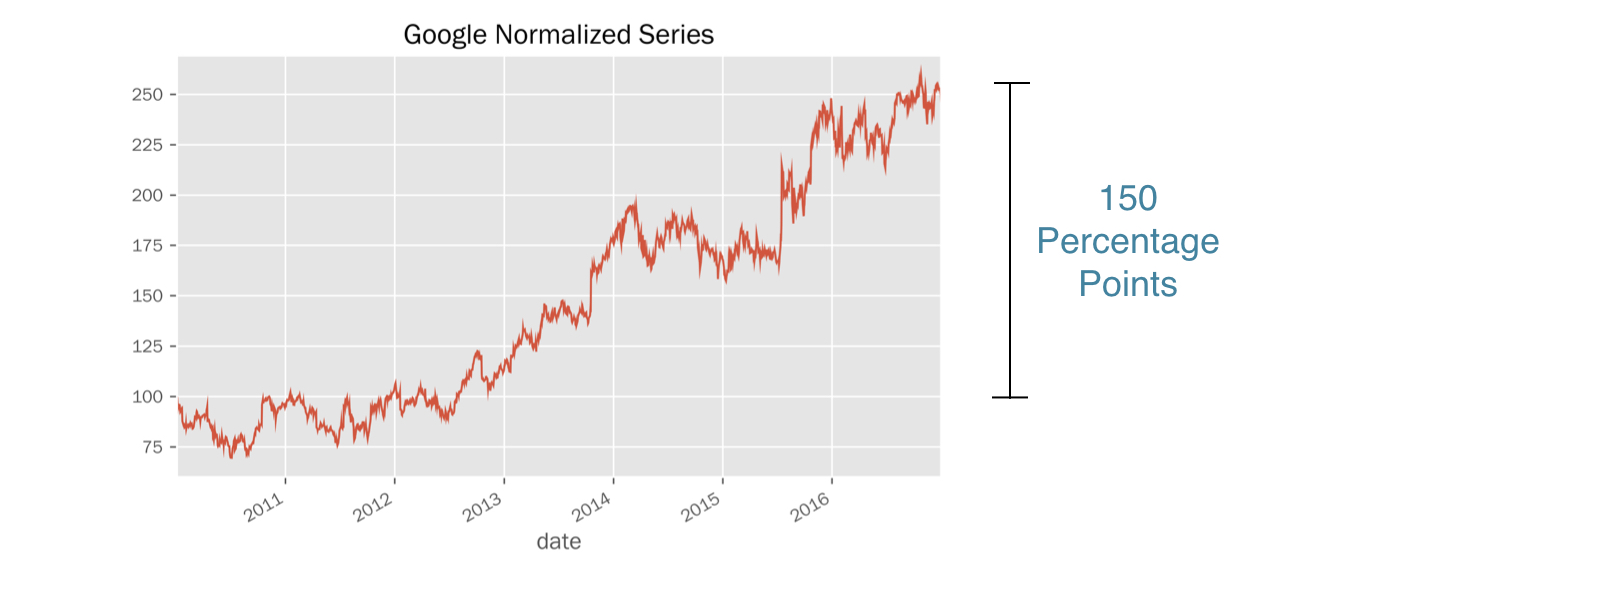
Cách đơn giản: chuẩn hóa chuỗi giá bắt đầu từ 100
Chia mọi giá cho giá đầu tiên, rồi nhân 100
Cùng điểm xuất phát
Mọi giá là tương đối so với điểm đầu
Chênh lệch so với điểm đầu tính theo điểm phần trăm
google = pd.read_csv('google.csv', parse_dates=['date'], index_col='date')google.head(3)
price
date
2010-01-04 313.06
2010-01-05 311.68
2010-01-06 303.83
first_price = google.price.iloc[0] # int-based selectionfirst_price
313.06
first_price == google.loc['2010-01-04', 'price']
True
normalized = google.price.div(first_price).mul(100)normalized.plot(title='Google Normalized Series')
prices = pd.read_csv('stock_prices.csv', parse_dates=['date'], index_col='date')prices.info()
DatetimeIndex: 1761 entries, 2010-01-04 to 2016-12-30
Data columns (total 3 columns):
AAPL 1761 non-null float64
GOOG 1761 non-null float64
YHOO 1761 non-null float64
dtypes: float64(3)
prices.head(2)
AAPL GOOG YHOO
Date
2010-01-04 30.57 313.06 17.10
2010-01-05 30.63 311.68 17.23
prices.iloc[0]
AAPL 30.57
GOOG 313.06
YHOO 17.10
Name: 2010-01-04 00:00:00, dtype: float64
normalized = prices.div(prices.iloc[0])normalized.head(3)
AAPL GOOG YHOO
Date
2010-01-04 1.000000 1.000000 1.000000
2010-01-05 1.001963 0.995592 1.007602
2010-01-06 0.985934 0.970517 1.004094
.div(): tự căn chỉnh chỉ mục Series và cột DataFrameindex = pd.read_csv('benchmark.csv', parse_dates=['date'], index_col='date')index.info()
DatetimeIndex: 1826 entries, 2010-01-01 to 2016-12-30
Data columns (total 1 columns):
SP500 1762 non-null float64
dtypes: float64(1)
prices = pd.concat([prices, index], axis=1).dropna()prices.info()
DatetimeIndex: 1761 entries, 2010-01-04 to 2016-12-30
Data columns (total 4 columns):
AAPL 1761 non-null float64
GOOG 1761 non-null float64
YHOO 1761 non-null float64
SP500 1761 non-null float64
dtypes: float64(4)
prices.head(1)
AAPL GOOG YHOO SP500
2010-01-04 30.57 313.06 17.10 1132.99
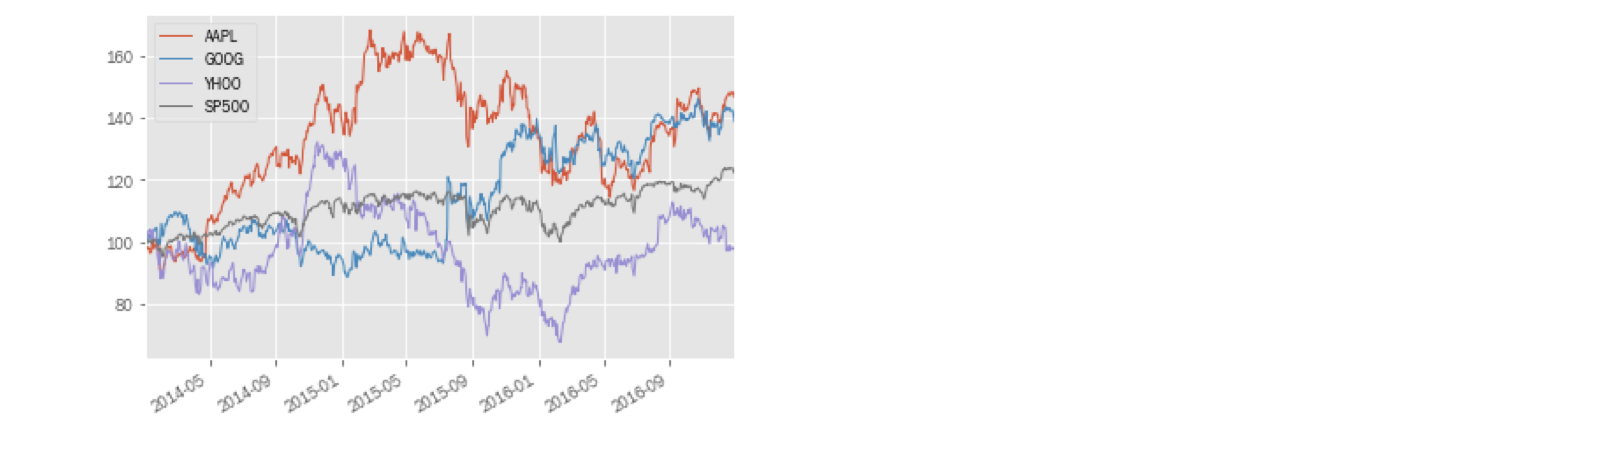
normalized = prices.div(prices.iloc[0]).mul(100)normalized.plot()
diff = normalized[tickers].sub(normalized['SP500'], axis=0)
GOOG YHOO AAPL
2010-01-04 0.000000 0.000000 0.000000
2010-01-05 -0.752375 0.448669 -0.115294
2010-01-06 -3.314604 0.043069 -1.772895
.sub(..., axis=0): Trừ một Series khỏi từng cột DataFrame bằng cách căn chỉnh chỉ mụcdiff.plot()

Xử lý dữ liệu chuỗi thời gian trong Python