Gleitende und kumulative Aggregationen

Daten­transformation mit Polars

Liam Brannigan

Data Scientist & Polars Contributor

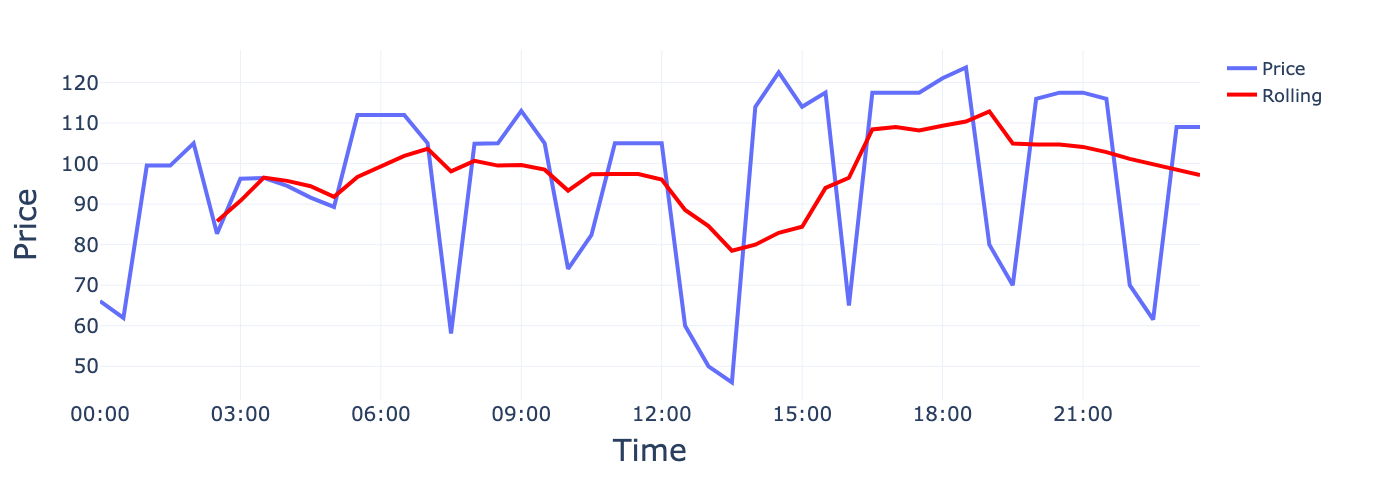
Warum gleitende Statistiken?
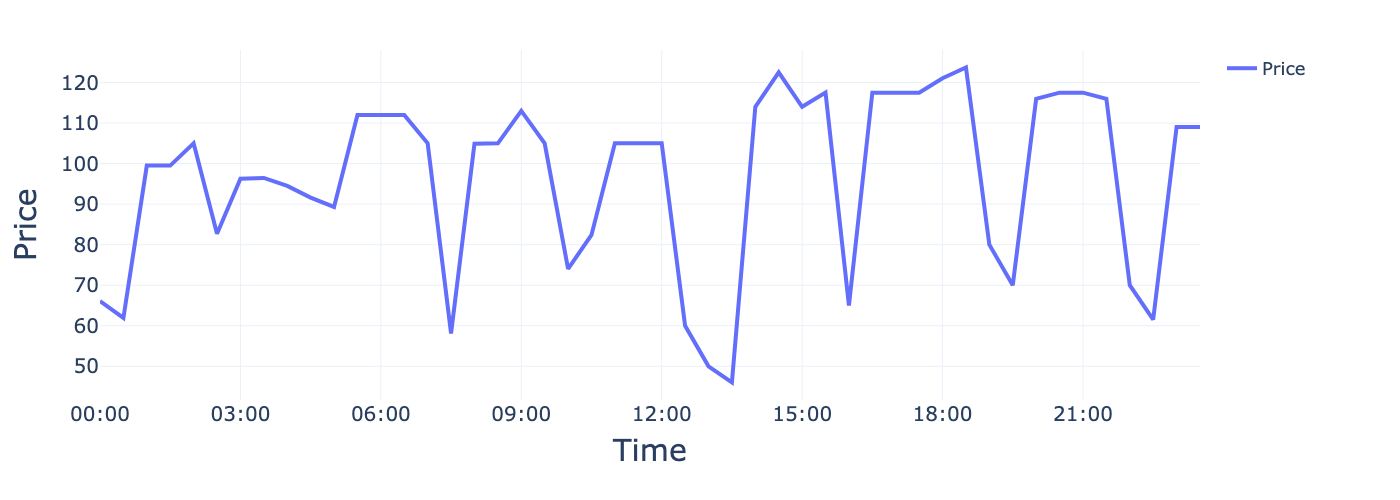
Liniendiagramm der Strompreise

Daten­transformation mit Polars

Warum gleitende Statistiken?

Liniendiagramm der Strompreise mit gleitenden Statistiken

Daten­transformation mit Polars

Gleitender Mittelwert für eine Spalte

prices.with_columns(

)
Daten­transformation mit Polars

Gleitender Mittelwert für eine Spalte

prices.with_columns(
    pl.col("price").rolling_mean(            )
)
Daten­transformation mit Polars

Gleitender Mittelwert für eine Spalte

prices.with_columns(
    pl.col("price").rolling_mean(window_size=3)
)
Daten­transformation mit Polars

Gleitender Mittelwert für eine Spalte

prices.with_columns(
    pl.col("price").rolling_mean(window_size=3).alias("smoothed")
)
Daten­transformation mit Polars

Gleitender Mittelwert für eine Spalte

prices.with_columns(
    pl.col("price").rolling_mean(window_size=3).alias("smoothed")
)
| time                | price | solar | smoothed |
| ---                 | ---   | ---   | ---      |
| datetime[µs]        | f64   | f64   | f64      |
|---------------------|-------|-------|----------|
| 2025-07-05 00:00:00 | 34.2  | 0.0   | null     |
| 2025-07-05 01:00:00 | 28.7  | 0.0   | null     |

Daten­transformation mit Polars

Gleitender Mittelwert für eine Spalte

prices.with_columns(
    pl.col("price").rolling_mean(window_size=3).alias("smoothed")
)
| time                | price | solar | smoothed |
| ---                 | ---   | ---   | ---      |
| datetime[µs]        | f64   | f64   | f64      |
|---------------------|-------|-------|----------|
| 2025-07-05 00:00:00 | 34.2  | 0.0   | null     |
| 2025-07-05 01:00:00 | 28.7  | 0.0   | null     |
| 2025-07-05 02:00:00 | 27.5  | 0.0   | 30.1     |
Daten­transformation mit Polars

Fenster zentrieren

prices.with_columns(
    pl.col("price").rolling_mean(window_size=3,            )
)
Daten­transformation mit Polars

Fenster zentrieren

prices.with_columns(
    pl.col("price").rolling_mean(window_size=3, center=True).alias("centered")
)
| time                | price | solar | centered |
| ---                 | ---   | ---   | ---      |
| datetime[µs]        | f64   | f64   | f64      |
|---------------------|-------|-------|----------|
| 2025-07-05 00:00:00 | 34.2  | 0.0   | null     |
| 2025-07-05 01:00:00 | 28.7  | 0.0   | 30.1     |
| 2025-07-05 02:00:00 | 27.5  | 0.0   | 27.1     |
Daten­transformation mit Polars

Weitere gleitende Ausdrücke

  • .rolling_sum() – gleitende Summe
  • .rolling_std() – gleitende Standardabweichung
  • .rolling_max() / .rolling_min()
Daten­transformation mit Polars

Rolling auf einem DataFrame

prices.rolling(                                )


Daten­transformation mit Polars

Rolling auf einem DataFrame

prices.rolling(index_column="time",            )


Daten­transformation mit Polars

Rolling auf einem DataFrame

prices.rolling(index_column="time", period="3h")


Daten­transformation mit Polars

Rolling auf einem DataFrame

prices.rolling(index_column="time", period="3h").agg(
    pl.all().mean()
)
Daten­transformation mit Polars

Rolling auf einem DataFrame

prices.rolling(index_column="time", period="3h").agg(
    pl.all().mean()
)
| time                | price | solar  |
| ---                 | ---   | ---    |
| datetime[µs]        | f64   | f64    |
|---------------------|-------|------- |
| 2025-07-05 10:00:00 | 1.8   | 247.3  |
| 2025-07-05 11:00:00 | 1.4   | 347.7  |
| 2025-07-05 12:00:00 | 0.9   | 420.7  |
Daten­transformation mit Polars

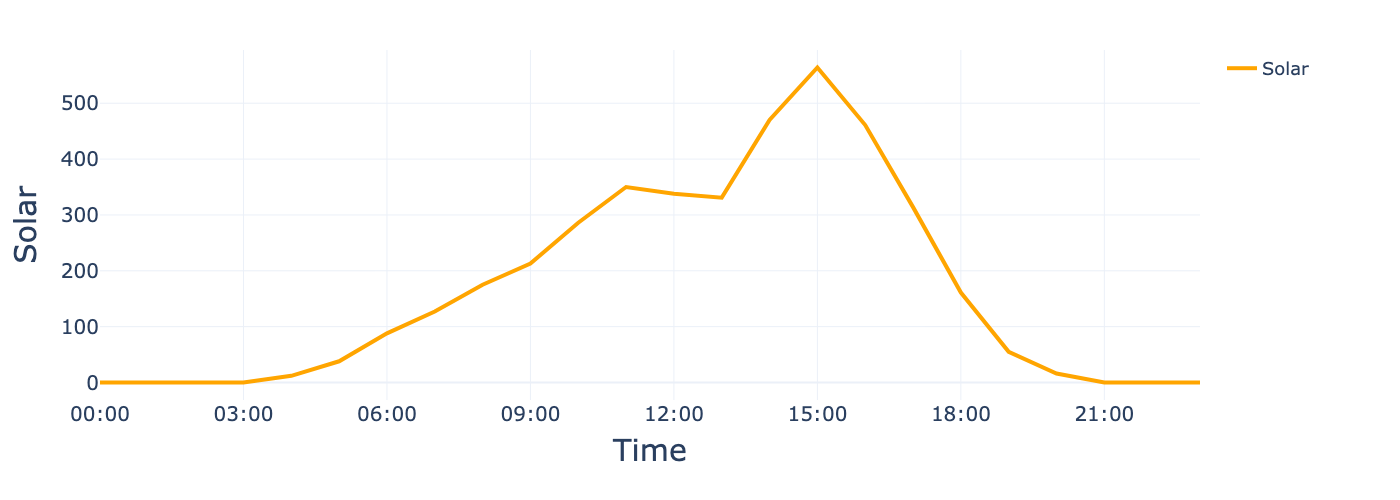
Warum kumulative Statistiken?

Zeitreihendiagramm der Solarleistung

  • Aufgabe: kumulative Werte berechnen
Daten­transformation mit Polars

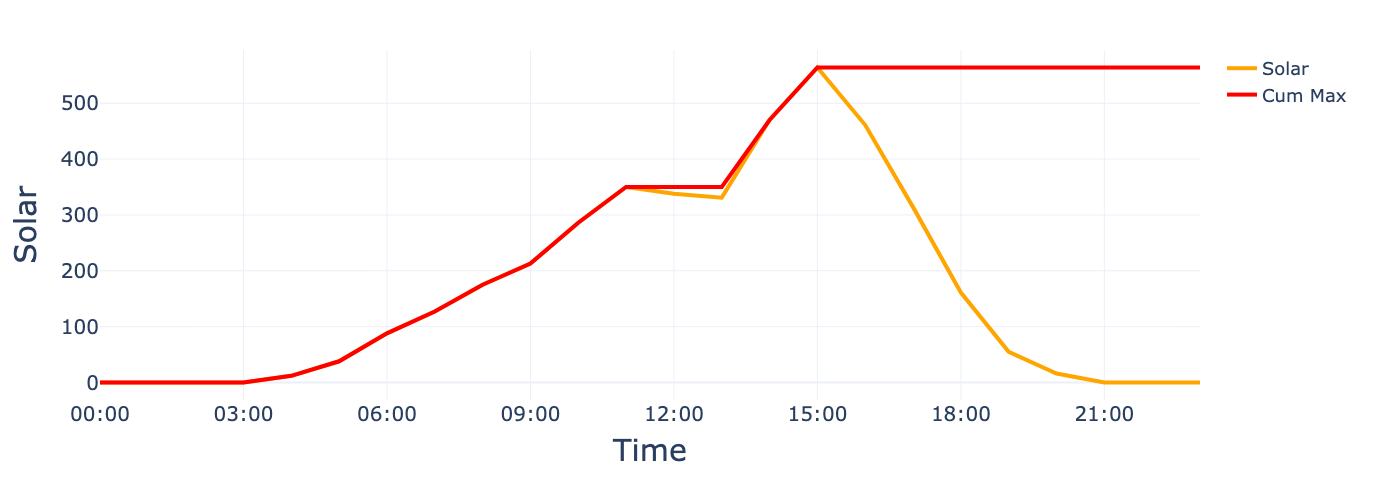
Warum kumulative Statistiken?

Zeitreihendiagramm der Solarleistung mit kumulativem Maximum der Solarleistung

Daten­transformation mit Polars

Kumulative Statistiken

prices.with_columns(
    pl.col("solar")
)
Daten­transformation mit Polars

Kumulative Statistiken

prices.with_columns(
    pl.col("solar").cum_max()
)
Daten­transformation mit Polars

Kumulative Statistiken

prices.with_columns(
    pl.col("solar").cum_max().alias("cumulative_solar")
)
Daten­transformation mit Polars

Kumulative Statistiken

prices.with_columns(
    pl.col("solar").cum_max().alias("cumulative_solar")
)
| time                | price | solar | cumulative_solar |
| ---                 | ---   | ---   | ---              |
| datetime[µs]        | f64   | f64   | f64              |
|---------------------|-------|-------|------------------|
| ...                 | ...   | ...   | ...              |
| 2025-07-05 10:00:00 | 2.3   | 419.0 | 419.0            |
| 2025-07-05 11:00:00 | 0.5   | 481.0 | 481.0            |
| 2025-07-05 12:00:00 | 0.0   | 462.0 | 481.0            |
| ...                 | ...   | ...   | ...              |
Daten­transformation mit Polars

Kumulative Summe für laufende Totale

prices.with_columns(
    pl.col("solar").cum_sum().alias("total_energy")
)
| time                | price | solar | total_energy |
| ---                 | ---   | ---   | ---          |
| datetime[µs]        | f64   | f64   | f64          |
|---------------------|-------|-------|--------------|
| 2025-07-05 06:00:00 | 22.1  | 62.0  | 62.0         |
| 2025-07-05 07:00:00 | 4.5   | 100.0 | 162.0        |
| 2025-07-05 08:00:00 | 1.7   | 180.0 | 342.0        |
Daten­transformation mit Polars

Lass uns üben!

Daten­transformation mit Polars

Preparing Video For Download...