Daten gruppenweise transformieren

Daten­transformation mit Polars

Liam Brannigan

Data Scientist & Polars Contributor

Warum mit Gruppenstatistiken vergleichen?
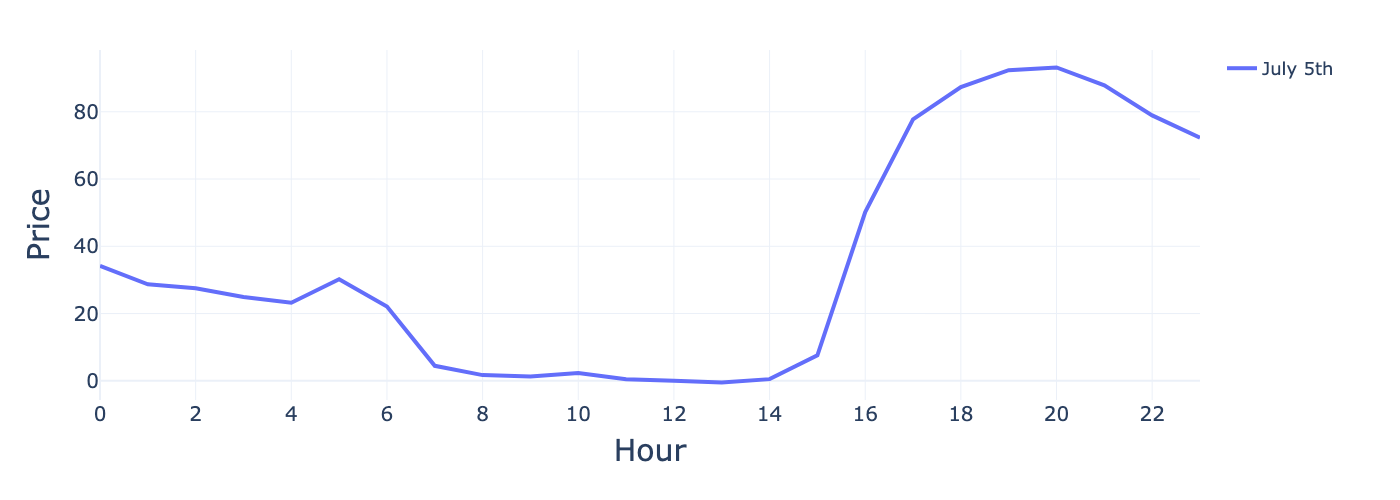
Zeitreihendiagramm der Strompreise über einen Tag

  • Sind die Preise höher oder niedriger als normal?
Daten­transformation mit Polars

Warum mit Gruppenstatistiken vergleichen?
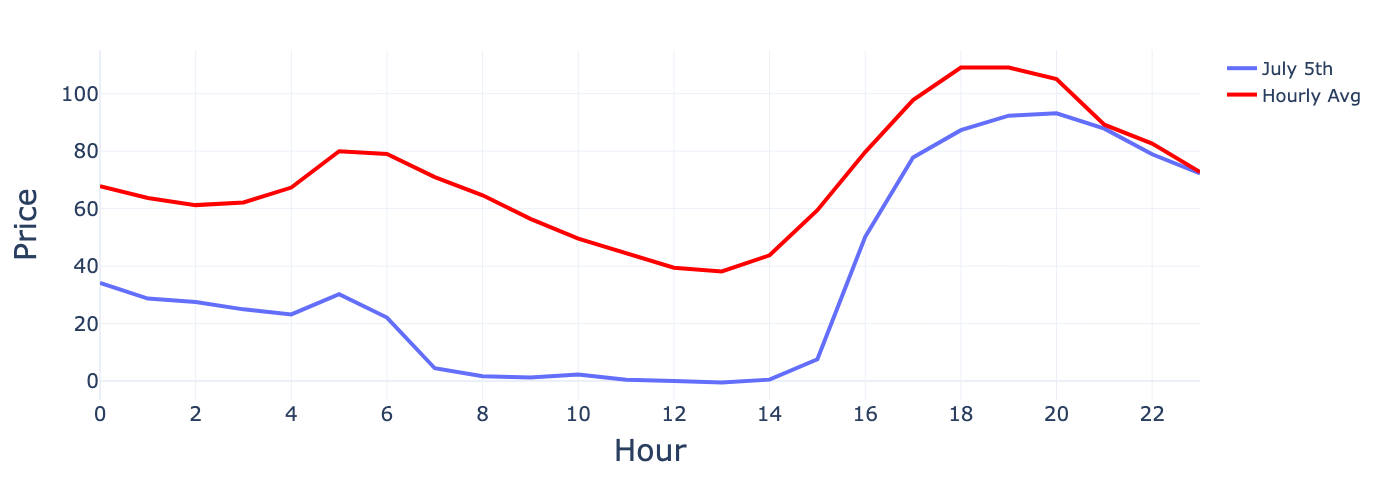
Zeitreihendiagramm der Strompreise über einen Tag mit stündlichen Durchschnittspreisen

Daten­transformation mit Polars

Warum mit Gruppenstatistiken vergleichen?
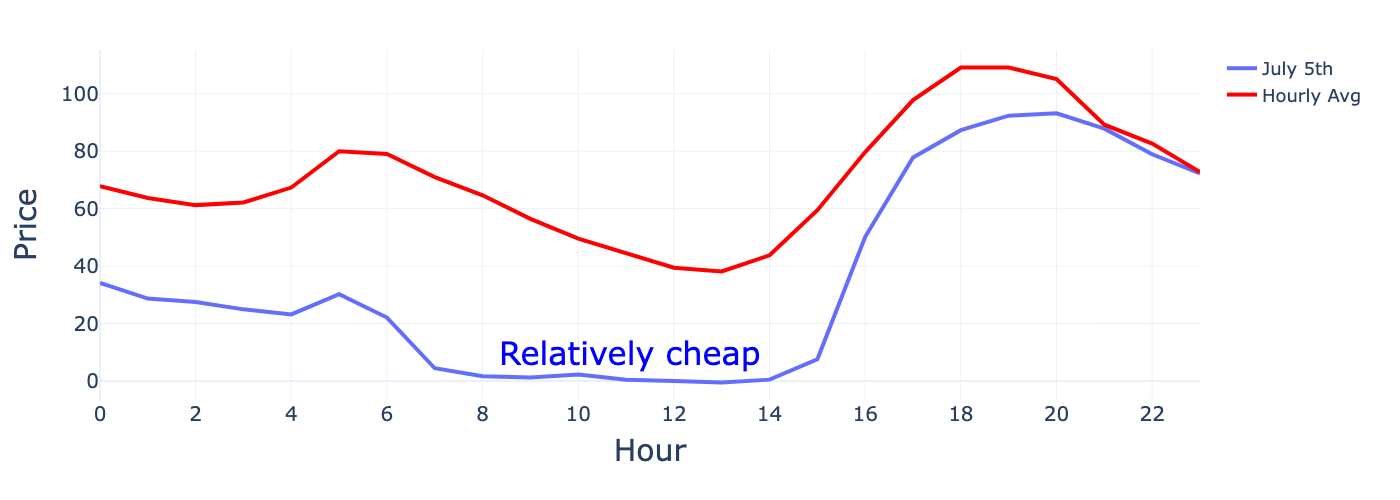
Zeitreihendiagramm der Strompreise über einen Tag mit stündlichen Durchschnittspreisen und einer Markierung für günstige Preise mittags

Daten­transformation mit Polars

Warum mit Gruppenstatistiken vergleichen?
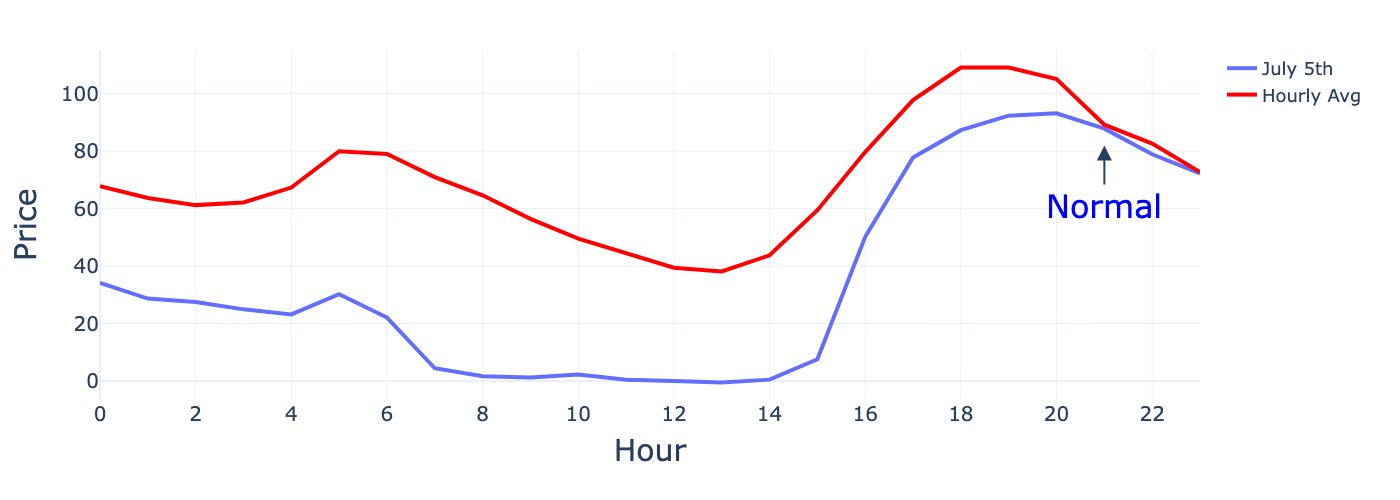
Zeitreihendiagramm der Strompreise über einen Tag mit stündlichen Durchschnittspreisen und einer Markierung für normale Preise am Abend

Daten­transformation mit Polars

Stunde extrahieren

prices.with_columns(
    pl.col("time").dt.hour().alias("hour")
)
| time                | price | solar   | hour |
| ---                 | ---   | ---     | ---  |
| datetime[µs]        | f64   | f64     | i8   |
|---------------------|-------|-------  |------|
| 2025-07-05 10:00:00 | 2.3   | 419.0   | 10   |
| 2025-07-05 11:00:00 | 0.5   | 481.0   | 11   |
| 2025-07-05 12:00:00 | 0.0   | 462.0   | 12   |
Daten­transformation mit Polars

Window-Funktion mit .over()

prices.with_columns(
    pl.col("price").mean()
)
Daten­transformation mit Polars

Window-Funktion mit .over()

prices.with_columns(
    pl.col("price").mean().over("hour")
)
Daten­transformation mit Polars

Window-Funktion mit .over()

prices.with_columns(
    pl.col("price").mean().over("hour").alias("hourly_avg")
)
Daten­transformation mit Polars

Window-Funktion mit .over()

prices.with_columns(
    pl.col("price").mean().over("hour").alias("hourly_avg")
)
| time                | price | solar | hour | hourly_avg |
| ---                 | ---   | ---   | ---  | ---        |
| datetime[µs]        | f64   | f64   | i8   | f64        |
|---------------------|-------|-------|------|------------|
| 2025-07-05 10:00:00 | 2.3   | 419.0 | 10   | 49.6       |
| 2025-07-05 11:00:00 | 0.5   | 481.0 | 11   | 44.4       |
| 2025-07-05 12:00:00 | 0.0   | 462.0 | 12   | 39.5       |
Daten­transformation mit Polars

Wetterkategorie erstellen

  • Sonnig: solar > 400 W/m²
  • Bewölkt: solar <= 400 W/m²
Daten­transformation mit Polars

Wetterkategorie erstellen

prices.with_columns(
    pl.when(pl.col("solar") > 400)
    .then(pl.lit("sunny"))
    .otherwise(pl.lit("cloudy"))

.alias("weather")
)
| time                | price | solar | weather |
| ---                 | ---   | ---   | ---     |
| datetime[µs]        | f64   | f64   | str     |
|---------------------|-------|-------|---------|
| 2025-07-05 10:00:00 | 2.3   | 419.0 | sunny   |
| 2025-07-06 10:00:00 | 80.5  | 181.0 | cloudy  |
| 2025-07-07 10:00:00 | 41.5  | 150.0 | cloudy  |
Daten­transformation mit Polars

Gruppieren nach mehreren Spalten

prices.with_columns(
    pl.col("price").mean()
)
Daten­transformation mit Polars

Gruppieren nach mehreren Spalten

prices.with_columns(
    pl.col("price").mean().over("hour", "weather")
)
Daten­transformation mit Polars

Gruppieren nach mehreren Spalten

prices.with_columns(
    pl.col("price").mean().over("hour", "weather").alias("avg_by_hour_weather")
)
Daten­transformation mit Polars

Gruppieren nach mehreren Spalten

prices.with_columns(
    pl.col("price").mean().over("hour", "weather").alias("avg_by_hour_weather")
)
| time                | price | hour | weather | avg_by_hour_weather |
| ---                 | ---   | ---  | ---     | ---                 |
| datetime[µs]        | f64   | i8   | str     | f64                 |
|---------------------|-------|------|---------|---------------------|
| 2025-07-05 10:00:00 | 2.3   | 10   | sunny   | 34.2                |
| 2025-07-06 10:00:00 | 80.5  | 10   | cloudy  | 58.0                |
| 2025-07-07 10:00:00 | 41.5  | 10   | cloudy  | 58.0                |
Daten­transformation mit Polars

Mit dem Gruppenmittel vergleichen

prices.with_columns(
    (pl.col("price")                                     )

)
Daten­transformation mit Polars

Mit dem Gruppenmittel vergleichen

prices.with_columns(
    (pl.col("price") - pl.col("price").mean().over("hour"))

)
Daten­transformation mit Polars

Mit dem Gruppenmittel vergleichen

prices.with_columns(
    (pl.col("price") - pl.col("price").mean().over("hour"))
    .alias("diff_from_hourly_avg")
)
| time                | price | hour | diff_from_hourly_avg |
| ---                 | ---   | ---  | ---                  |
| datetime[µs]        | f64   | i8   | f64                  |
|---------------------|-------|------|----------------------|
| 2025-07-05 10:00:00 | 2.3   | 10   | -47.3                |
| 2025-07-06 10:00:00 | 25.1  | 10   | -24.5                |
| 2025-07-07 10:00:00 | 2.7   | 10   | -46.9                |
Daten­transformation mit Polars

Weitere Window-Aggregationen

.over() funktioniert mit vielen Aggregationen:

  • .sum().over() – Gruppensummen
  • .max().over() – Gruppenmaxima
  • .count().over() – Gruppengrößen
Daten­transformation mit Polars

Lass uns üben!

Daten­transformation mit Polars

Preparing Video For Download...