Plotting directly using pandas
Python for R Users

Daniel Chen
Instructor
Plotting in Python
- Quickly show data patterns
- Plotting methods in Python:
- pandas
- Seaborn
- Matplotlib
Pandas plot method
plot()method- Works on the pandas DataFrame and Series objects
- Pass
plotthekindargument kindof plots:line: line plot (default)bar: vertical bar plotbarh: horizontal bar plot
hist: histogrambox: boxplotkde: Kernel Density Estimation plotdensity: same as ‘kde’area: area plotpie: pie plotscatter: scatter plothexbin: hexbin plot
Univariate: Histogram
import matplotlib.pyplot as plt
iris['sepal_length'].plot(kind='hist')
plt.show()

Univariate: Bar plot
cts = iris['species'].value_counts()
cts.plot(kind='bar')
plt.show()

Bivariate: Scatter plot
iris.plot(kind='scatter', x='Sepal.Length', y='Sepal.Width')
plt.show()

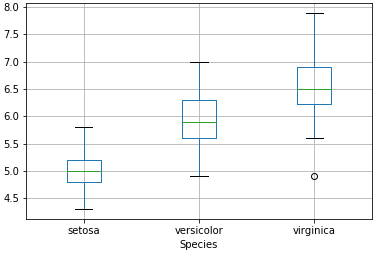
Bivariate: Boxplots
iris.plot(kind='box')
plt.show()

Bivariate: Boxplots
iris.boxplot(by='Species', column='Sepal.Length')
plt.show()

Let's practice!
Python for R Users

