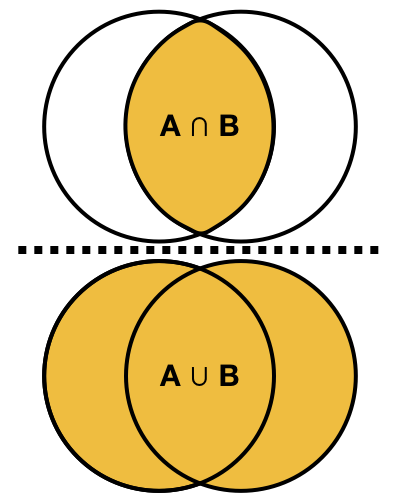
Measuring distance for categorical data

Cluster Analysis in R

Dmitriy (Dima) Gorenshteyn

Lead Data Scientist, Memorial Sloan Kettering Cancer Center

Binary data

wine beer whiskey vodka
1 TRUE TRUE FALSE FALSE
2 FALSE TRUE TRUE TRUE
... ... ... ... ...

Cluster Analysis in R

Jaccard index


$$ J(A,B) = \frac{A \cap B}{A \cup B} $$

Cluster Analysis in R

Calculating Jaccard distance

wine beer whiskey vodka
1 TRUE TRUE FALSE FALSE
2 FALSE TRUE TRUE TRUE

$$ J(1,2) = \frac{1 \cap 2}{1 \cup 2} = \frac{1}{4} = 0.25$$

$$ Distance(1,2) = 1 - J(1,2) = 0.75$$

Cluster Analysis in R

Calculating Jaccard distance in R

print(survey_a)
   wine  beer whiskey vodka
  <lgl> <lgl>   <lgl> <lgl>
1  TRUE  TRUE   FALSE FALSE
2 FALSE  TRUE    TRUE  TRUE
3  TRUE FALSE    TRUE FALSE
dist(survey_a, method = "binary")
          1         2
2 0.7500000          
3 0.6666667 0.7500000
Cluster Analysis in R

More than two categories

color sport
1 red soccer
2 green hockey
3 blue hockey
4 blue soccer


colorblue colorgreen colorred sporthockey sportsoccer
1 0 0 1 0 1
2 0 1 0 1 0
3 1 0 0 1 0
4 1 0 0 0 1


Cluster Analysis in R

Dummification in R

print(survey_b)
  color  sport
1   red soccer
2 green hockey
3  blue hockey
4  blue soccer
library(dummies)
dummy.data.frame(survey_b)
  colorblue colorgreen colorred sporthockey sportsoccer
1         0          0        1           0           1
2         0          1        0           1           0
3         1          0        0           1           0
4         1          0        0           0           1
Cluster Analysis in R

Generalizing categorical distance in R

print(survey_b)
  color  sport
1   red soccer
2 green hockey
3  blue hockey
4  blue soccer
dummy_survey_b <- dummy.data.frame(survey_b)
dist(dummy_survey_b, method = 'binary')
          1         2         3
2 1.0000000                    
3 1.0000000 0.6666667          
4 0.6666667 1.0000000 0.6666667
Cluster Analysis in R

Let's practice!

Cluster Analysis in R

Preparing Video For Download...