Making sense of the K-means clusters
Cluster Analysis in R

Dmitriy (Dima) Gorenshteyn
Lead Data Scientist, Memorial Sloan Kettering Cancer Center
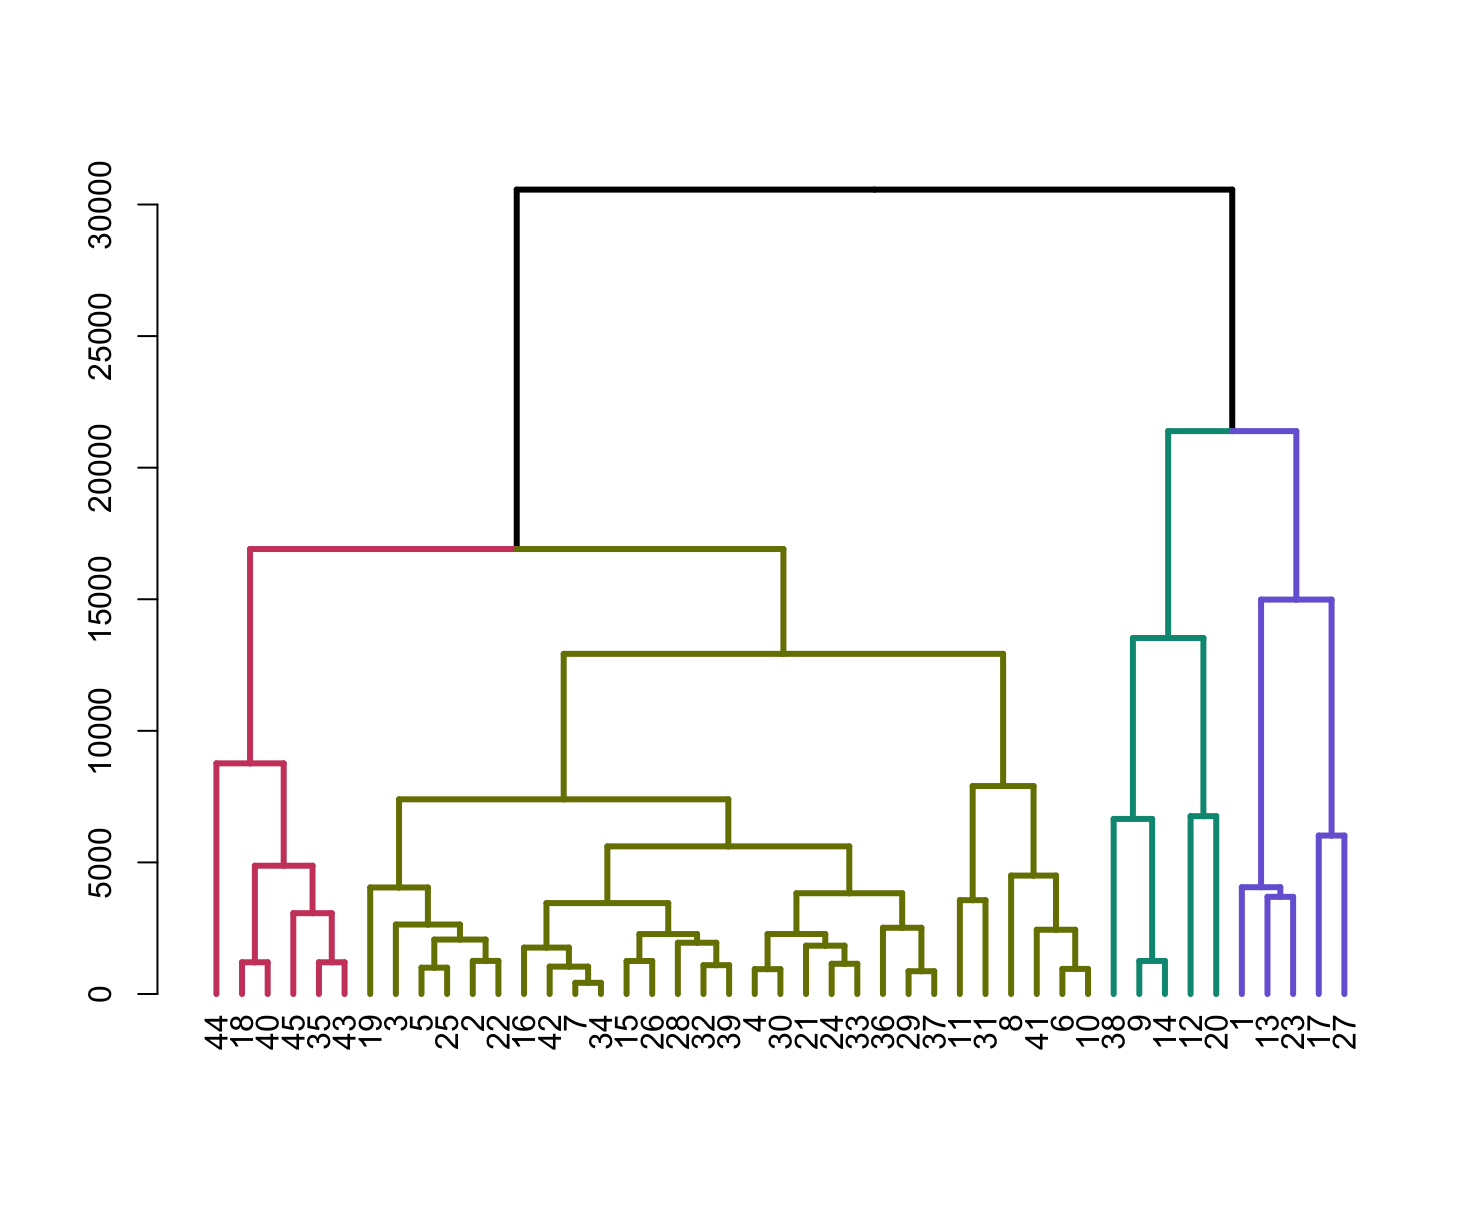
Segmenting with hierarchical clustering
Cluster Analysis in R
Dmitriy (Dima) Gorenshteyn
Lead Data Scientist, Memorial Sloan Kettering Cancer Center

