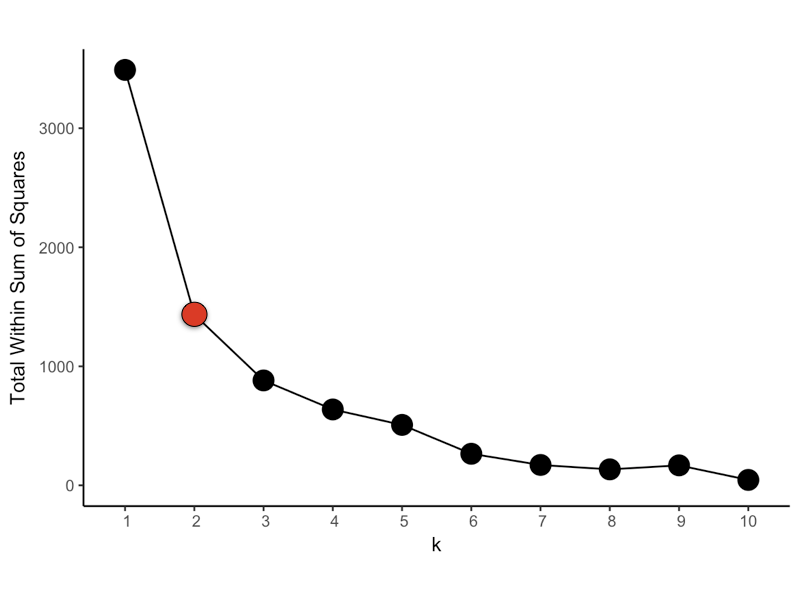
Evaluating different values of K by eye
Cluster Analysis in R

Dmitriy (Dima) Gorenshteyn
Lead Data Scientist, Memorial Sloan Kettering Cancer Center
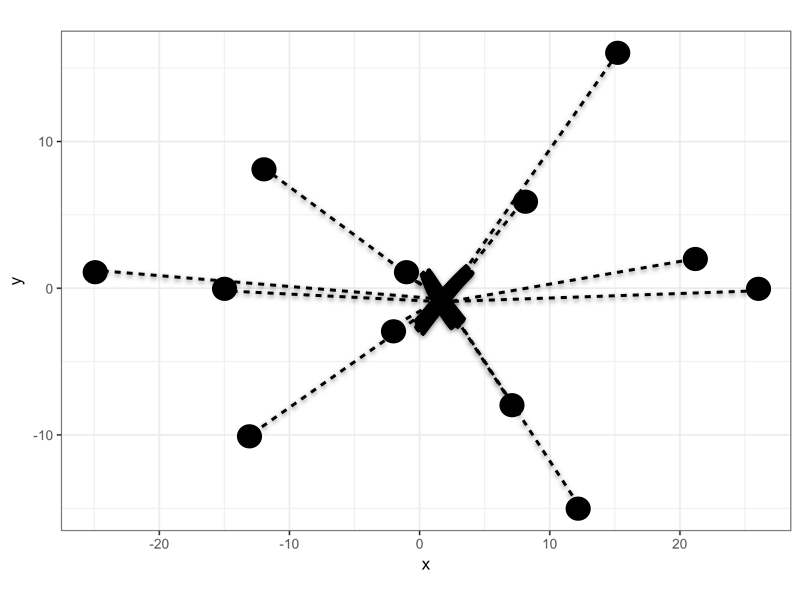
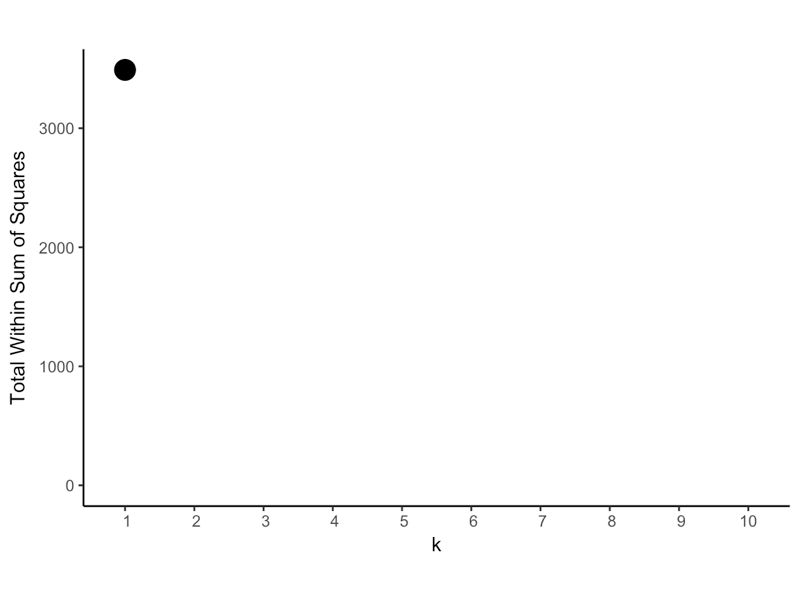
Total within-cluster sum of squares: k = 1
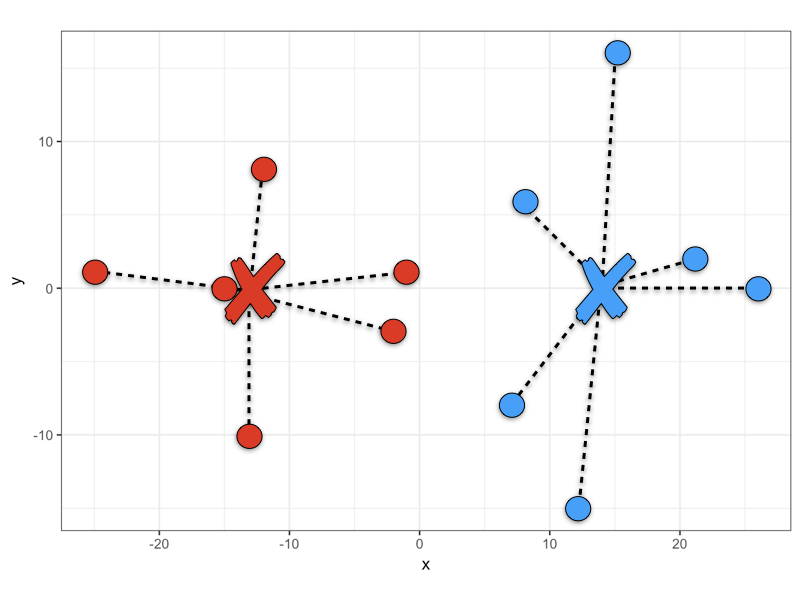
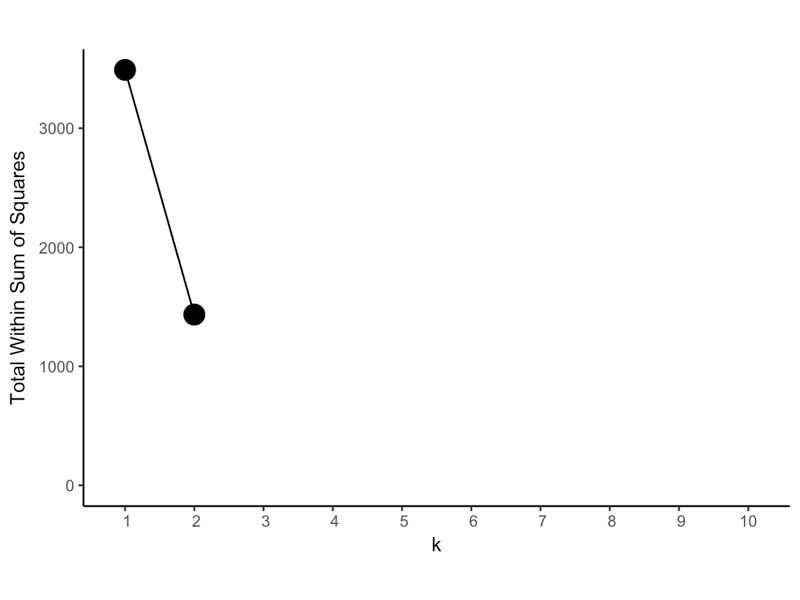
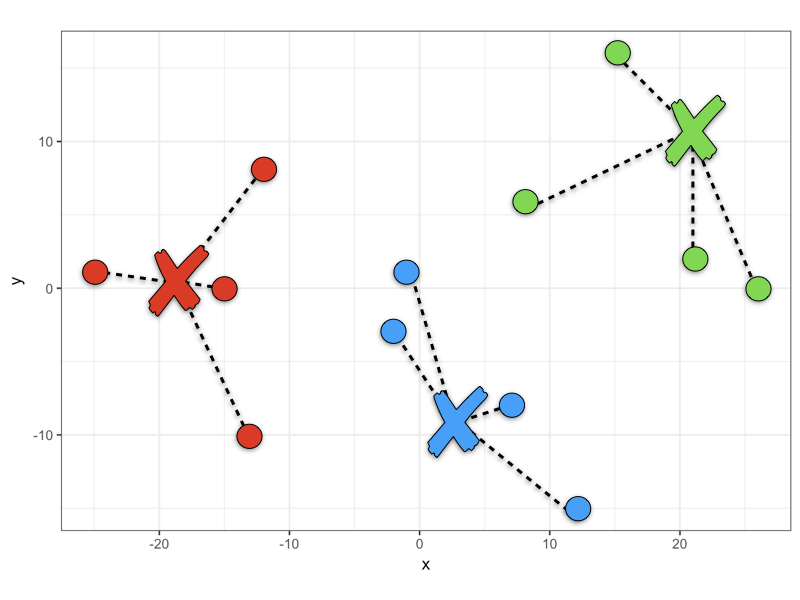
Total within-cluster sum of squares: k = 2
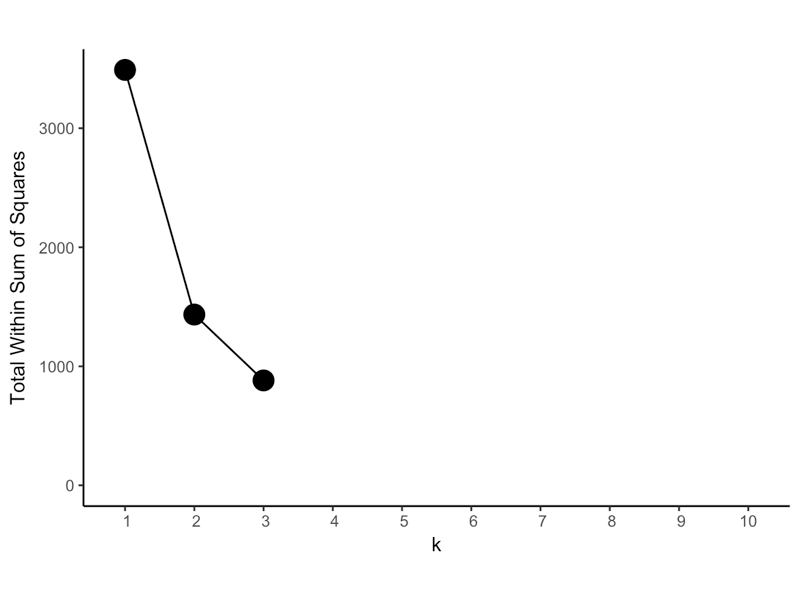
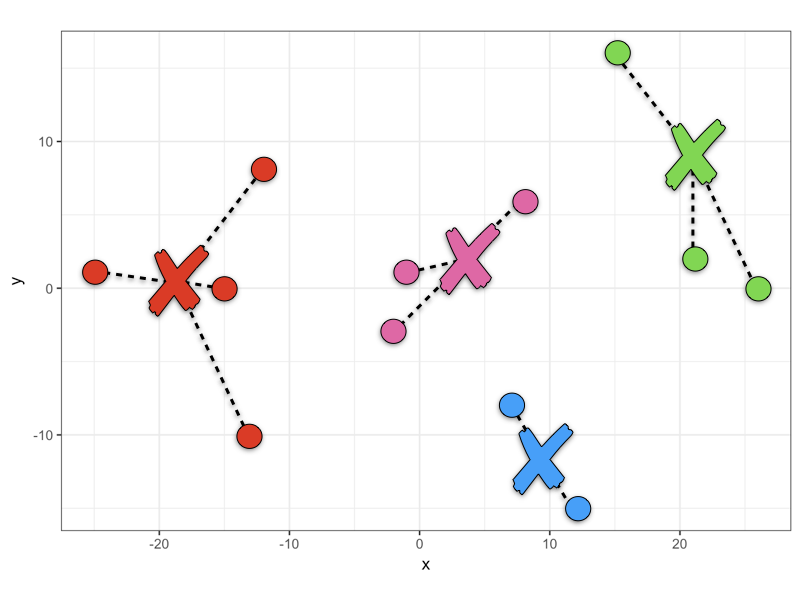
Total within-cluster sum of squares: k = 3
Total within-cluster sum of squares: k = 4
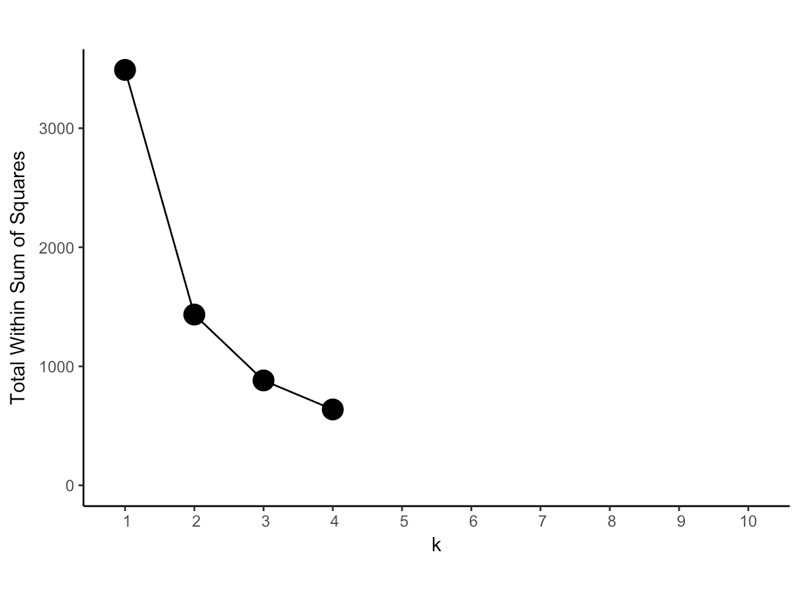
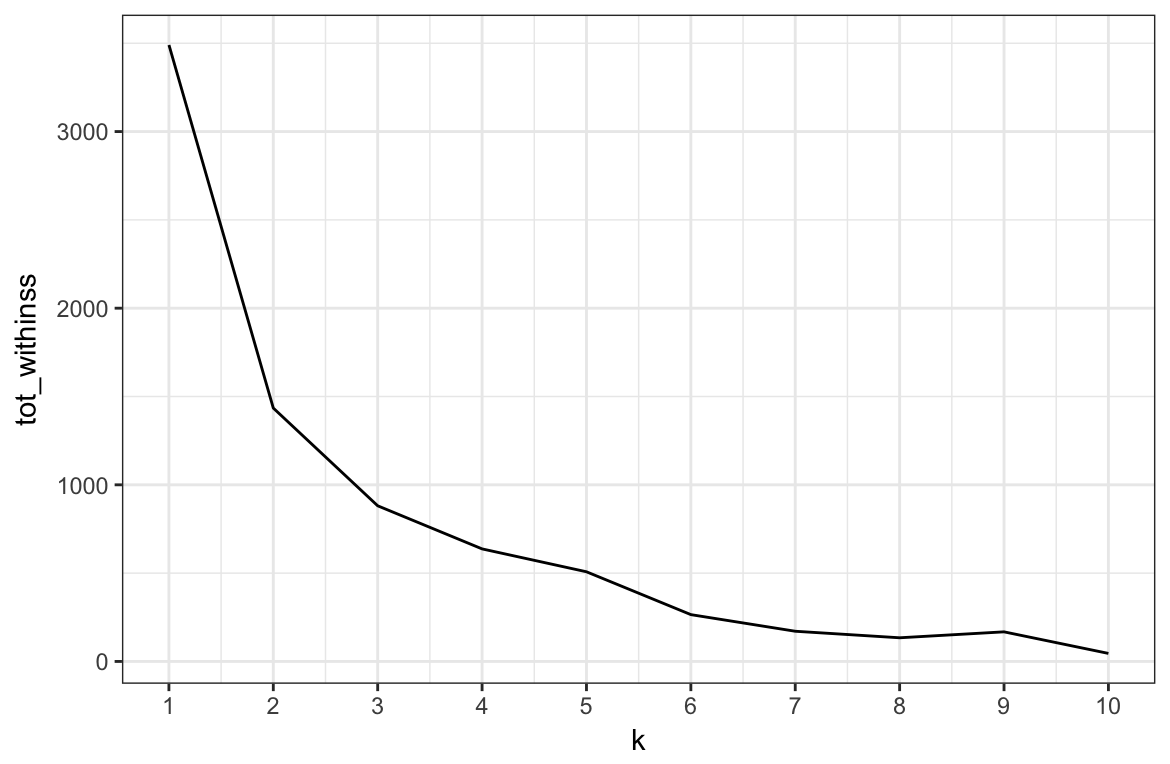
Elbow plot
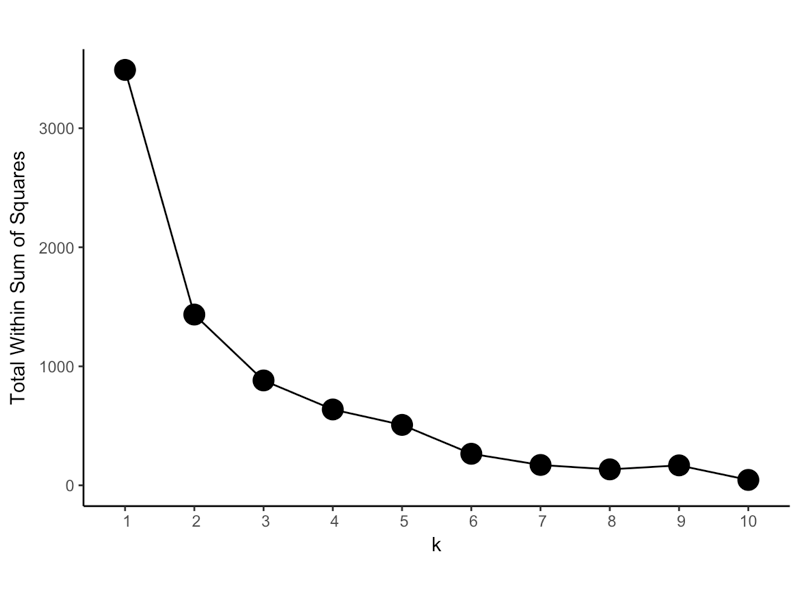
Elbow plot
Generating the elbow plot
ggplot(elbow_df, aes(x = k, y = tot_withinss)) +
  geom_line() +
  scale_x_continuous(breaks = 1:10)