Intermediate Regression in R
Richie Cotton
Data Evangelist at DataCamp
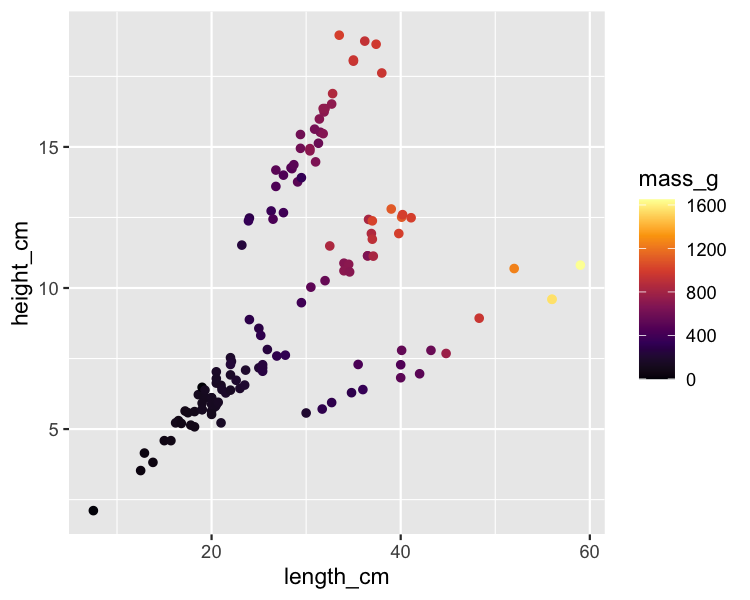
ggplot(
  fish,
  aes(length_cm, height_cm, color = mass_g)
) +
  geom_point() +
  scale_color_viridis_c(option = "inferno")
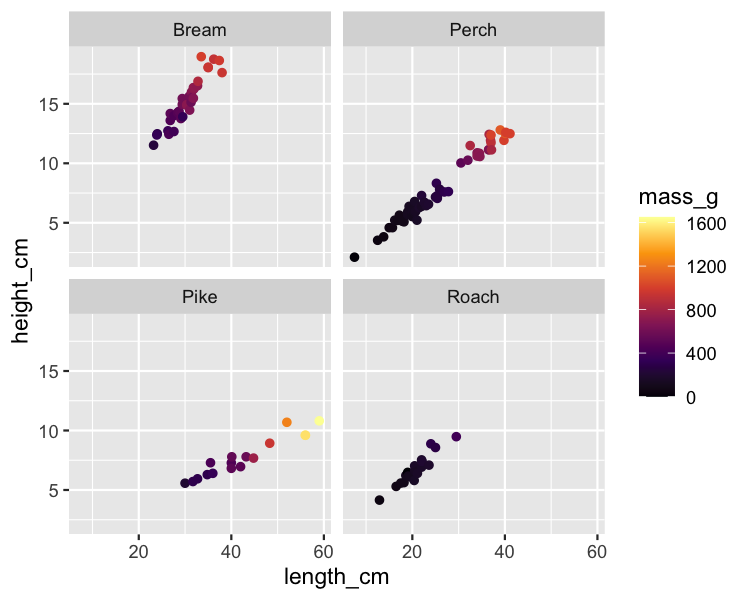
ggplot(
  fish,
  aes(length_cm, height_cm, color = mass_g)
) +
  geom_point() +
  scale_color_viridis_c(option = "inferno") +
  facet_wrap(vars(species))
Bez interakcí
lm(mass_g ~ length_cm + height_cm + species + 0, data = fish)
Interakce 2. řádu mezi dvojicemi proměnných
lm(
  mass_g ~ length_cm + height_cm + species + length_cm:height_cm + length_cm:species + height_cm:species + 0,
  data = fish
)
Interakce 3. řádu mezi všemi třemi proměnnými
lm(
  mass_g ~ length_cm + height_cm + species + length_cm:height_cm + length_cm:species + height_cm:species + length_cm:height_cm:species + 0,
  data = fish
)
lm(
  mass_g ~ length_cm * height_cm * species + 0,
  data = fish
)
lm(
  mass_g ~ (length_cm + height_cm + species) ^ 2 + 0,
  data = fish
)
lm(
  mass_g ~ I(length_cm) ^ 2 + height_cm + species + 0,
  data = fish
)
mdl_mass_vs_all <- lm(mass_g ~ length_cm * height_cm * species * 0, data = fish)

explanatory_data <- expand_grid(
  length_cm = seq(5, 60, 6),
  height_cm = seq(2, 20, 2),
  species = unique(fish$species)
)

prediction_data <- explanatory_data %>%
  mutate(mass_g = predict(mdl_mass_vs_all, explanatory_data))
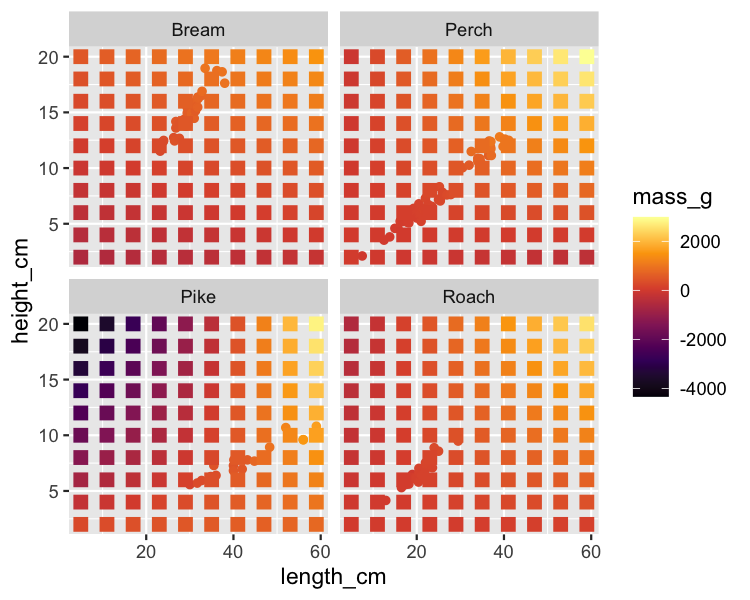
ggplot(
  fish,
  aes(length_cm, height_cm, color = mass_g)
) +
  geom_point() +
  scale_color_viridis_c(option = "inferno") +
  facet_wrap(vars(species)) +
  geom_point(
    data = prediction_data,
    size = 3, shape = 15
  )