Korelace indexu a export do Excelu

Manipulace s časovými řadami v Pythonu

Stefan Jansen

Founder & Lead Data Scientist at Applied Artificial Intelligence

Další analýza vašeho indexu

  • Korelace denních výnosů:

  • Výpočet pro všechny komponenty

  • Vizualizace výsledku jako heatmapa

  • Zápis výsledků do Excelu ve formátech .xls a .xlsx:

  • Jeden list

  • Více listů

Manipulace s časovými řadami v Pythonu

Komponenty indexu – cenová data

data = DataReader(tickers, 'google', start='2016', end='2017')['Close']

data.info()
DatetimeIndex: 252 entries, 2016-01-04 to 2016-12-30
Data columns (total 12 columns):
ABB     252 non-null float64
BABA    252 non-null float64
JNJ     252 non-null float64
JPM     252 non-null float64
KO      252 non-null float64
ORCL    252 non-null float64
PG      252 non-null float64
T       252 non-null float64
TM      252 non-null float64
UPS     252 non-null float64
WMT     252 non-null float64
XOM     252 non-null float64
Manipulace s časovými řadami v Pythonu

Komponenty indexu: korelace výnosů

daily_returns = data.pct_change()

correlations = daily_returns.corr()
ABB  BABA  JNJ  JPM   KO  ORCL   PG    T   TM  UPS  WMT  XOM
ABB  1.00  0.40 0.33 0.56 0.31  0.53 0.34 0.29 0.48 0.50 0.15 0.48
BABA 0.40  1.00 0.27 0.27 0.25  0.38 0.21 0.17 0.34 0.35 0.13 0.21
JNJ  0.33  0.27 1.00 0.34 0.30  0.37 0.42 0.35 0.29 0.45 0.24 0.41
JPM  0.56  0.27 0.34 1.00 0.22  0.57 0.27 0.13 0.49 0.56 0.14 0.48
KO   0.31  0.25 0.30 0.22 1.00  0.31 0.62 0.47 0.33 0.50 0.25 0.29
ORCL 0.53  0.38 0.37 0.57 0.31  1.00 0.41 0.32 0.48 0.54 0.21 0.42
PG   0.34  0.21 0.42 0.27 0.62  0.41 1.00 0.43 0.32 0.47 0.33 0.34
T    0.29  0.17 0.35 0.13 0.47  0.32 0.43 1.00 0.28 0.41 0.31 0.33
TM   0.48  0.34 0.29 0.49 0.33  0.48 0.32 0.28 1.00 0.52 0.20 0.30
UPS  0.50  0.35 0.45 0.56 0.50  0.54 0.47 0.41 0.52 1.00 0.33 0.45
WMT  0.15  0.13 0.24 0.14 0.25  0.21 0.33 0.31 0.20 0.33 1.00 0.21
XOM  0.48  0.21 0.41 0.48 0.29  0.42 0.34 0.33 0.30 0.45 0.21 1.00
Manipulace s časovými řadami v Pythonu

Komponenty indexu: korelace výnosů

sns.heatmap(correlations, annot=True)
plt.xticks(rotation=45)
plt.title('Daily Return Correlations')
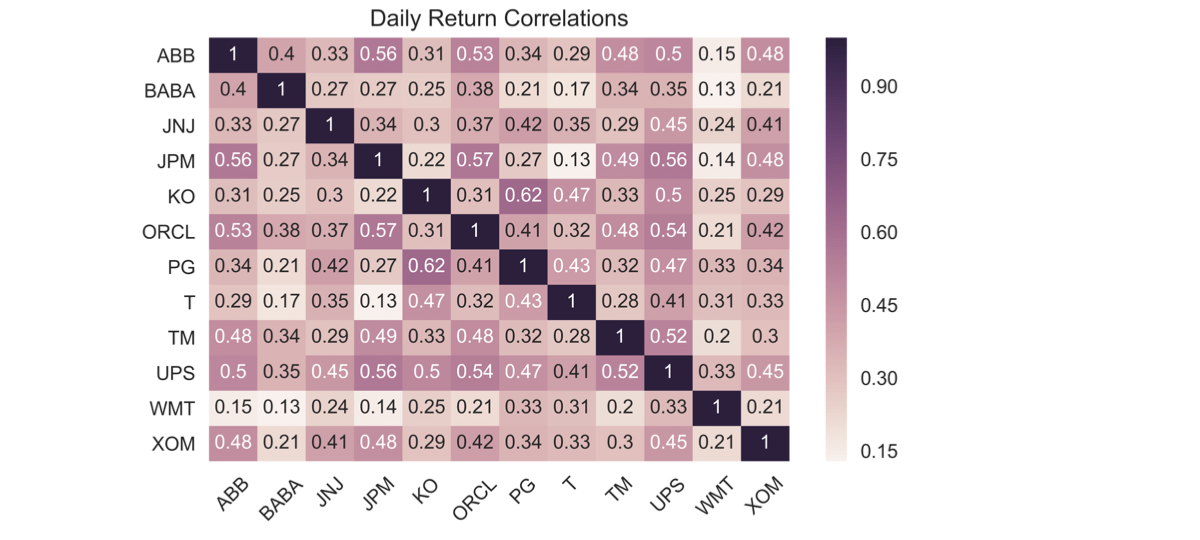
Korelace denních výnosů komponent indexu

Manipulace s časovými řadami v Pythonu

Uložení do jednoho listu Excelu

correlations.to_excel(excel_writer= 'correlations.xls',
                      sheet_name='correlations',
                      startrow=1,
                      startcol=1)
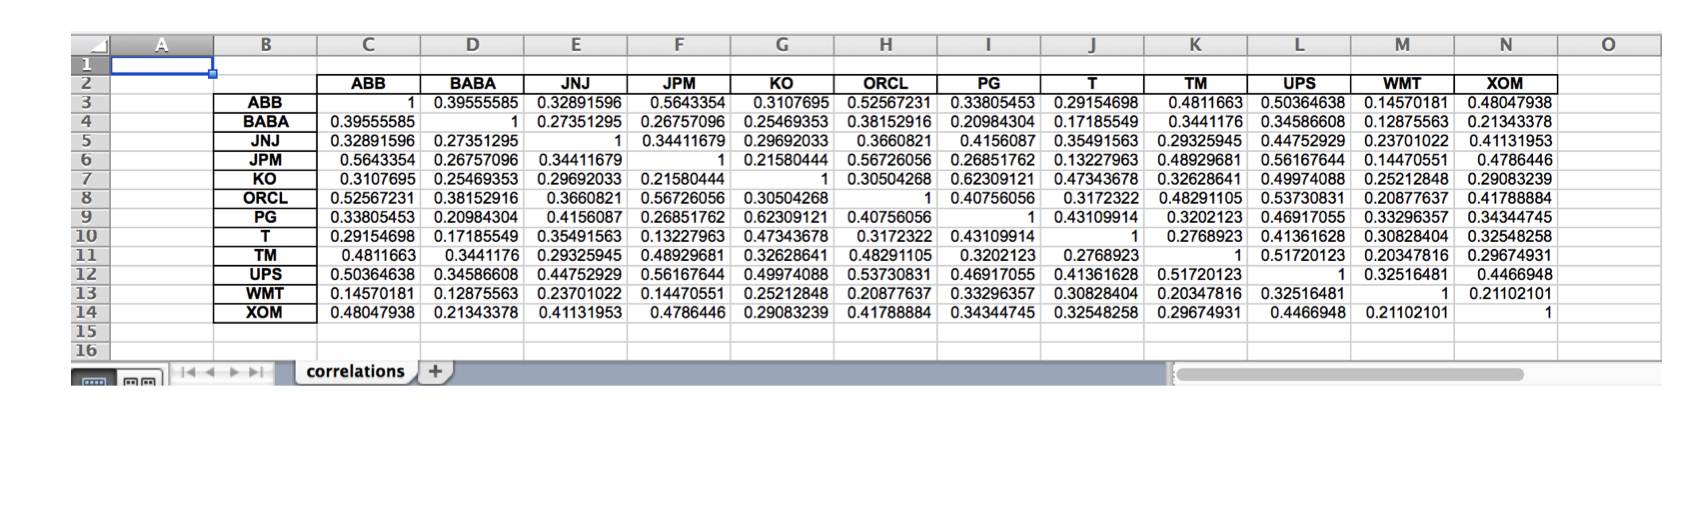
Uložení korelací do jednoho listu Excelu

Manipulace s časovými řadami v Pythonu

Uložení do více listů Excelu

data.index = data.index.date # Keep only date component

with pd.ExcelWriter('stock_data.xlsx') as writer:
corr.to_excel(excel_writer=writer, sheet_name='correlations')
data.to_excel(excel_writer=writer, sheet_name='prices')
data.pct_change().to_excel(writer, sheet_name='returns')
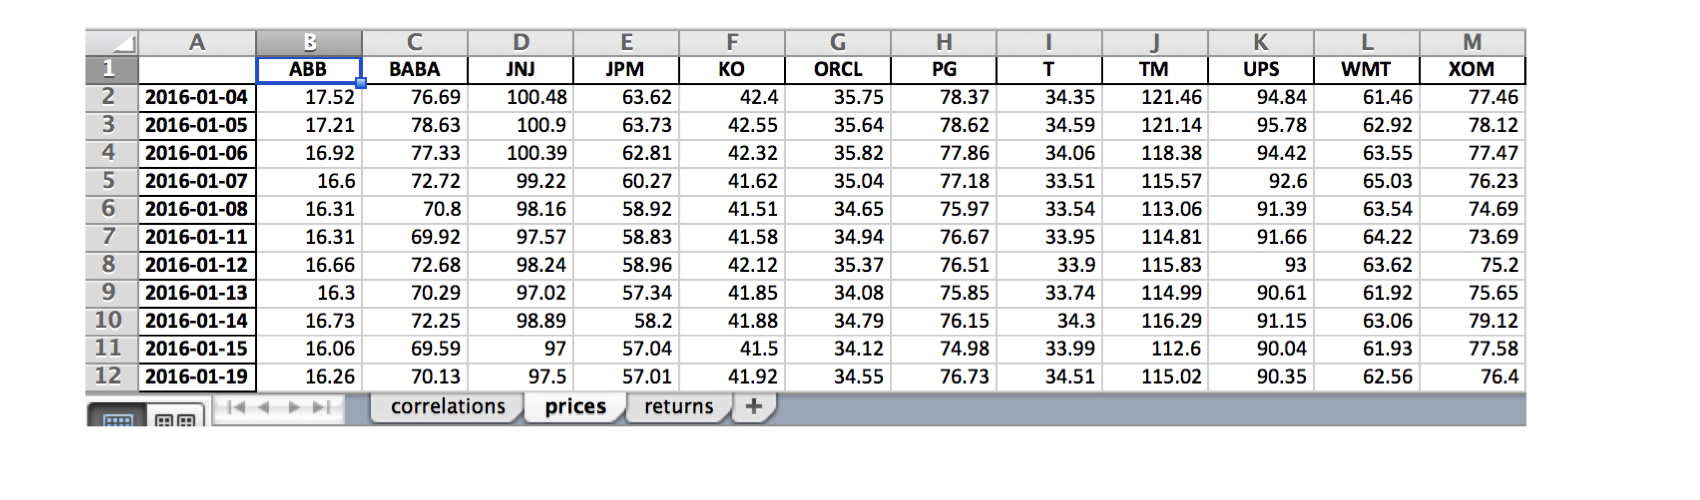
Korelace indexu a uložení výsledků do Excelu

Manipulace s časovými řadami v Pythonu

Pojďme si procvičit!

Manipulace s časovými řadami v Pythonu

Preparing Video For Download...