Další metriky modelu

Machine Learning with Tree-Based Models in R

Sandro Raabe

Data Scientist

Omezení přesnosti


  • „Naivní" model vždy predikující no může dosáhnout 98% přesnosti

$\rightarrow$ Možné u nevyvážené datové sady s 98 % negativních vzorků

Machine Learning with Tree-Based Models in R

Senzitivita neboli míra skutečně pozitivních

  • Podíl všech pozitivních výsledků, které byly správně klasifikovány
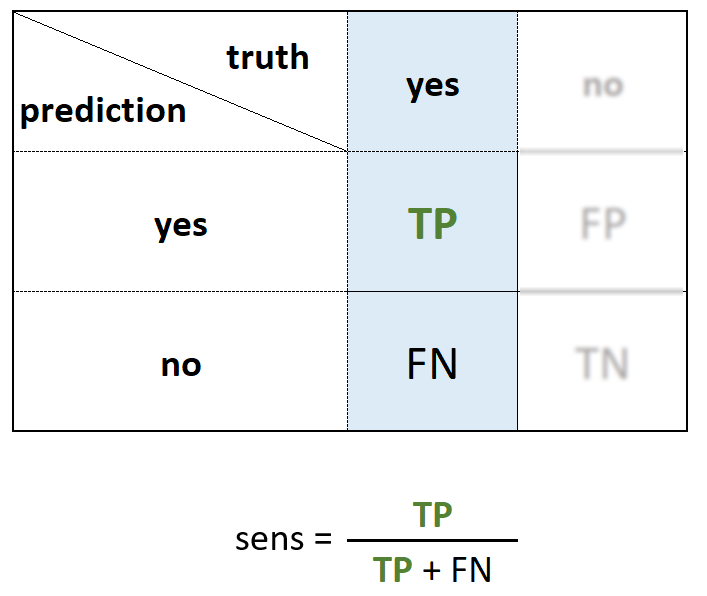
matice záměn zobrazující senzitivitu

Machine Learning with Tree-Based Models in R

Specificita neboli míra skutečně negativních

  • Podíl všech negativních výsledků, které byly správně klasifikovány
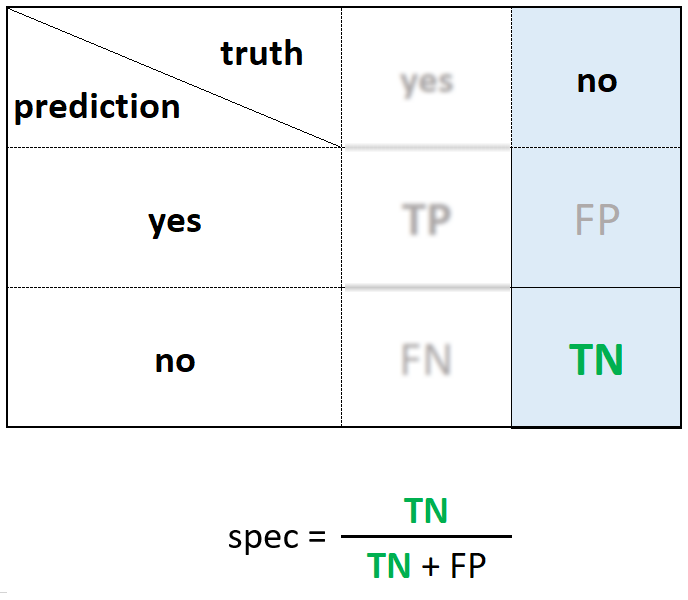
matice záměn zobrazující míru skutečně negativních

Machine Learning with Tree-Based Models in R

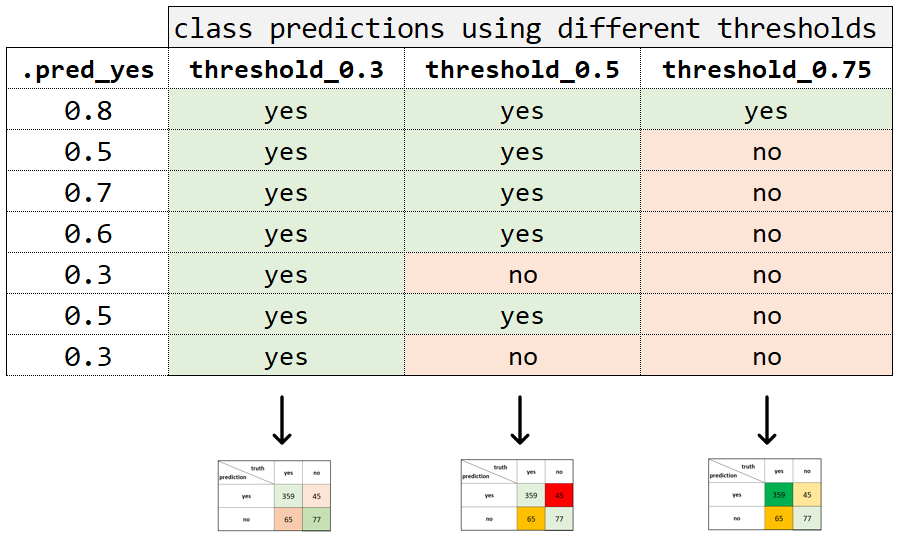
tabulka různých prahů

Machine Learning with Tree-Based Models in R

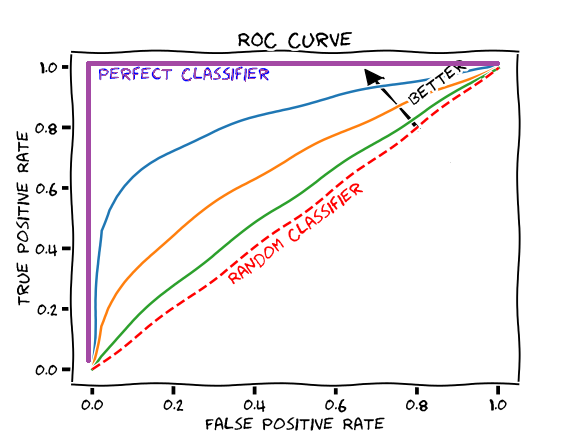
ROC (Receiver-operating-characteristic) křivka

  • Vizualizuje výkon klasifikačního modelu pro všechny možné prahy
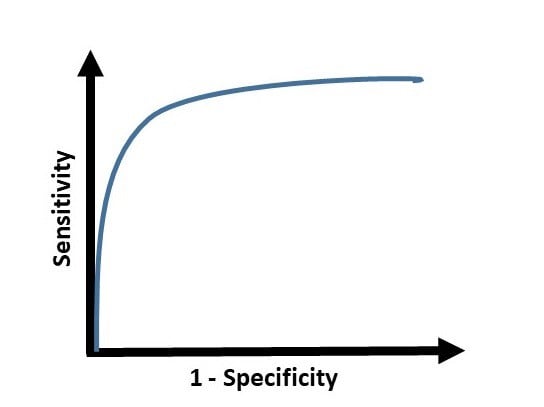
graf ROC křivky

Machine Learning with Tree-Based Models in R

ROC křivka a AUC

různé ROC křivky

Machine Learning with Tree-Based Models in R

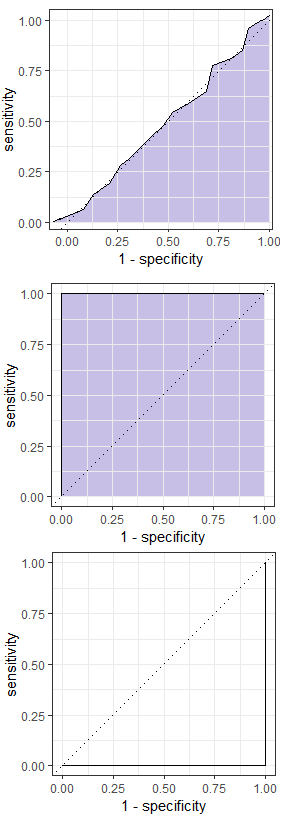
Plocha pod ROC křivkou

graf AUC

  • AUC = 0,5
  • Výkon není lepší než náhodný odhad


  • AUC = 1
  • Všechny příklady správně klasifikovány pro každý práh $\rightarrow$ dokonalý model


  • AUC = 0
  • Každý příklad klasifikován nesprávně
Machine Learning with Tree-Based Models in R

yardstick senzitivita: sens()

predictions
# A tibble: 153 x 2
.pred_class   true_class
      <fct>        <fct>     
 1      yes           no        
 2       no           no        
 3       no          yes       
 4      yes          yes
# Calculate single-threshold sensitivity
sens(predictions, 
     estimate = .pred_class, 
     truth = true_class)
# A tibble: 1 x 2
  .metric        .estimate
  <chr>              <dbl>
1 sensitivity        0.872
  • Stejné argumenty jako accuracy() a conf_mat()
Machine Learning with Tree-Based Models in R

yardstick ROC: roc_curve()

# Predict probabilities on test set
predictions <- predict(model,
                       data_test,

type = "prob") %>%
bind_cols(data_test)
# A tibble: 9,116 x 13
   .pred_yes still_customer age gender    ...
       <dbl> <fct>         <int> <fct>    ...
 1    0.0557 no               45 M        ...
 2    0.0625 no               49 F        ...
 3    0.330  no               51 M        ...
 4    ...
 ...
# Calculate the ROC curve for all thresholds
roc <- roc_curve(predictions,

estimate = .pred_yes,
truth = still_customer)
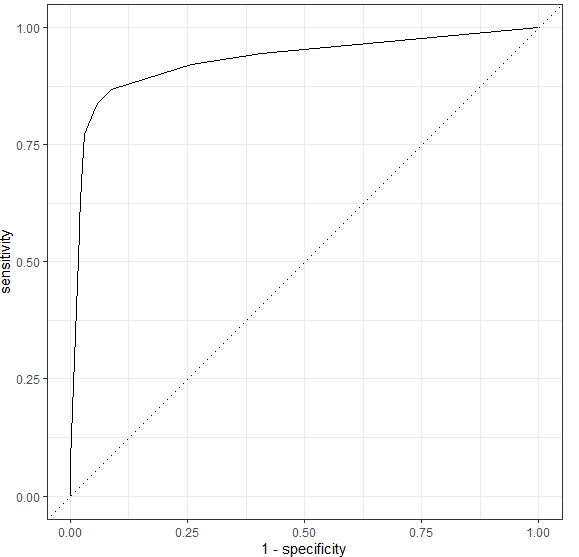
# Plot the ROC curve autoplot(roc)

roc křivka

Machine Learning with Tree-Based Models in R

yardstick AUC: roc_auc()

  • Stejné argumenty: data, sloupec predikcí, sloupec pravdy
# Calculate area under curve
roc_auc(predictions, 
        estimate = .pred_yes, 
        truth = still_customer)
# A tibble: 1 x 3
  .metric .estimator .estimate
  <chr>   <chr>          <dbl>
1 roc_auc binary         0.872
Machine Learning with Tree-Based Models in R

Změřme to!

Machine Learning with Tree-Based Models in R

Preparing Video For Download...