Vrstva faset

Intermediate Data Visualization with ggplot2

Rick Scavetta

Founder, Scavetta Academy
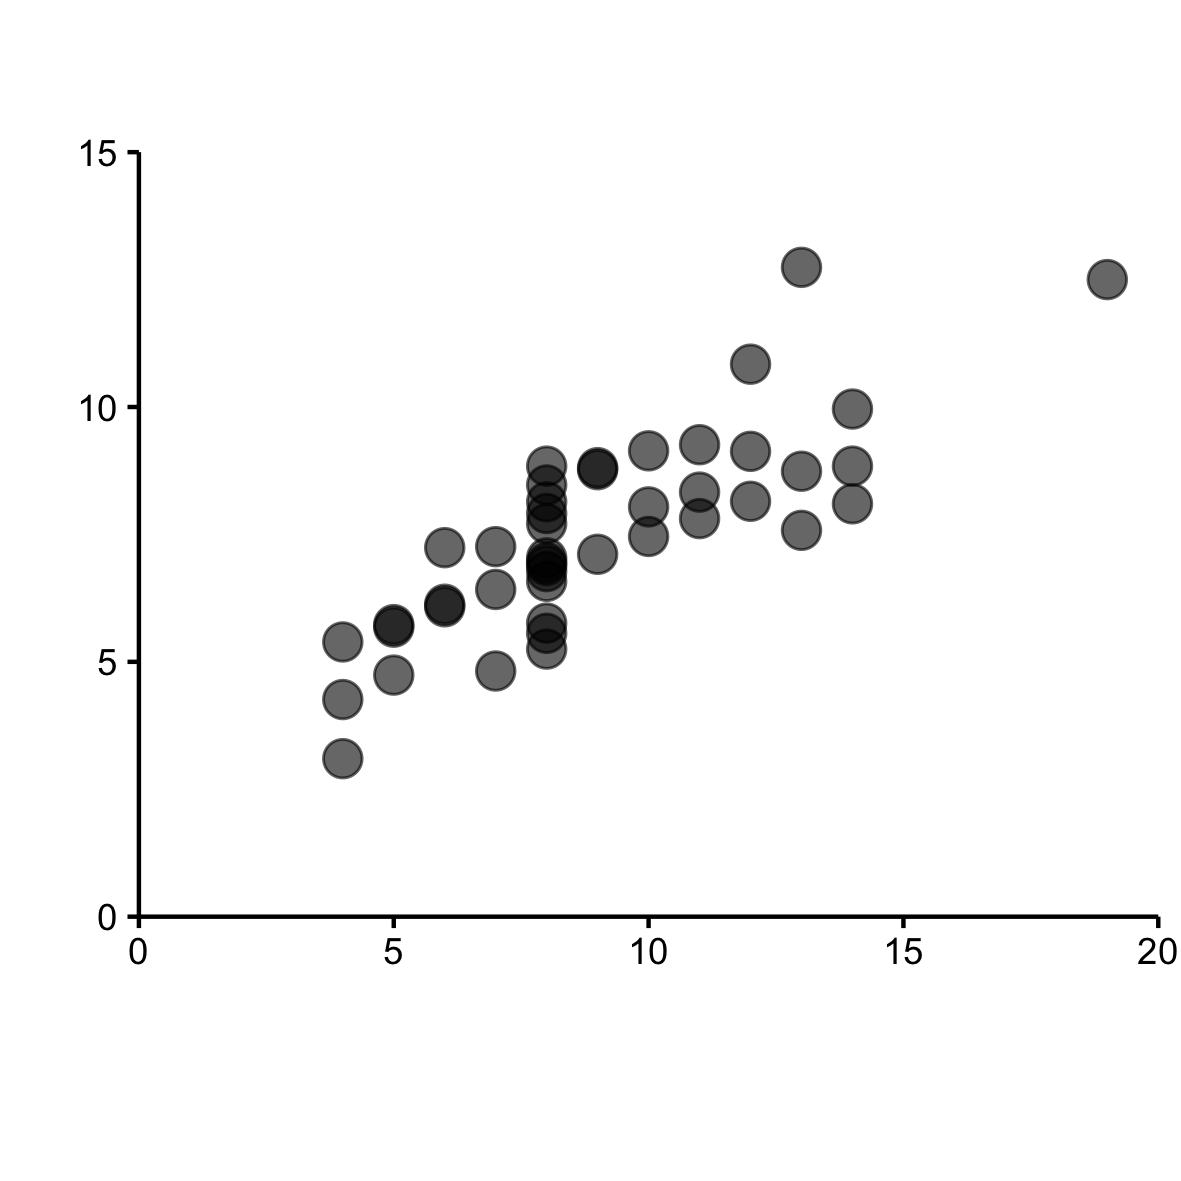
Fasety

  • Jednoduché, ale užitečné
  • Koncept malých násobků
    • Popularizoval Edward Tufte
    • Visualization of Quantitative Information, 1983
Intermediate Data Visualization with ggplot2

Intermediate Data Visualization with ggplot2

Intermediate Data Visualization with ggplot2

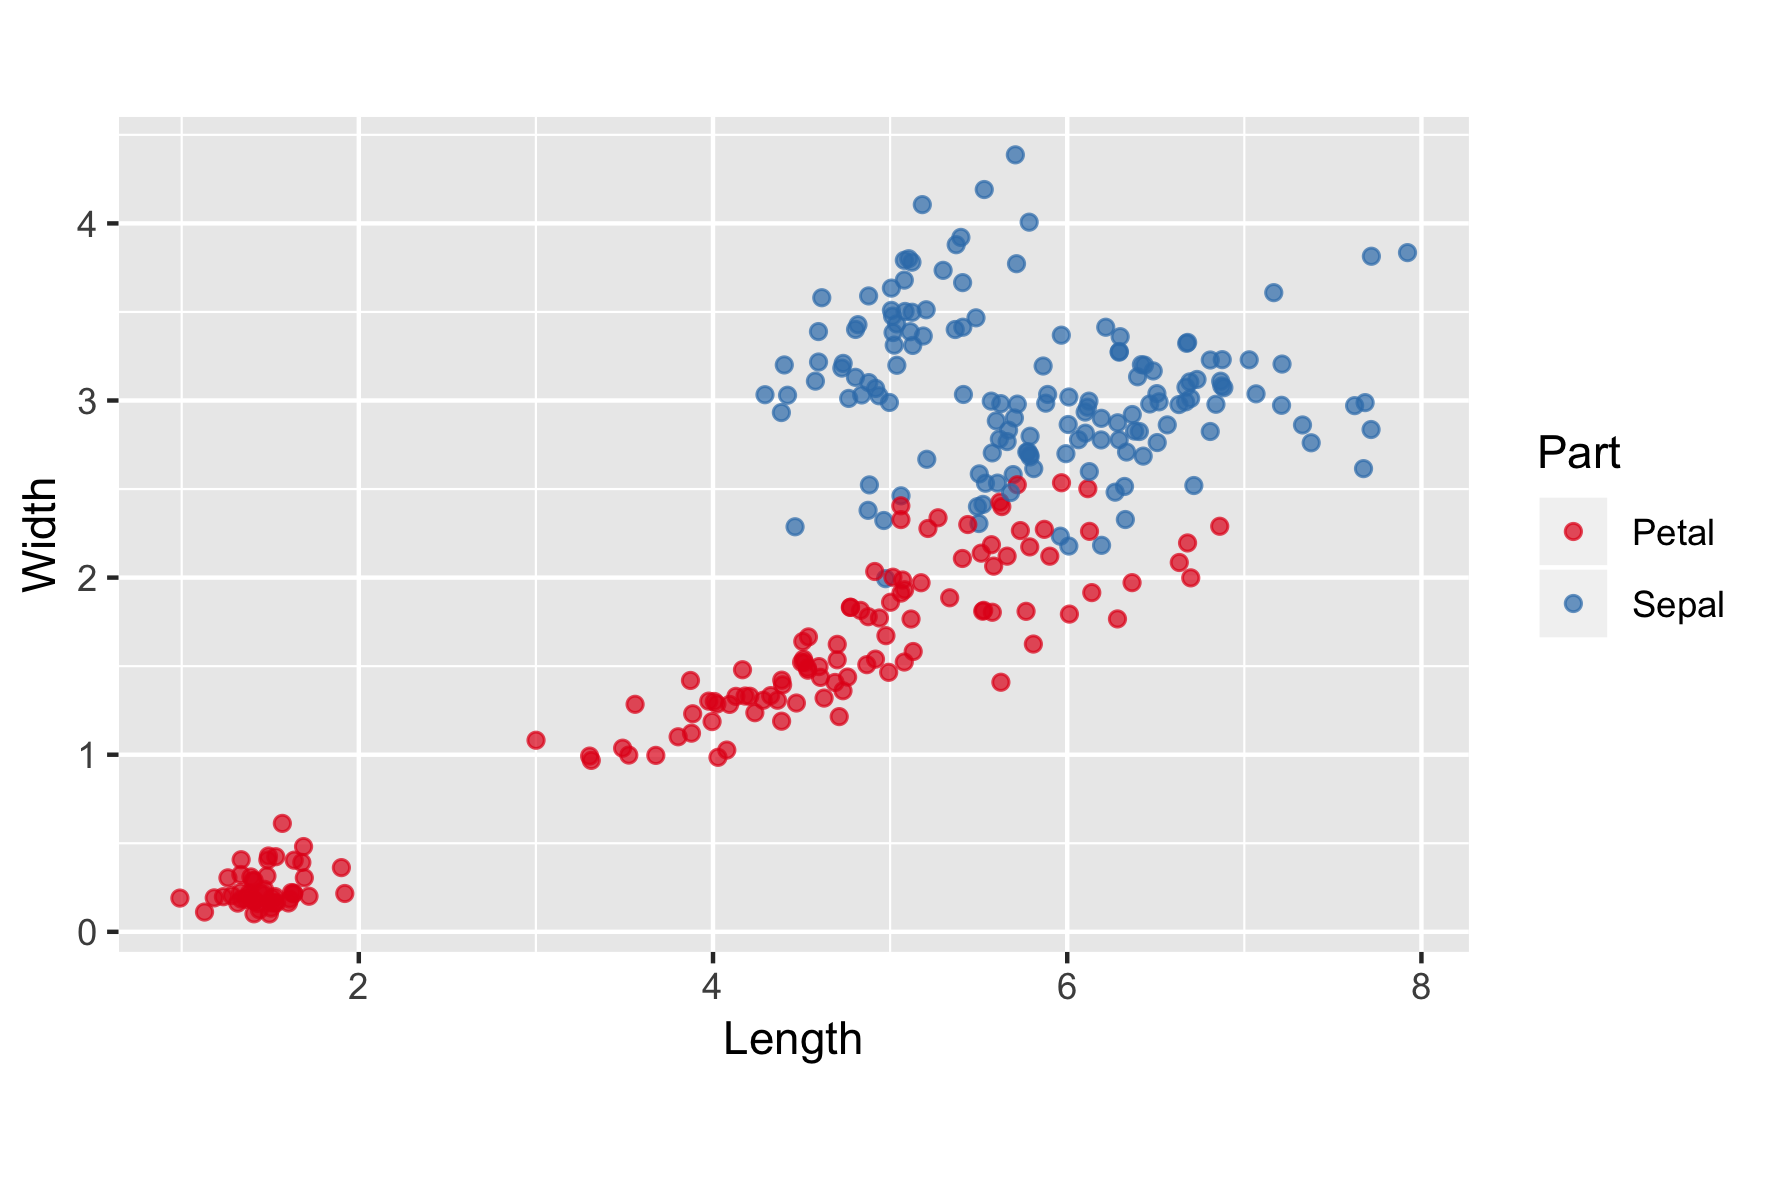
iris.wide

p <- ggplot(iris.wide, aes(x = Length, 
                           y = Width, 
                           ccolorol = Part)) +
  geom_jitter(alpha = 0.7) +
  scale_color_brewer(palette = "Set1") +
  coord_fixed()

p

Intermediate Data Visualization with ggplot2

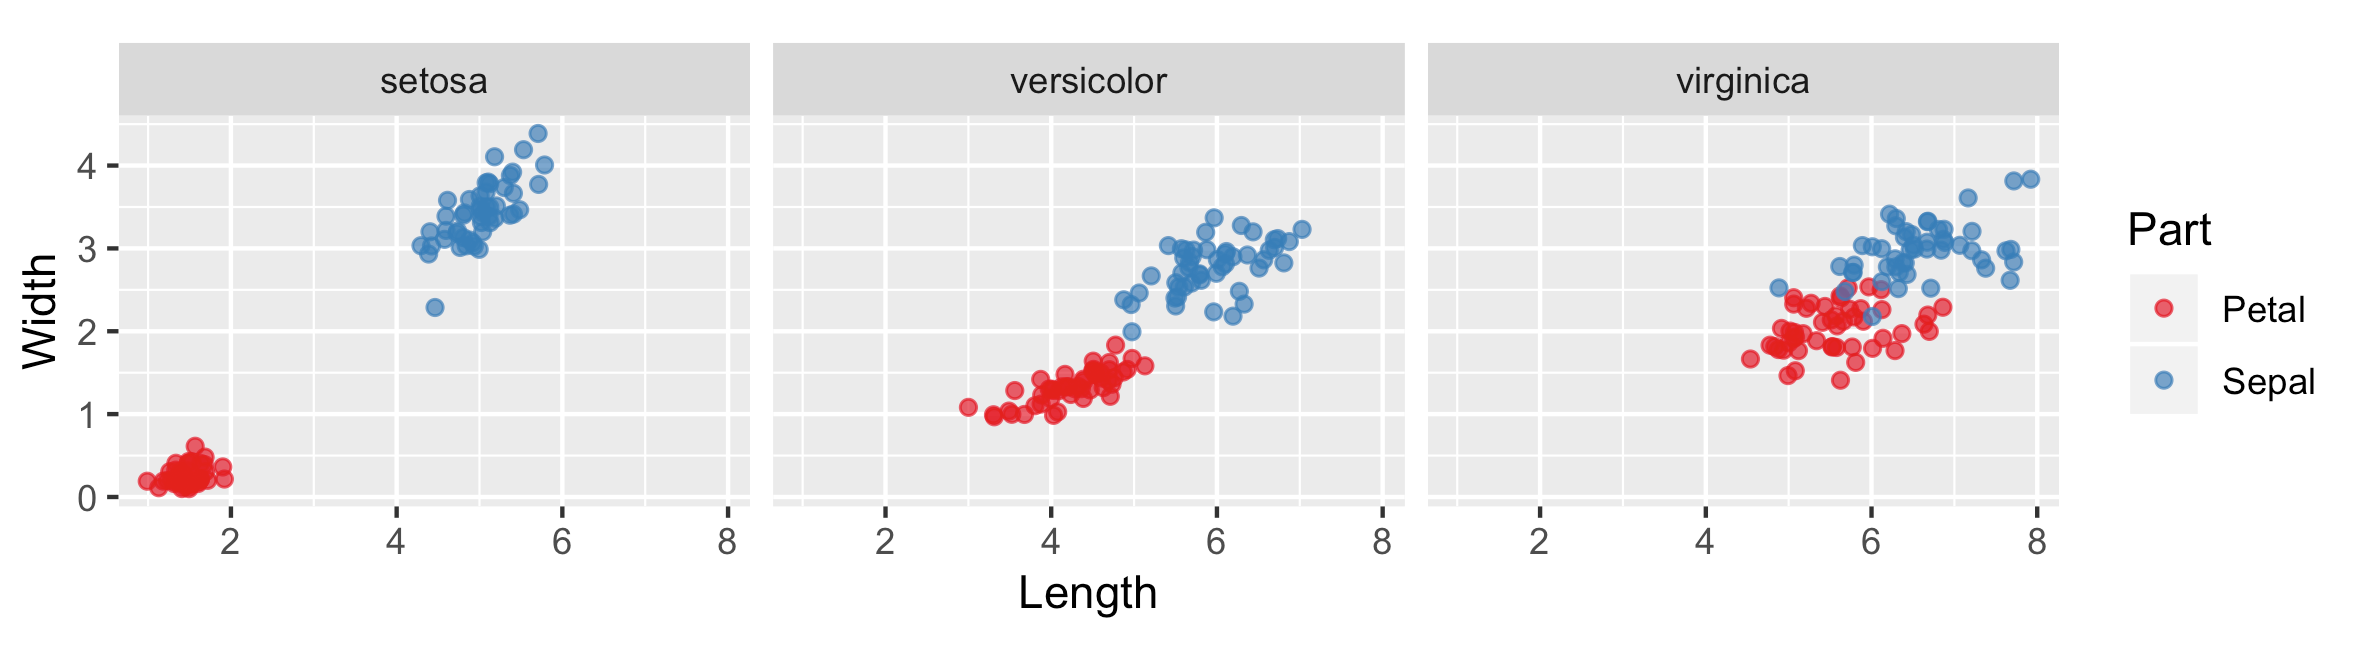
iris.wide & facet_grid()

p <- ggplot(iris.wide, aes(x = Length, y = Width, color = Part)) +
  geom_jitter(alpha = 0.7) +
  scale_color_brewer(palette = "Set1") +
  coord_fixed()
p + facet_grid(cols = vars(Species))
Intermediate Data Visualization with ggplot2

Zápisová forma vzorce

p <- ggplot(iris.wide, aes(x = Length, y = Width, color = Part)) +
  geom_jitter(alpha = 0.7) +
  scale_color_brewer(palette = "Set1") +
  coord_fixed()
p + facet_grid(. ~ Species)

Intermediate Data Visualization with ggplot2

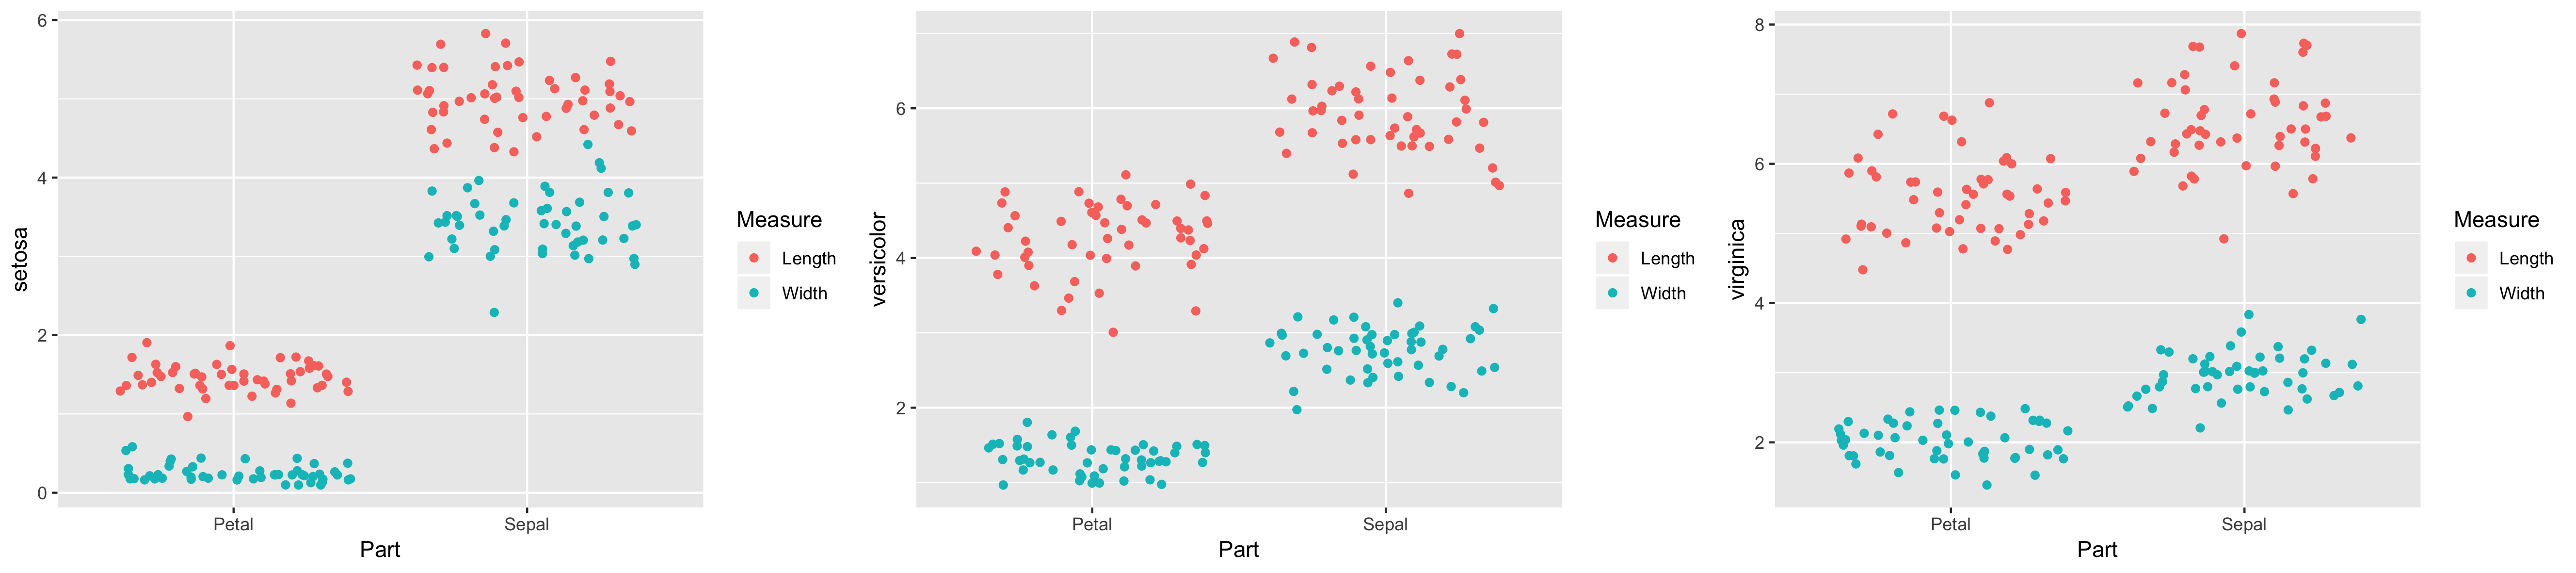
iris.wide2

ggplot(iris.wide2, aes(x = Part, y = setosa, color = Measure)) +
  geom_jitter()
ggplot(iris.wide2, aes(x = Part, y = versicolor, color = Measure)) +
  geom_jitter()  
ggplot(iris.wide2, aes(x = Part, y = virginica, color = Measure)) +
  geom_jitter()

Intermediate Data Visualization with ggplot2

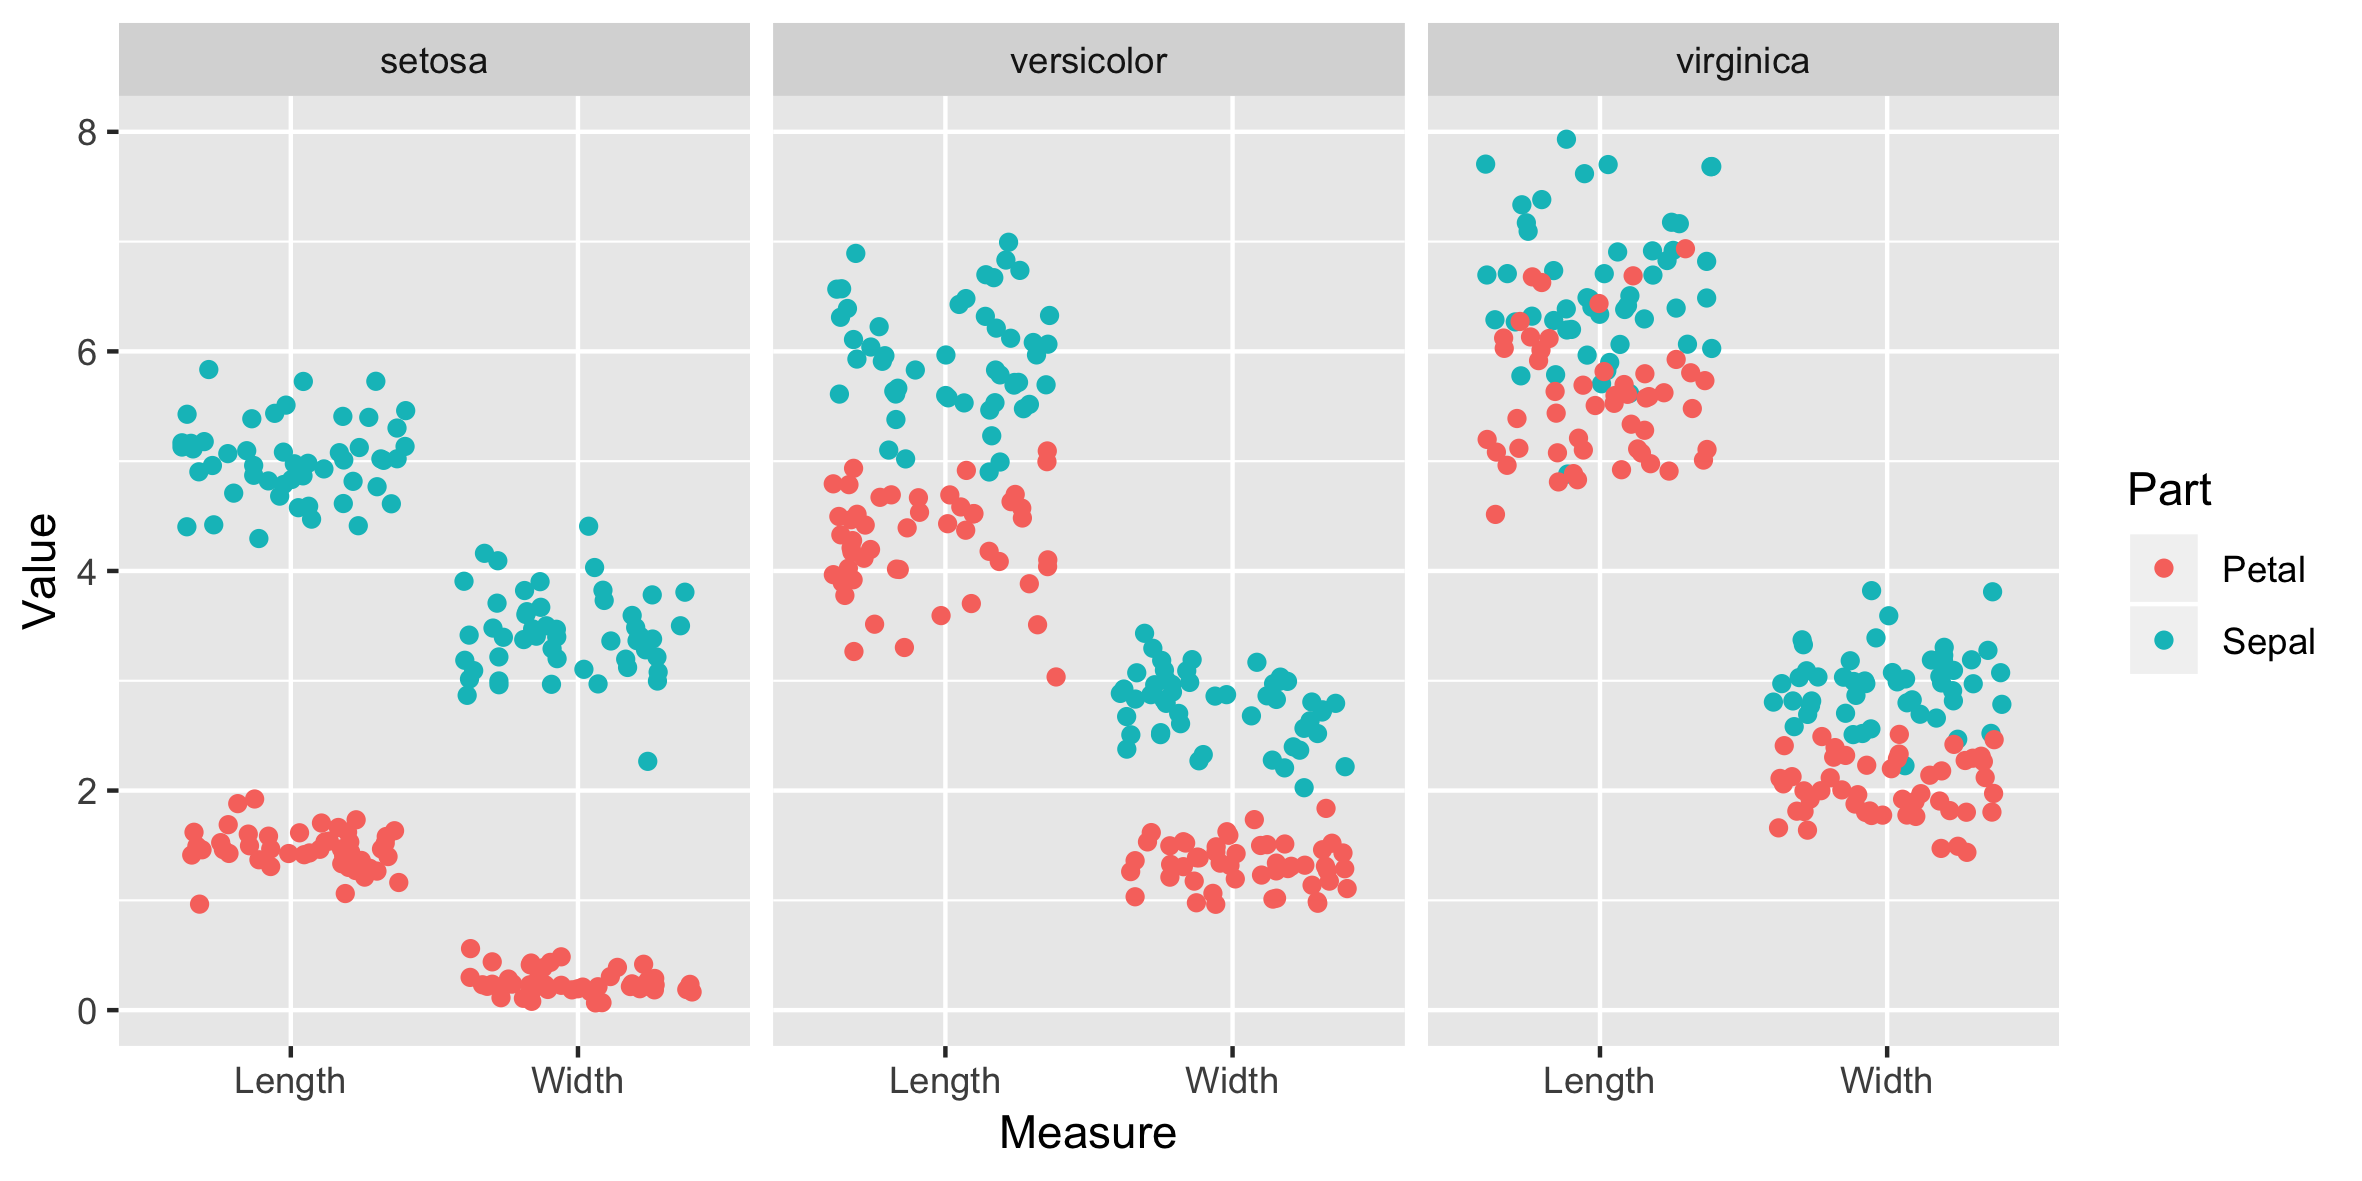
iris.tidy

ggplot(iris.tidy, aes(x = Measure, y = Value, color = Part)) +
  geom_jitter() +
  facet_grid(cols = vars(Species))
Intermediate Data Visualization with ggplot2

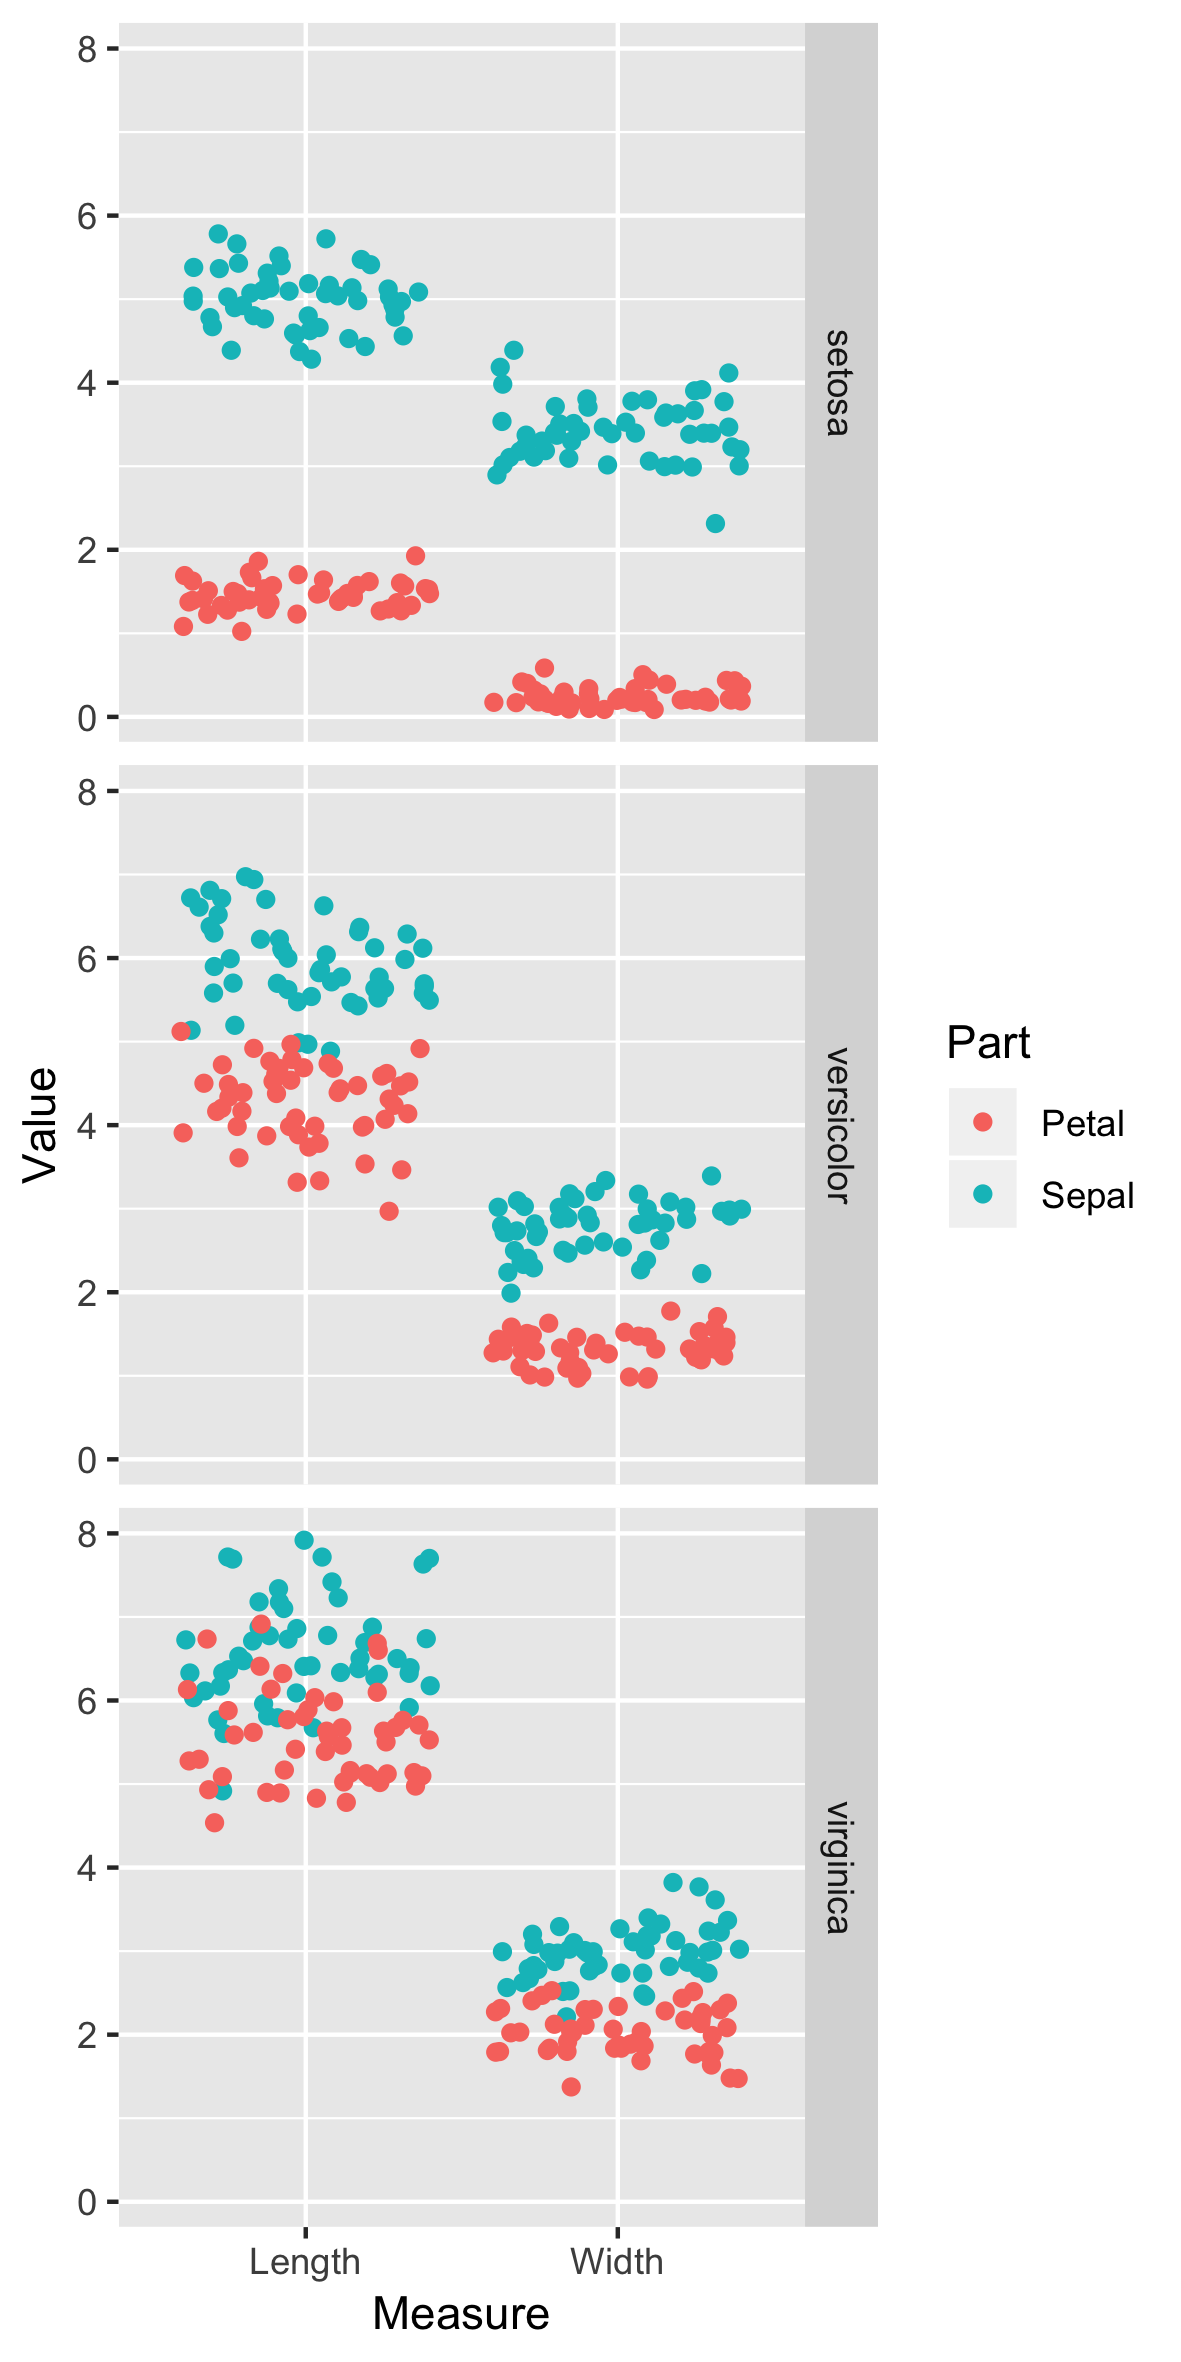
Nesprávné fasetování iris.tidy:

ggplot(iris.tidy, aes(x = Measure, 
                      y = Value, 
                      color = Part)) +
  geom_jitter() +
  facet_grid(rows = vars(Species))

Intermediate Data Visualization with ggplot2

Další možnosti

  • Rozdělení podle řádků a sloupců
Intermediate Data Visualization with ggplot2

Pojďme procvičovat!

Intermediate Data Visualization with ggplot2

Preparing Video For Download...