Shrnutí a opakování

Unsupervised Learning in R

Hank Roark

Senior Data Scientist at Boeing

Shrnutí případové studie

  • Celý proces analýzy dat pomocí učení bez učitele
  • Kreativní přístup k modelování
  • Připraveni řešit problémy z praxe
Unsupervised Learning in R

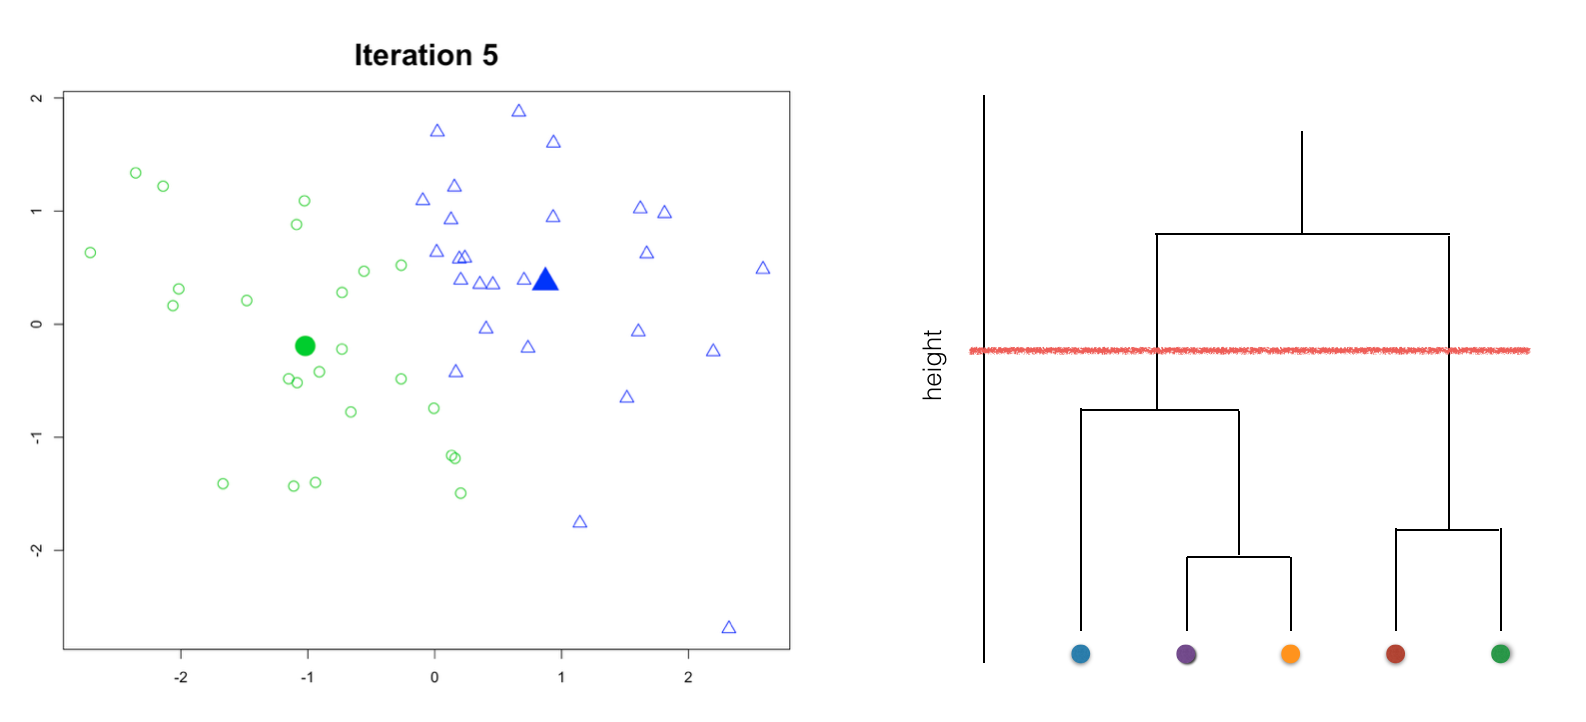
Typy shlukování

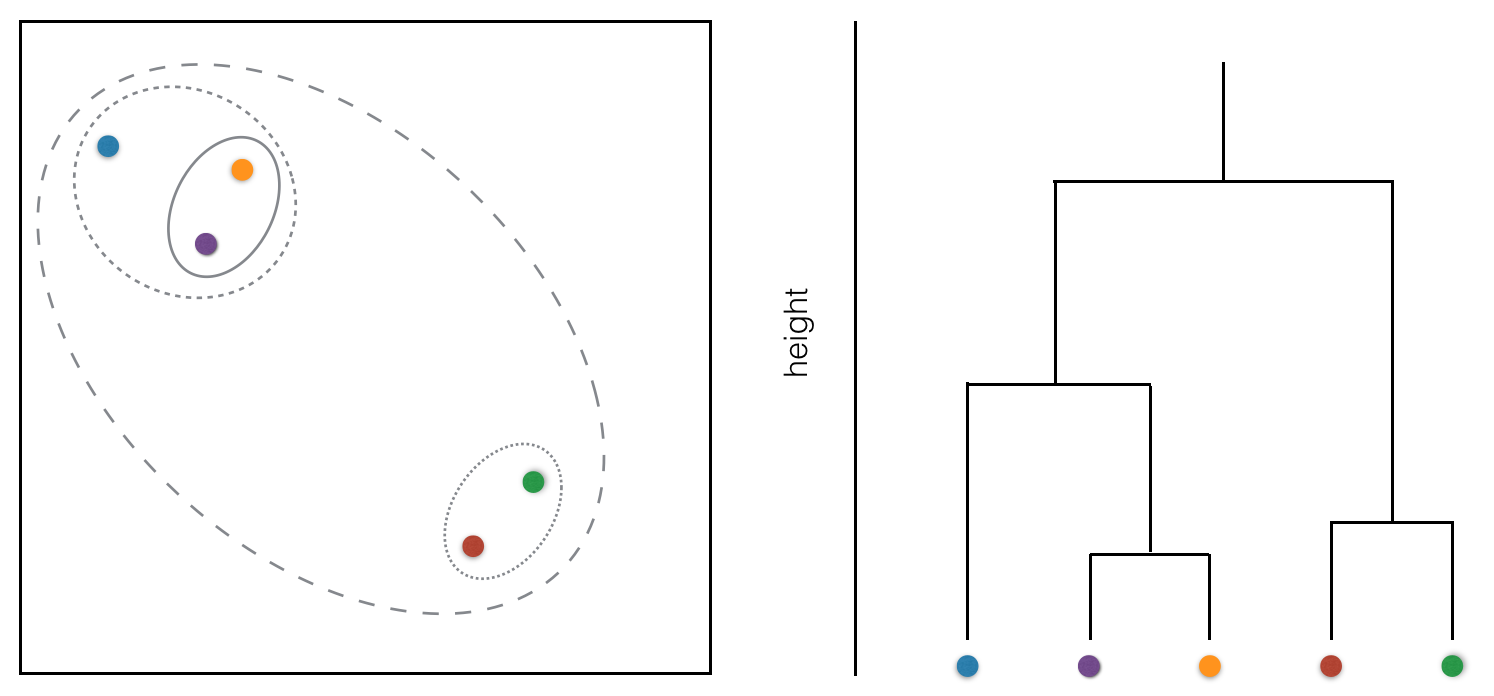
k-means vs. dendrogram

Unsupervised Learning in R

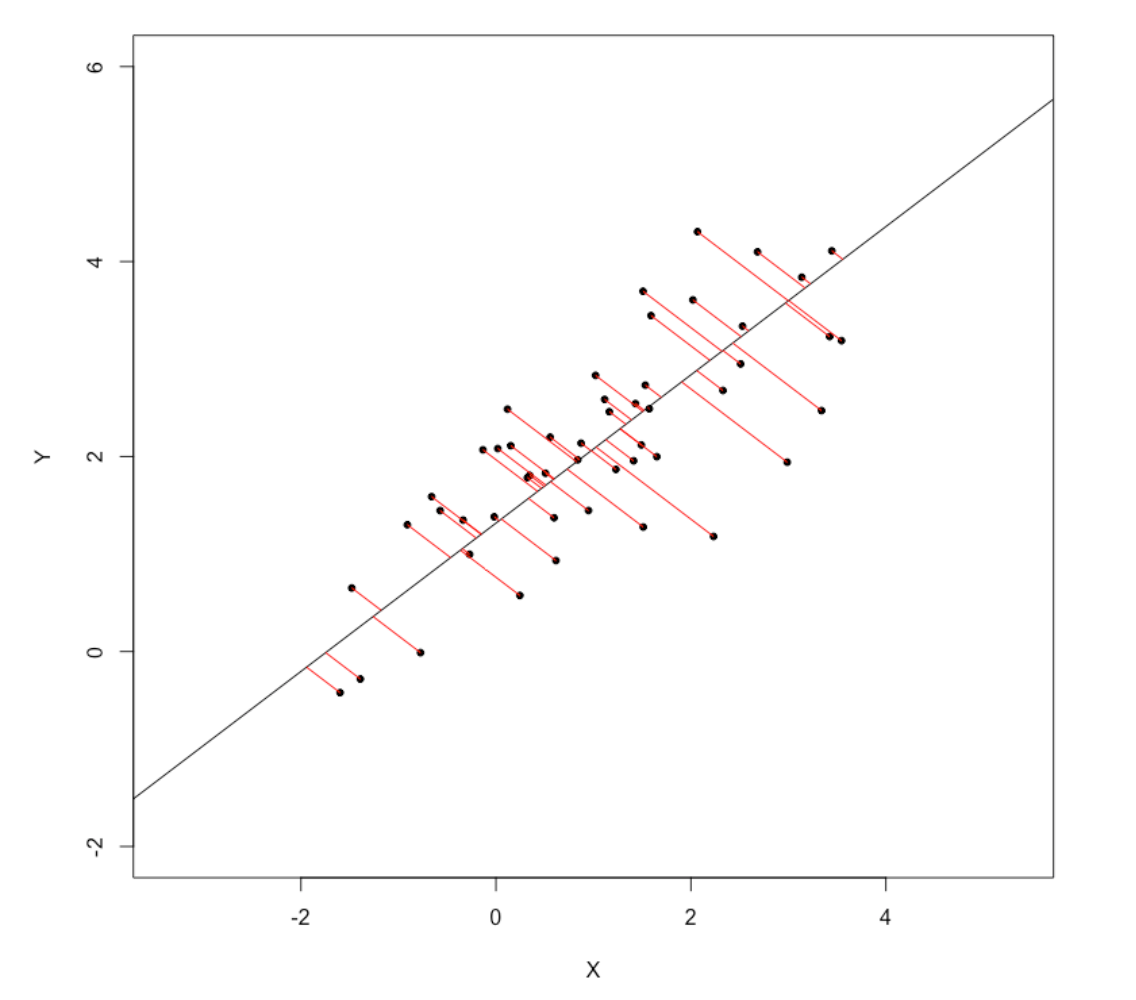
Redukce dimenzionality

projekce PCA

Unsupervised Learning in R

Výběr modelu

# Initialize total within sum of squares error: wss
wss <- 0

# Look over 1 to 15 possible clusters
for (i in 1:15) {
  # Fit the model: km.out
  km.out <- kmeans(pokemon, centers = i, nstart = 20, iter.max = 50)
  # Save the within cluster sum of squares
  wss[i] <- km.out$tot.withinss
}

# Produce a scree plot
plot(1:15, wss, type = "b", 
     xlab = "Number of Clusters", 
     ylab = "Within groups sum of squares")
Unsupervised Learning in R

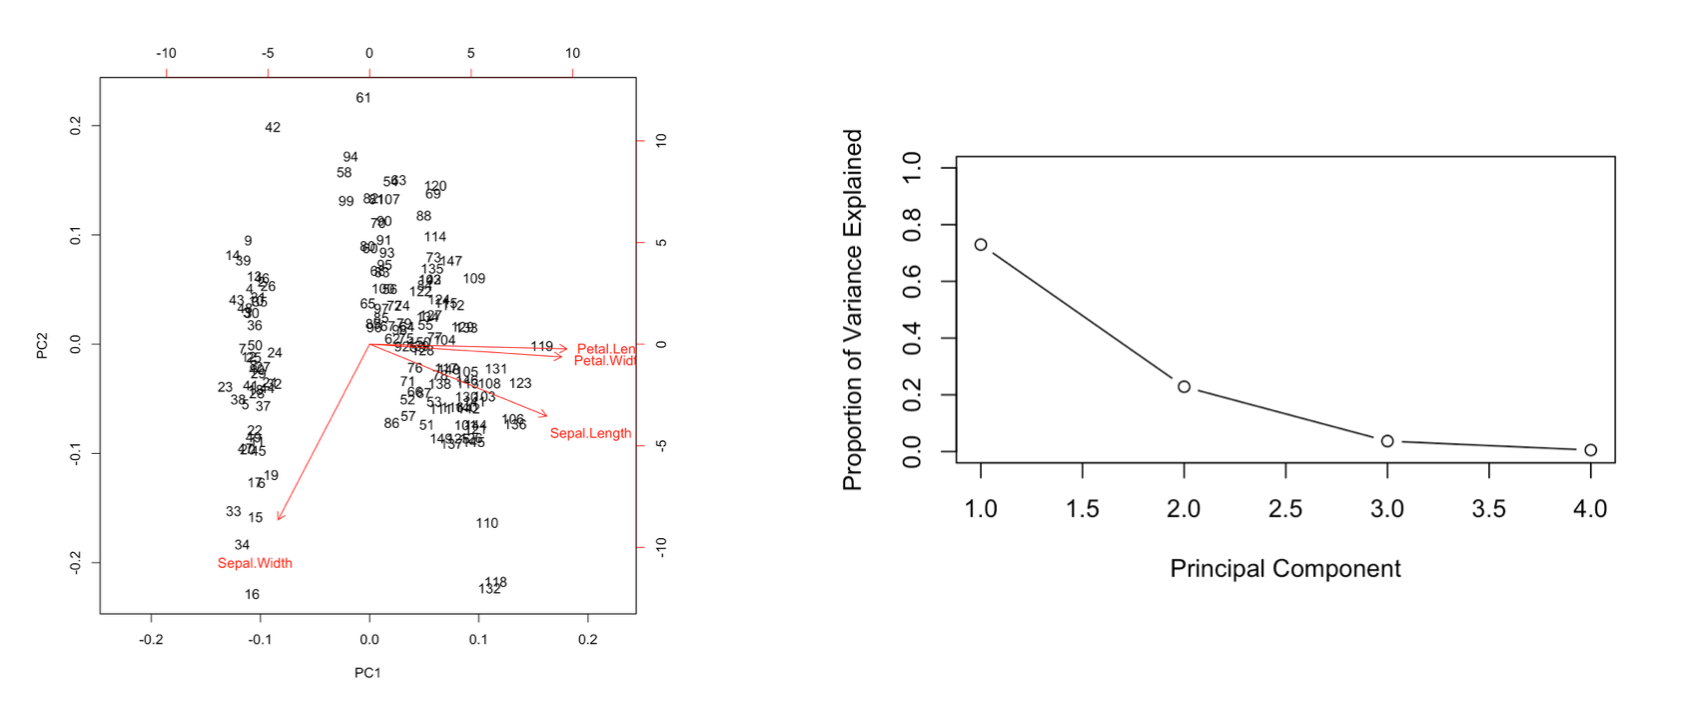
Interpretace výsledků PCA

biplot a screeplot

Unsupervised Learning in R

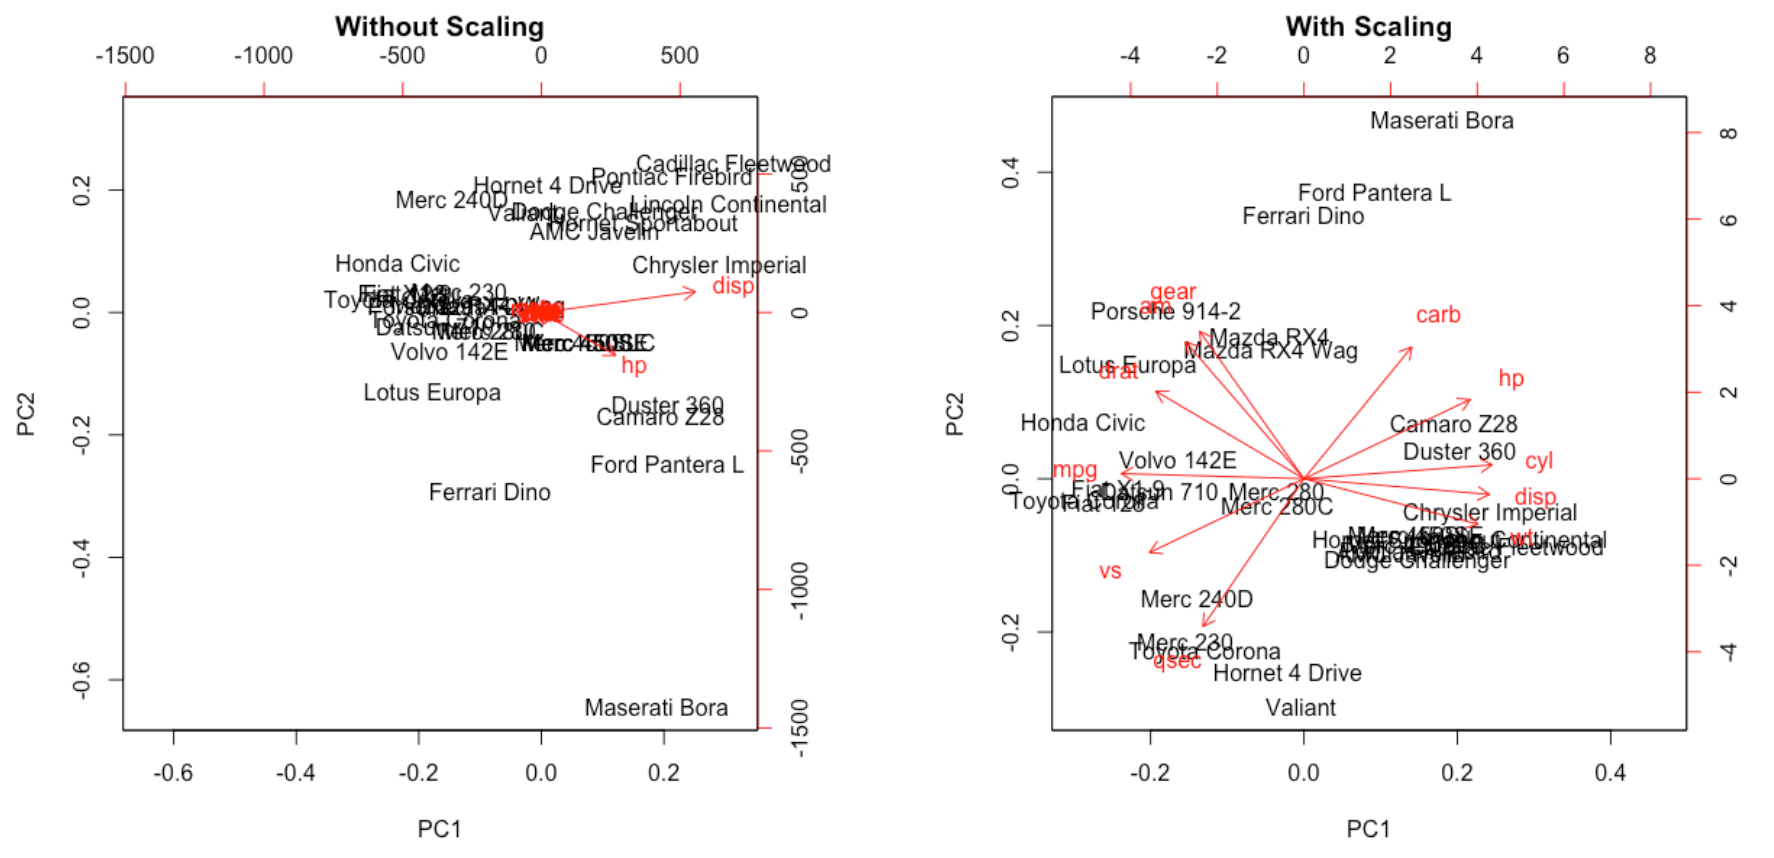
Důležitost škálování dat

porovnání důležitosti příznaků se škálováním a bez něj

Unsupervised Learning in R

Opakování kurzu

pr.iris <- prcomp(x = iris[-5],
                  scale = FALSE,
                  center = TRUE)
summary(pr.iris)
Importance of components:
                          PC1     PC2    PC3     PC4
Standard deviation     2.0563 0.49262 0.2797 0.15439
Proportion of Variance 0.9246 0.05307 0.0171 0.00521
Cumulative Proportion  0.9246 0.97769 0.9948 1.00000
Unsupervised Learning in R

Dendrogram

dendrogram

Unsupervised Learning in R

Silné a slabé stránky každého algoritmu
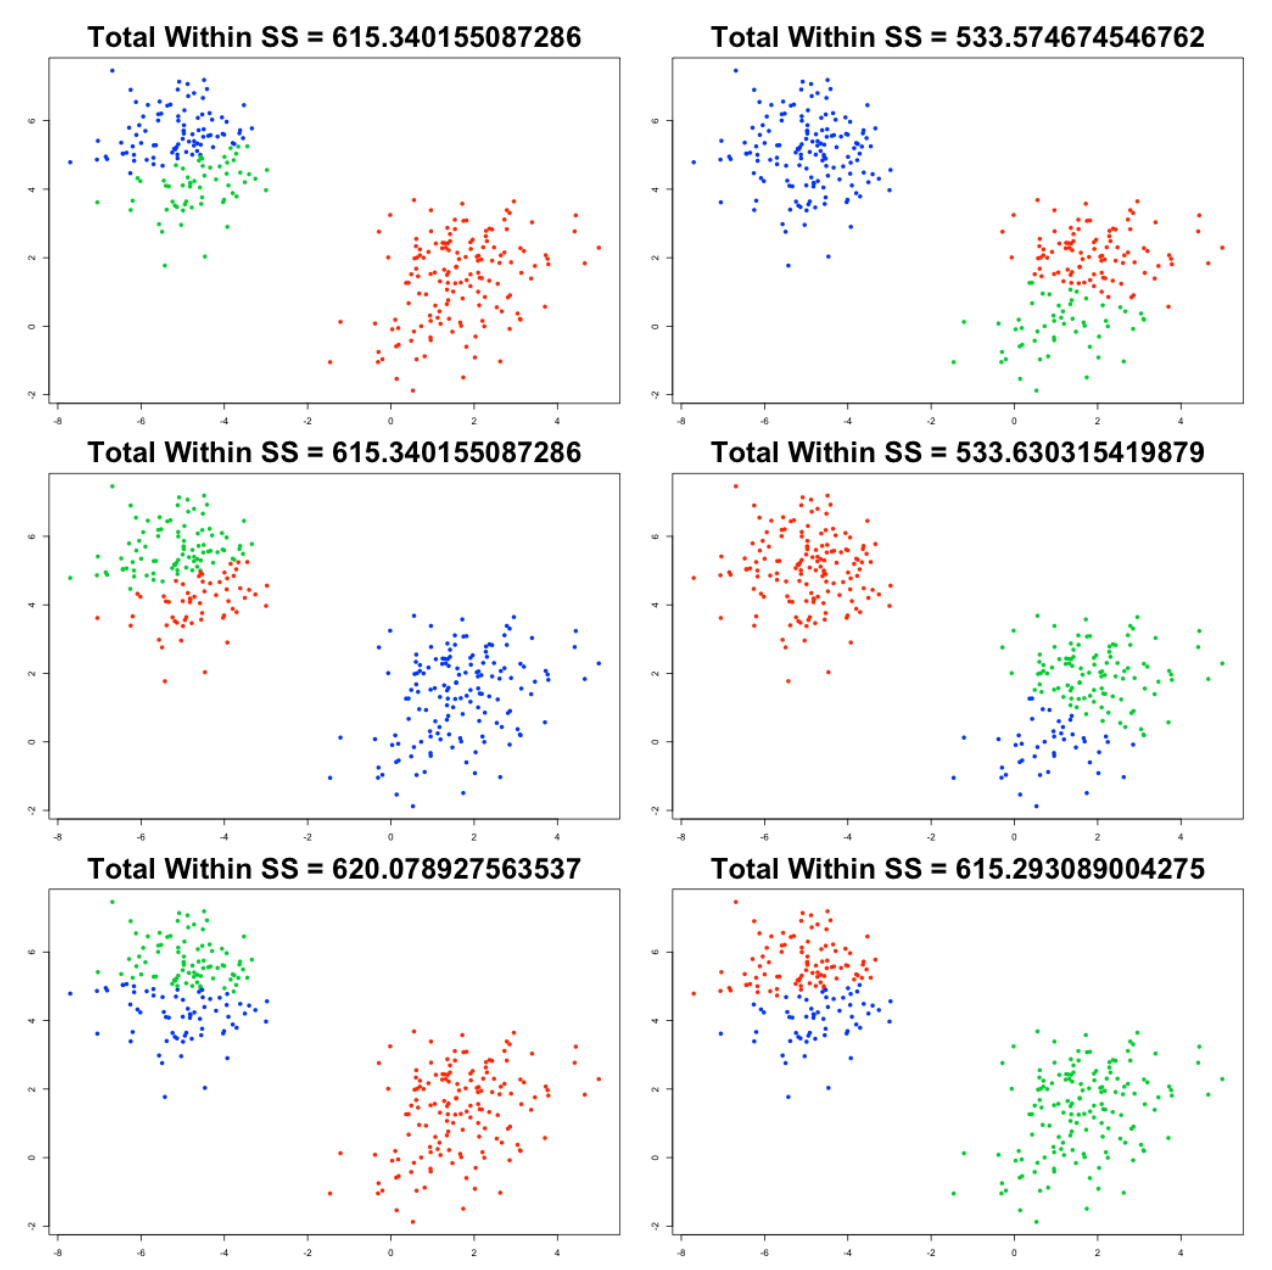
různé výsledky shlukování

Unsupervised Learning in R

Opakování kurzu

# Repeat for components 1 and 3
plot(wisc.pr$x[, c(1, 3)], col = (diagnosis + 1), 
     xlab = "PC1", ylab = "PC3")
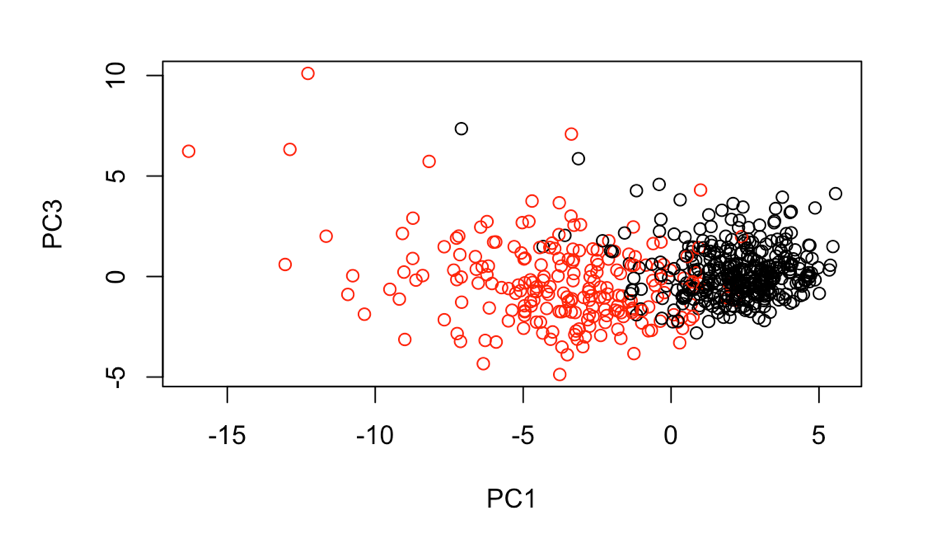
hlavní komponenty

Unsupervised Learning in R

Procvičte své dovednosti!

Unsupervised Learning in R

Preparing Video For Download...