Více než dvě vysvětlující proměnné

Intermediate Regression with statsmodels in Python

Maarten Van den Broeck

Content Developer at DataCamp

Z minulé lekce
sns.scatterplot(x="length_cm", 
                y="height_cm",
                data=fish,
                hue="mass_g")

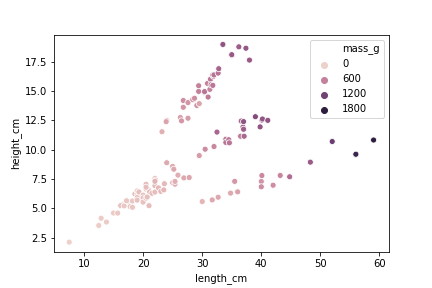
2D bodový graf s hmotností vyznačenou barvou pro vizualizaci třetí číselné proměnné.

Intermediate Regression with statsmodels in Python

Facetování podle druhu

grid = sns.FacetGrid(data=fish,

col="species",
hue="mass_g", col_wrap=2,
palette="plasma")
grid.map(sns.scatterplot,
         "length_cm",
         "height_cm")
plt.show()

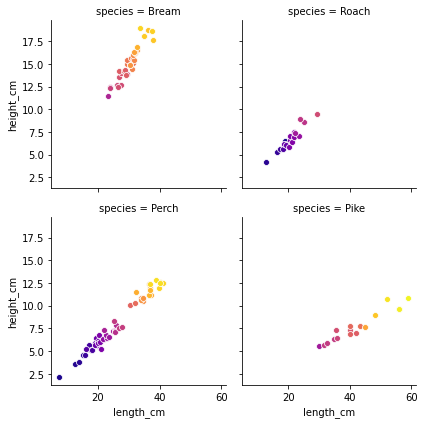
Bodový graf výšky, délky a hmotnosti ryb rozdělený podle druhu. Světlejší barva znamená těžší rybu.

Intermediate Regression with statsmodels in Python

Facetování podle druhu

  • Facetovat lze pomocí více než jedné kategorické proměnné
  • Pozor na nadměrné použití facetování
  • S rostoucím počtem proměnných se vizualizace komplikuje

Bodový graf výšky, délky a hmotnosti ryb rozdělený podle druhu. Světlejší barva znamená těžší rybu.

Intermediate Regression with statsmodels in Python

Různé úrovně interakcí

Bez interakcí

ols("mass_g ~ length_cm + height_cm + species + 0", data=fish).fit()

dvoučetné interakce mezi páry proměnných

ols(
  "mass_g ~ length_cm + height_cm + species +
  length_cm:height_cm + length_cm:species + height_cm:species + 0", data=fish).fit()

troj četná interakce mezi všemi třemi proměnnými

ols(
  "mass_g ~ length_cm + height_cm + species + 
  length_cm:height_cm + length_cm:species + height_cm:species + length_cm:height_cm:species + 0", data=fish).fit()
Intermediate Regression with statsmodels in Python

Všechny interakce

ols(
  "mass_g ~ length_cm + height_cm + species + 
  length_cm:height_cm + length_cm:species + height_cm:species + length_cm:height_cm:species + 0", 
  data=fish).fit()

stejné jako

ols(
  "mass_g ~ length_cm * height_cm * species + 0", 
  data=fish).fit()
Intermediate Regression with statsmodels in Python

Pouze dvojčetné interakce

ols(
  "mass_g ~ length_cm + height_cm + species + 
  length_cm:height_cm + length_cm:species + height_cm:species + 0", 
  data=fish).fit()

stejné jako

ols(
  "mass_g ~ (length_cm + height_cm + species) ** 2 + 0", 
  data=fish).fit()
Intermediate Regression with statsmodels in Python

Postup předpovídání

mdl_mass_vs_all = ols(
  "mass_g ~ length_cm * height_cm * species + 0",
  data=fish).fit()

length_cm = np.arange(5, 61, 5)
height_cm = np.arange(2, 21, 2)
species = fish["species"].unique()

p = product(length_cm, height_cm, species)

explanatory_data = pd.DataFrame(p,
                                columns=["length_cm",
                                         "height_cm",
                                         "species"])

prediction_data = explanatory_data.assign(
  mass_g = mdl_mass_vs_all.predict(explanatory_data))

print(prediction_data)
     length_cm  height_cm species       mass_g
0            5          2   Bream  -570.656437
1            5          2   Roach    31.449145
2            5          2   Perch    43.789984
3            5          2    Pike   271.270093
4            5          4   Bream  -451.127405
..         ...        ...     ...          ...
475         60         18    Pike  2690.346384
476         60         20   Bream  1531.618475
477         60         20   Roach  2621.797668
478         60         20   Perch  3041.931709
479         60         20    Pike  2926.352397

[480 rows x 4 columns]
Intermediate Regression with statsmodels in Python

Pojďme si procvičit!

Intermediate Regression with statsmodels in Python

Preparing Video For Download...