Inferenční metody na základě simulace

Inference for Linear Regression in R

Jo Hardin

Professor, Pomona College
Inference for Linear Regression in R

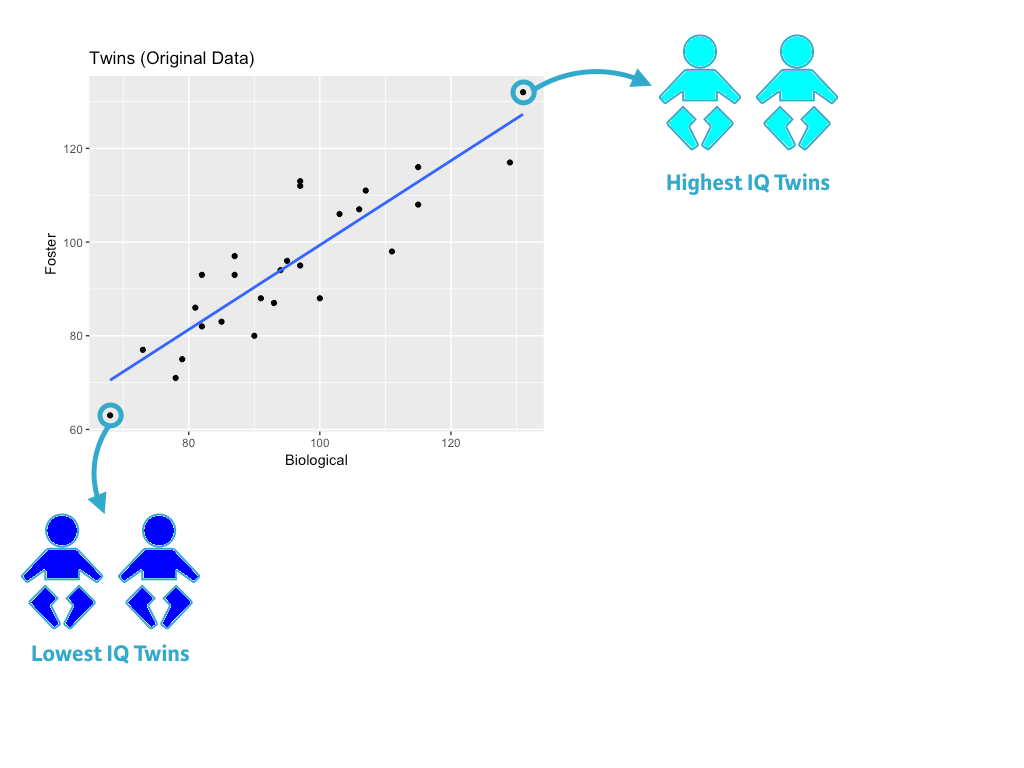
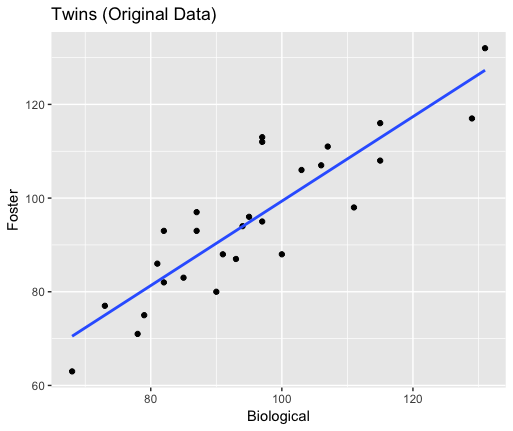
Bodový graf IQ dvojčat.

Inference for Linear Regression in R

Data o dvojčatech

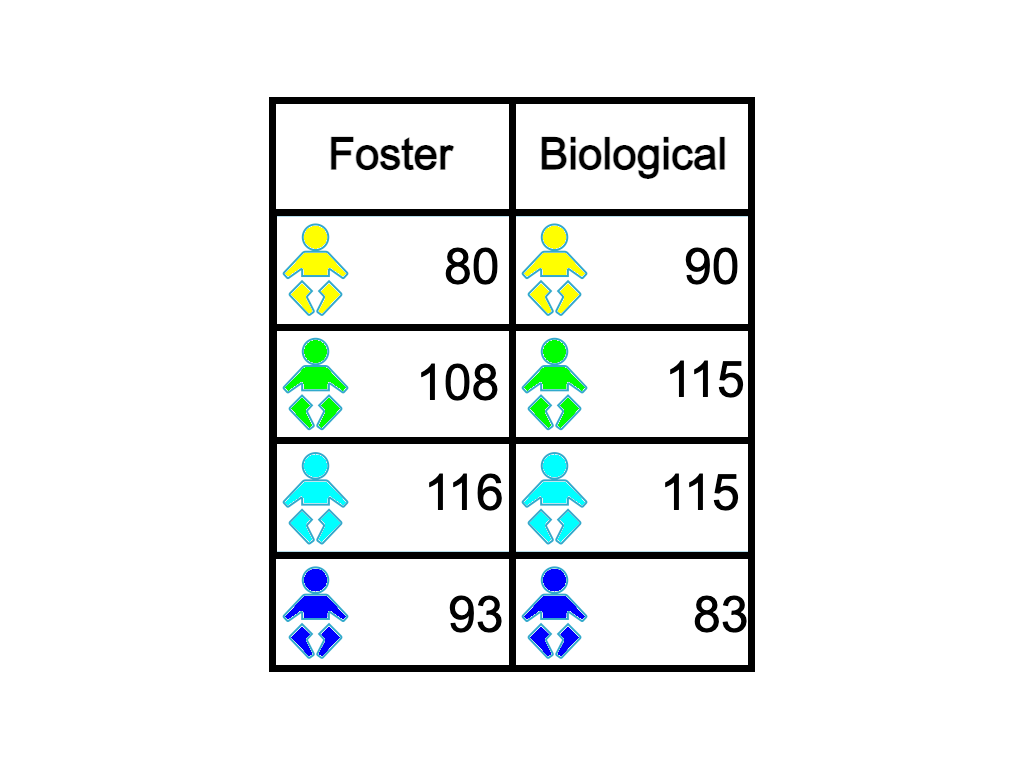
Tabulka IQ dvojčat. Každý řádek odpovídá páru dvojčat. První sloupec obsahuje IQ dvojčete vychovaného pěstouny, druhý sloupec IQ dvojčete vychovaného biologickými rodiči.

Inference for Linear Regression in R

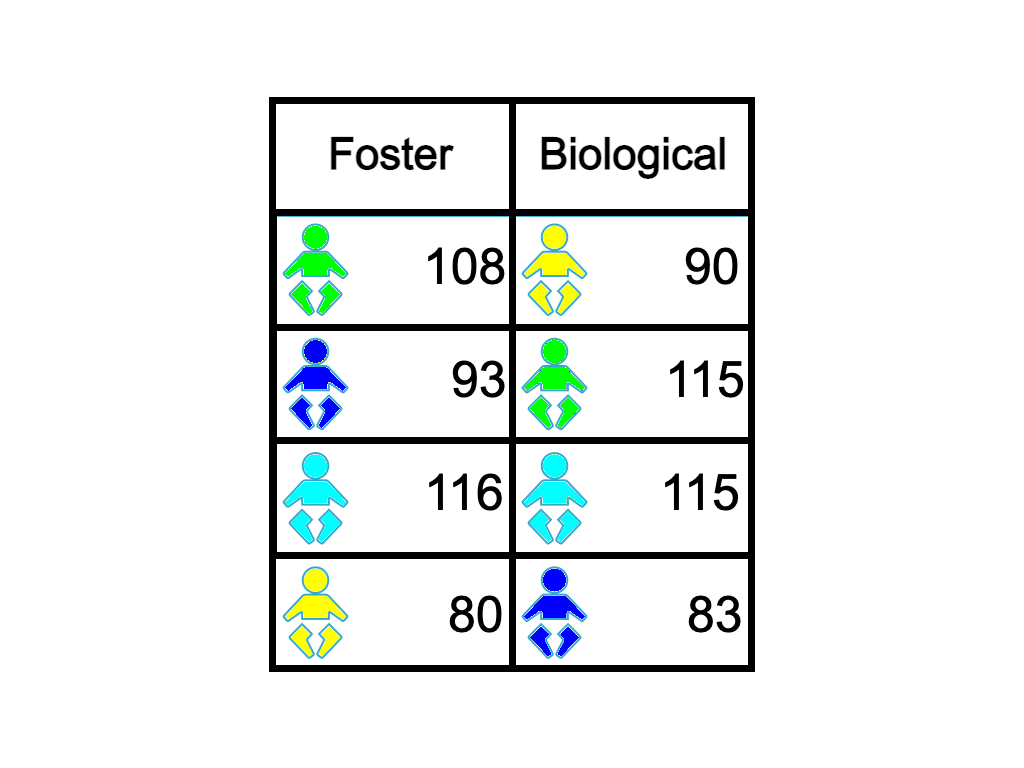
Permutovaná data o dvojčatech

Tabulka IQ dvojčat s permutovanými sloupci – páry dvojčat již nejsou na stejném řádku.

Inference for Linear Regression in R

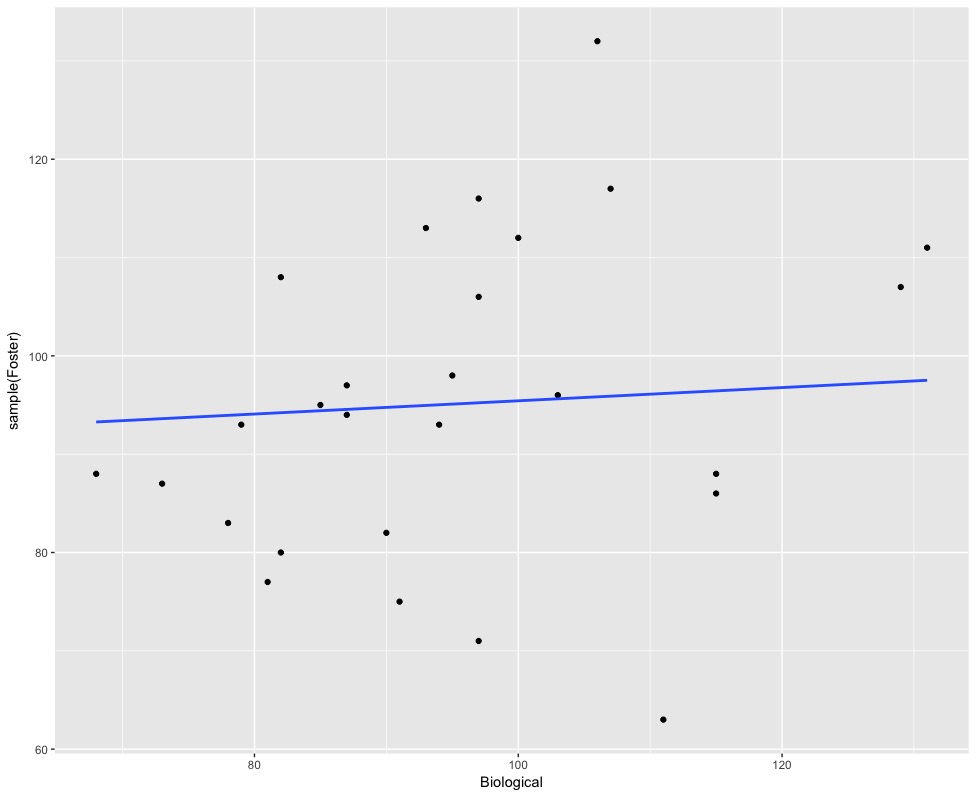
Permutovaná data (1) – graf

Původní data
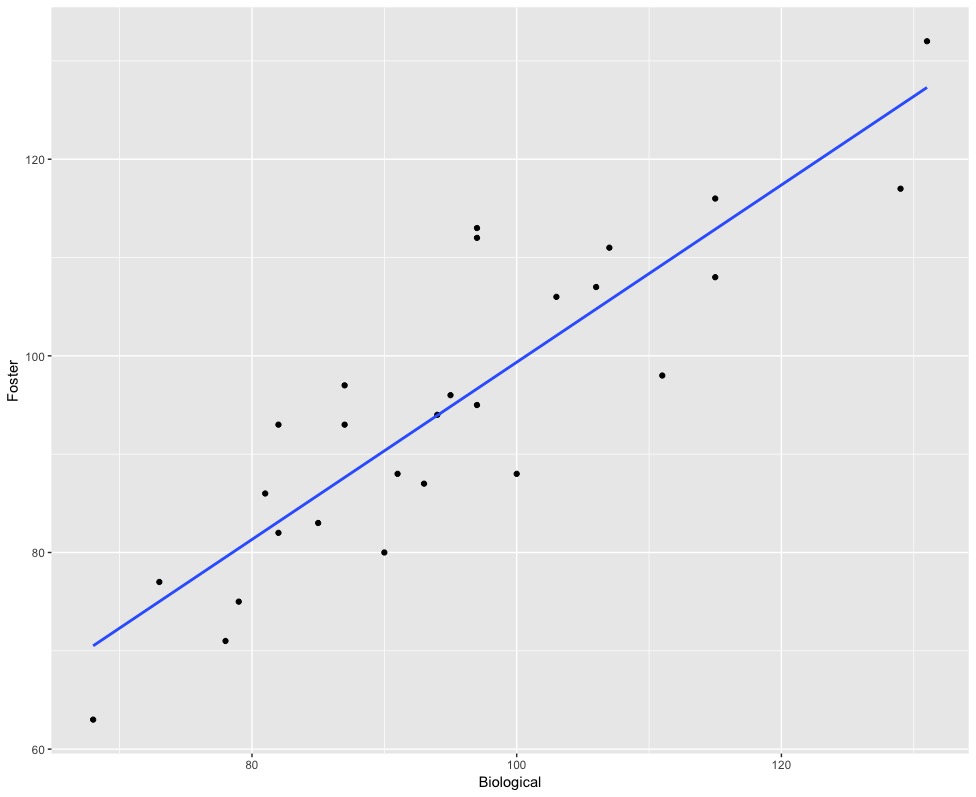
Permutovaná data (1)
Inference for Linear Regression in R

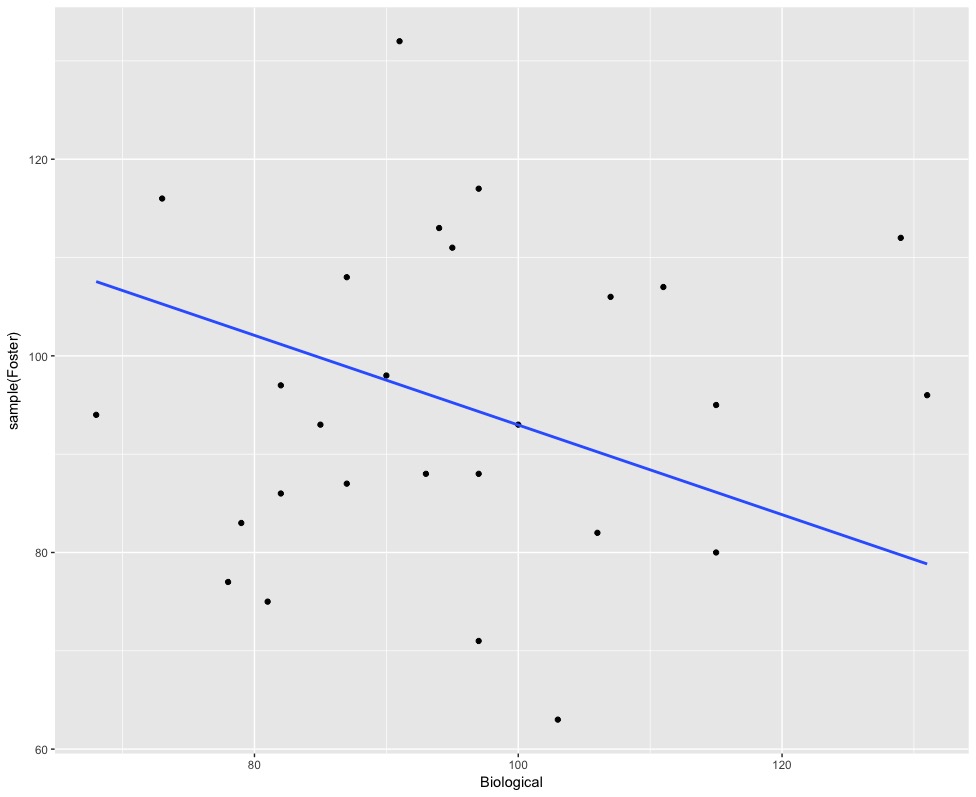
Permutovaná data (2) – graf

Původní data

Permutovaná data (2)
Inference for Linear Regression in R

Permutovaná data (1) a (2)

Permutovaná data (1)

Permutovaná data (2)

Inference for Linear Regression in R
twins %>%
   specify(Foster ~ Biological) %>%
   hypothesize(null = "independence") %>%
   generate(reps = 10, type = "permute") %>%
   calculate(stat = "slope")
A tibble: 10 x 2
   replicate          stat
       <int>         <dbl>
 1         1  0.0007709302
 2         2 -0.0353592305
 3         3 -0.0278627974
 4         4 -0.0072547982
 5         5 -0.1252761541
 6         6 -0.1669869287
 7         7 -0.2610519170
 8         8 -0.0157695494
 9         9  0.0581361900
10        10  0.1598471947
Inference for Linear Regression in R

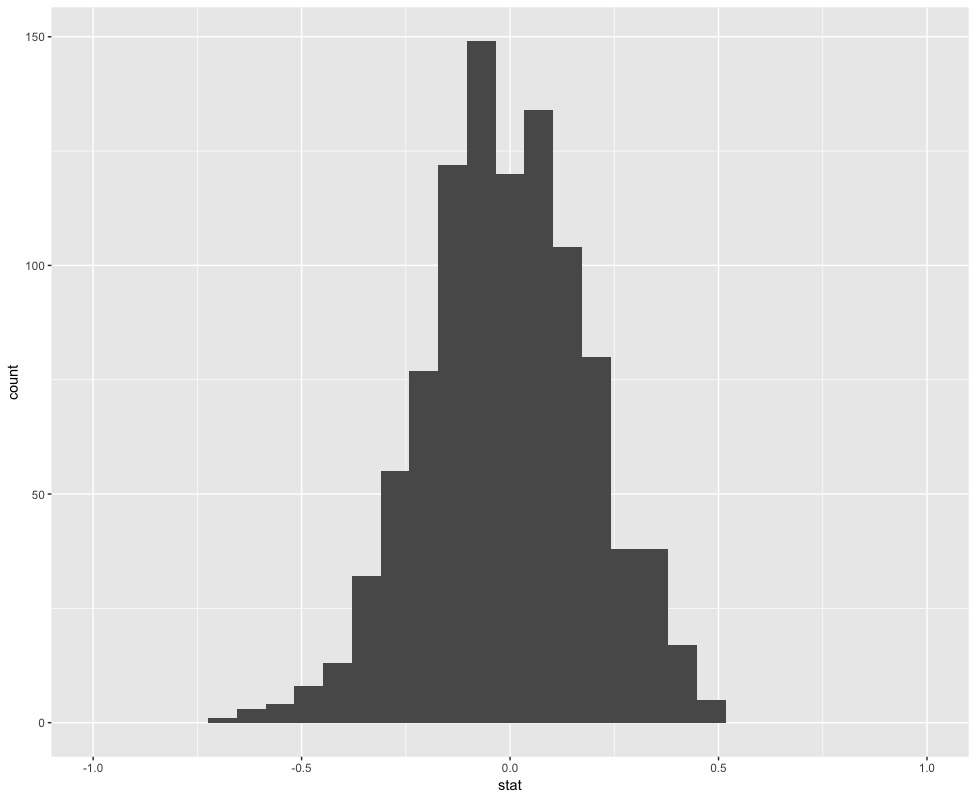
Mnoho permutovaných sklonů

perm_slope <- twins %>%
   specify(Foster ~ Biological) %>%
   hypothesize(
     null = "independence"
     ) %>%
   generate(reps = 1000, 
            type = "permute") %>%
   calculate(stat = "slope") 

ggplot(data = perm_slope, aes(x = stat)) + 
   geom_histogram() +
   xlim(-1,1)

Inference for Linear Regression in R

Permutované sklony s pozorovaným sklonem (červeně)
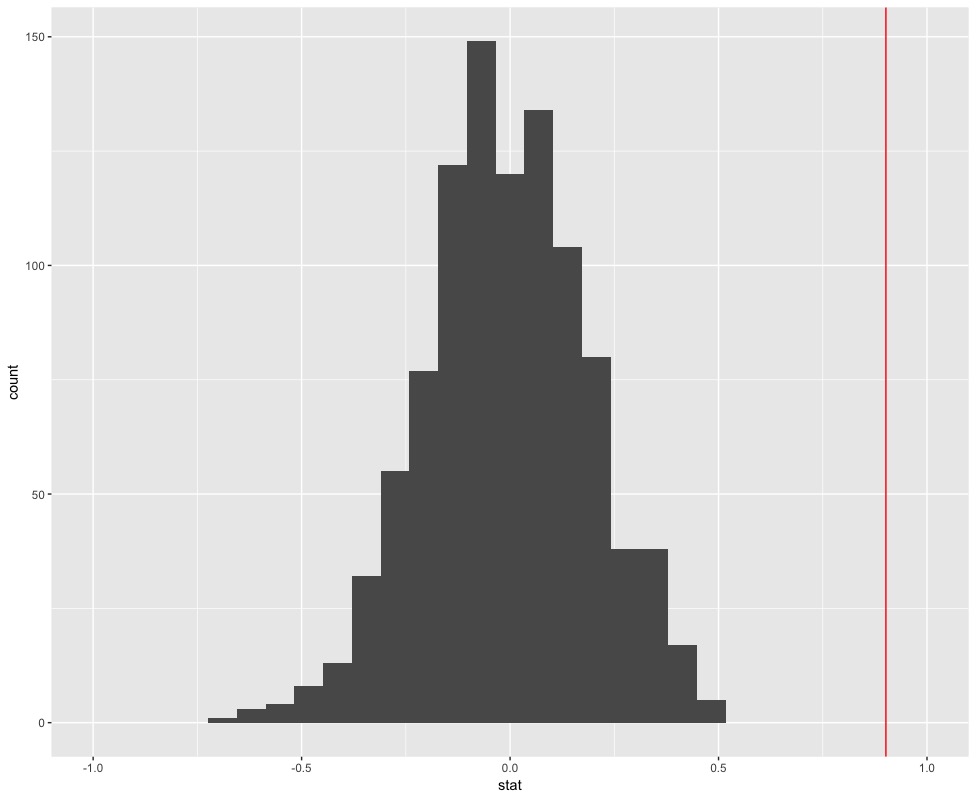
obs_slope <- lm(Foster ~ Biological,
                data = twins) %>%
   tidy() %>%   
   filter(term == "Biological") %>%
   select(estimate) %>%   
   pull()
obs_slope
0.901436
ggplot(data = perm_slope, aes(x = stat)) + 
   geom_histogram() +
   geom_vline(xintercept = obs_slope, color = "red") 
   + xlim(-1,1)

Inference for Linear Regression in R

Pojďme si procvičit!

Inference for Linear Regression in R

Preparing Video For Download...