Interpretace hustoty jádra, krabicových grafů a radarových grafů

Sentiment Analysis in R

Ted Kwartler

Data Dude

Další vizualizace

  • Graf hustoty jádra
  • Krabicový graf
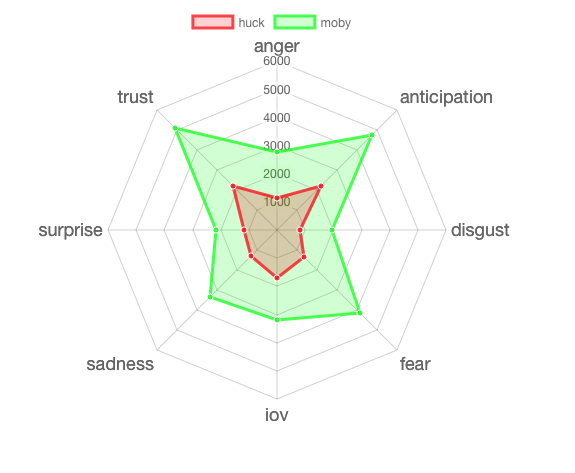
  • Radarový graf
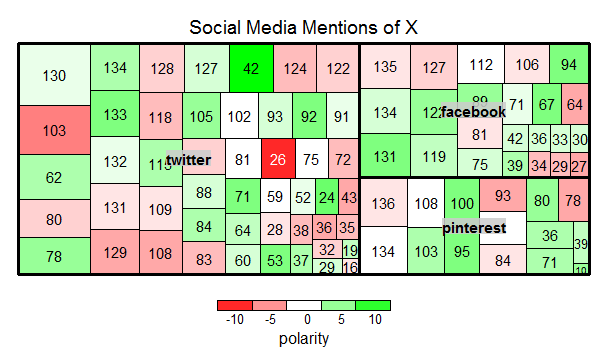
  • Stromová mapa
Sentiment Analysis in R

Graf hustoty jádra vs. histogram

dist <- rnorm(100, 
              mean = 0, 
              sd = 1)
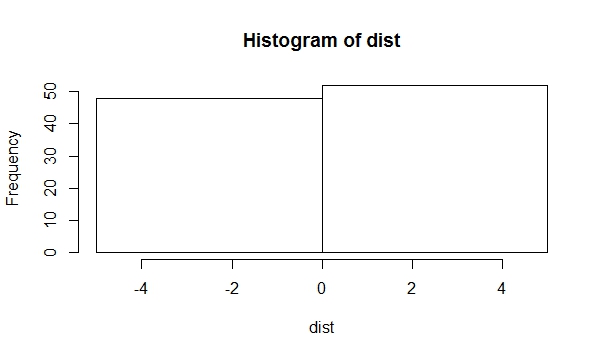
hist(dist, breaks = 1)

hist 1

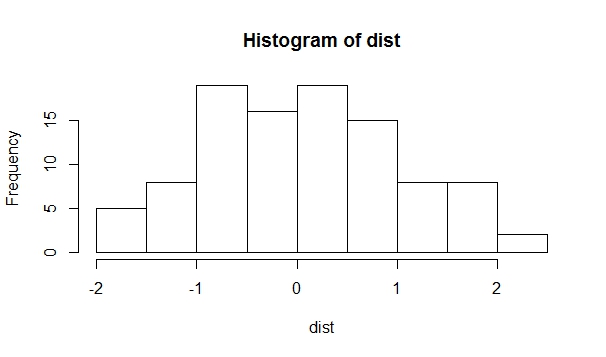
hist(dist, breaks = 10)

hist10

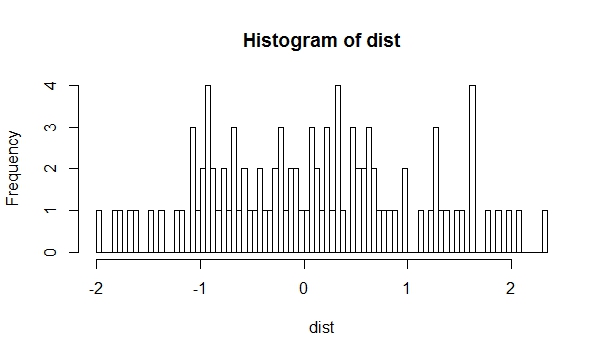
hist(dist, breaks = 100)

hist100

Sentiment Analysis in R

Graf hustoty jádra vs. histogram

dist <- rnorm(100, 
              mean = 0, 
              sd = 1)
hist(dist, breaks = 10)

hist10

d_curve <- density(dist) 
plot(d_curve)
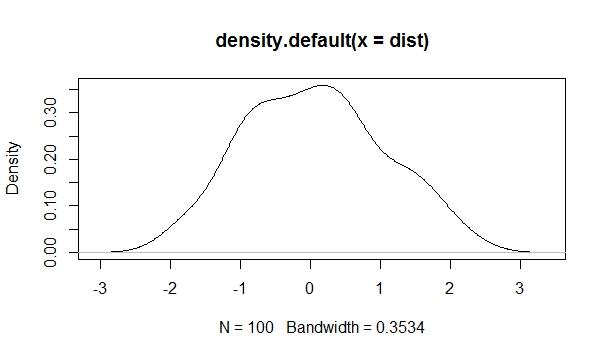
křivka hustoty

Sentiment Analysis in R

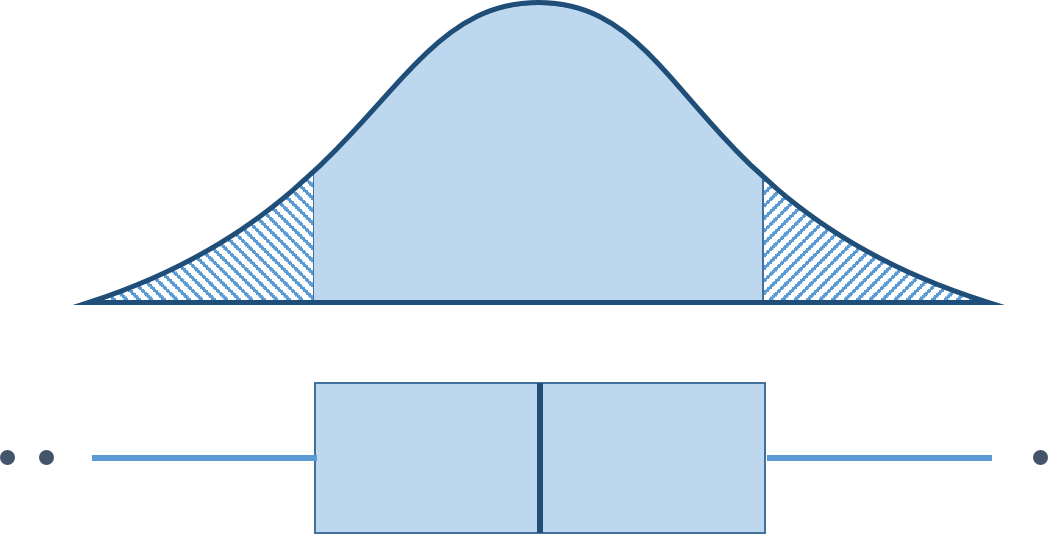
Krabicový graf

základy krabicového grafu

Sentiment Analysis in R

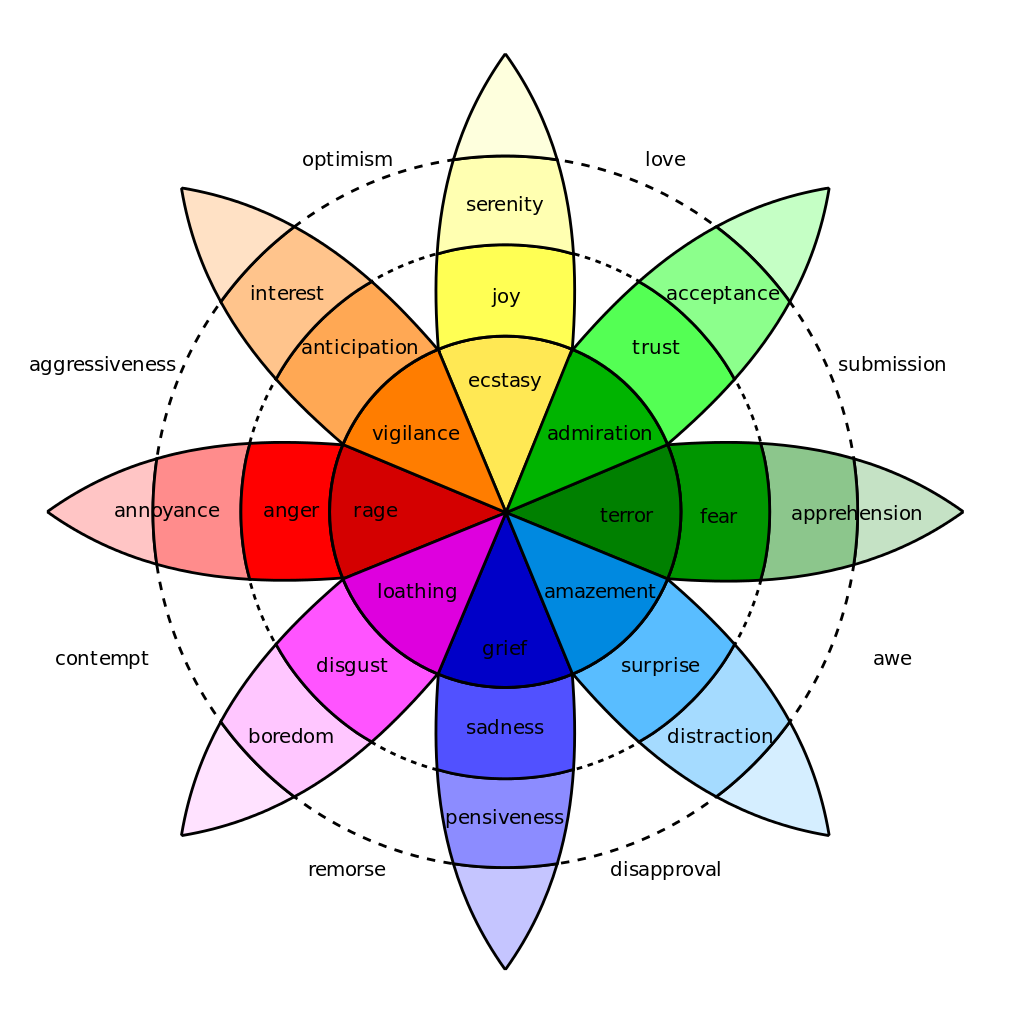
Radarové kolo emocí

Plutchikovo kolo emocí

radarový graf

Sentiment Analysis in R

Stromové mapy

strom

  • Každý blok představuje datový bod (řádek)
  • Velikost bloku je určena jinou datovou dimenzí
  • Barva bloku odpovídá jiné datové dimenzi
  • Bloky jsou seskupeny podle jiné datové dimenze
Sentiment Analysis in R

Pojďme cvičit!

Sentiment Analysis in R

Preparing Video For Download...