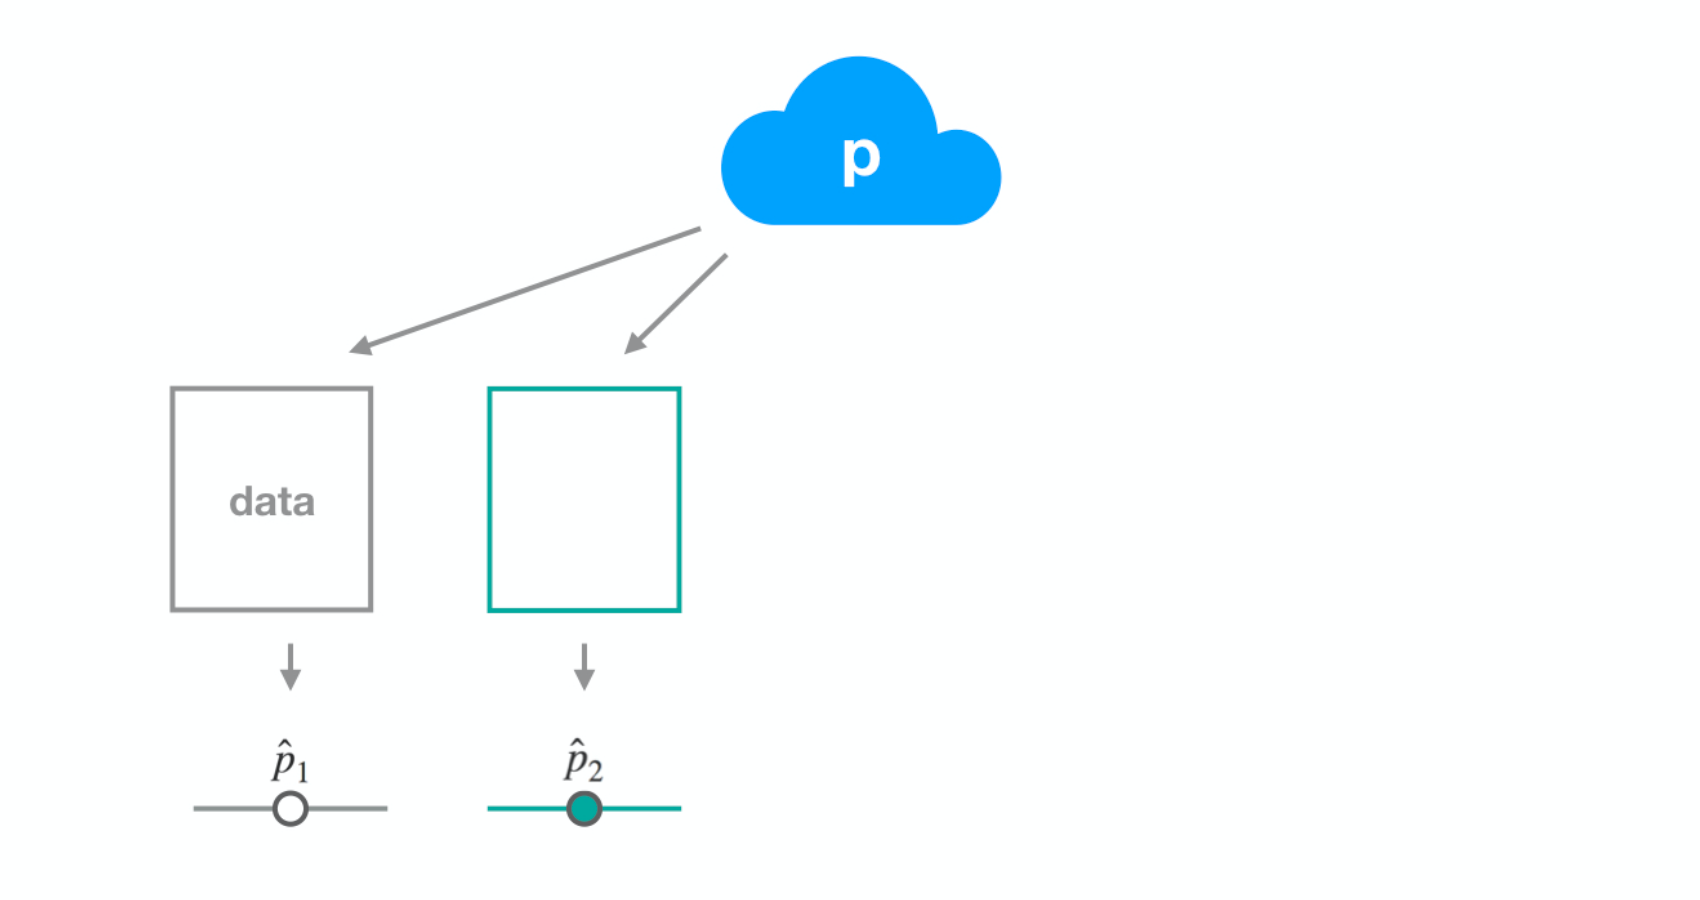
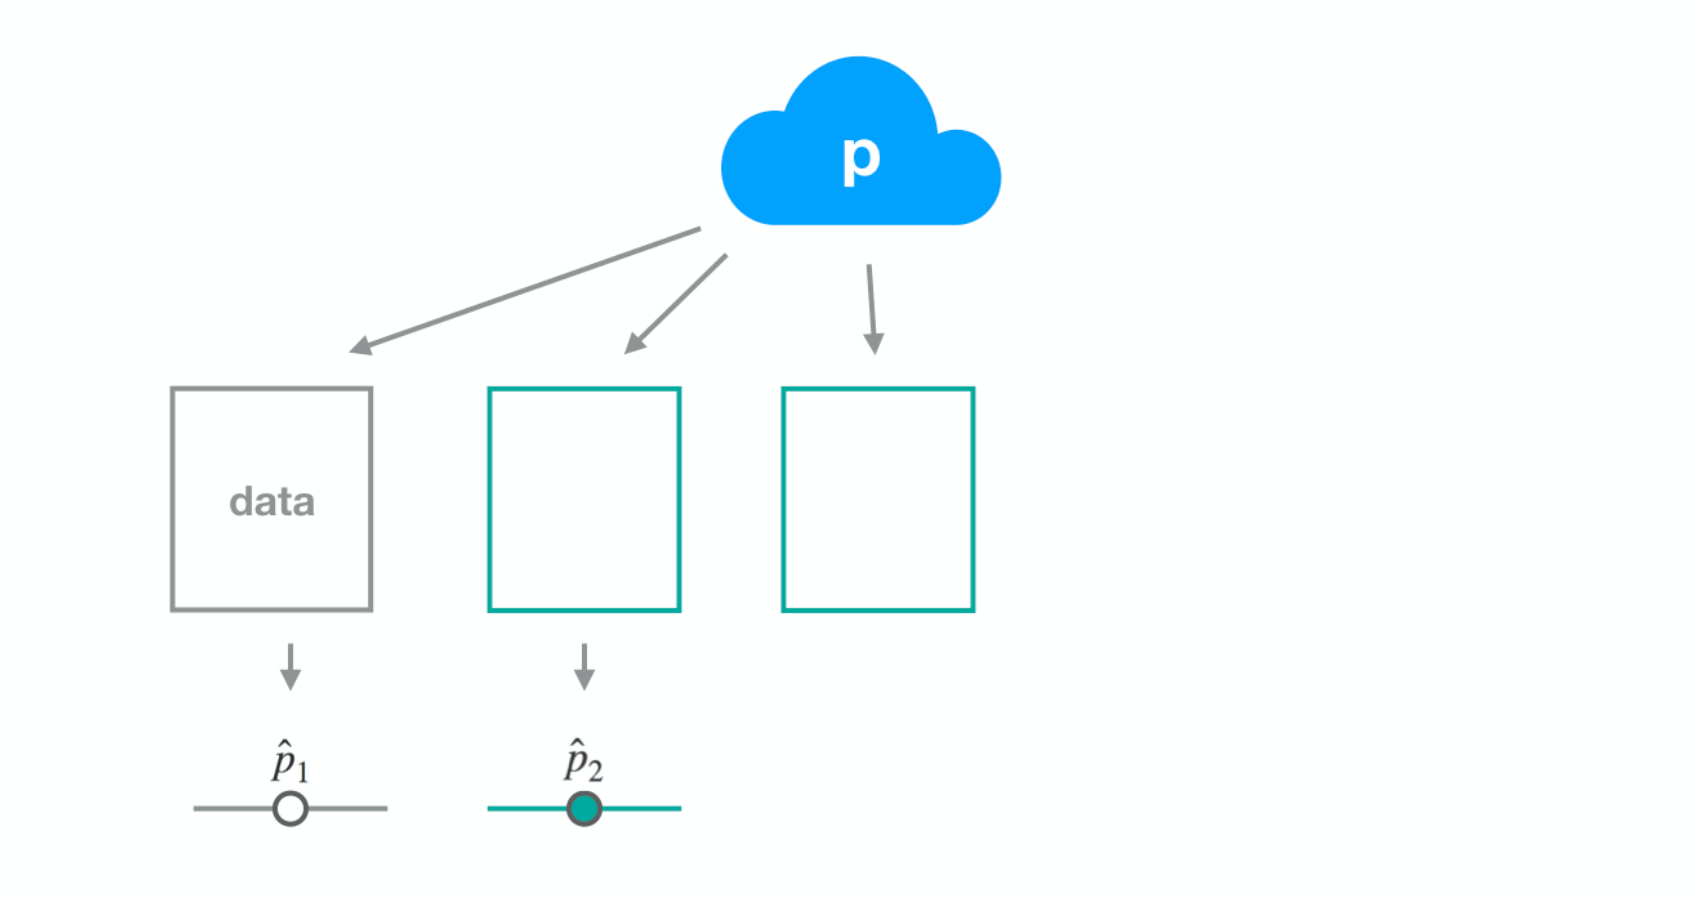
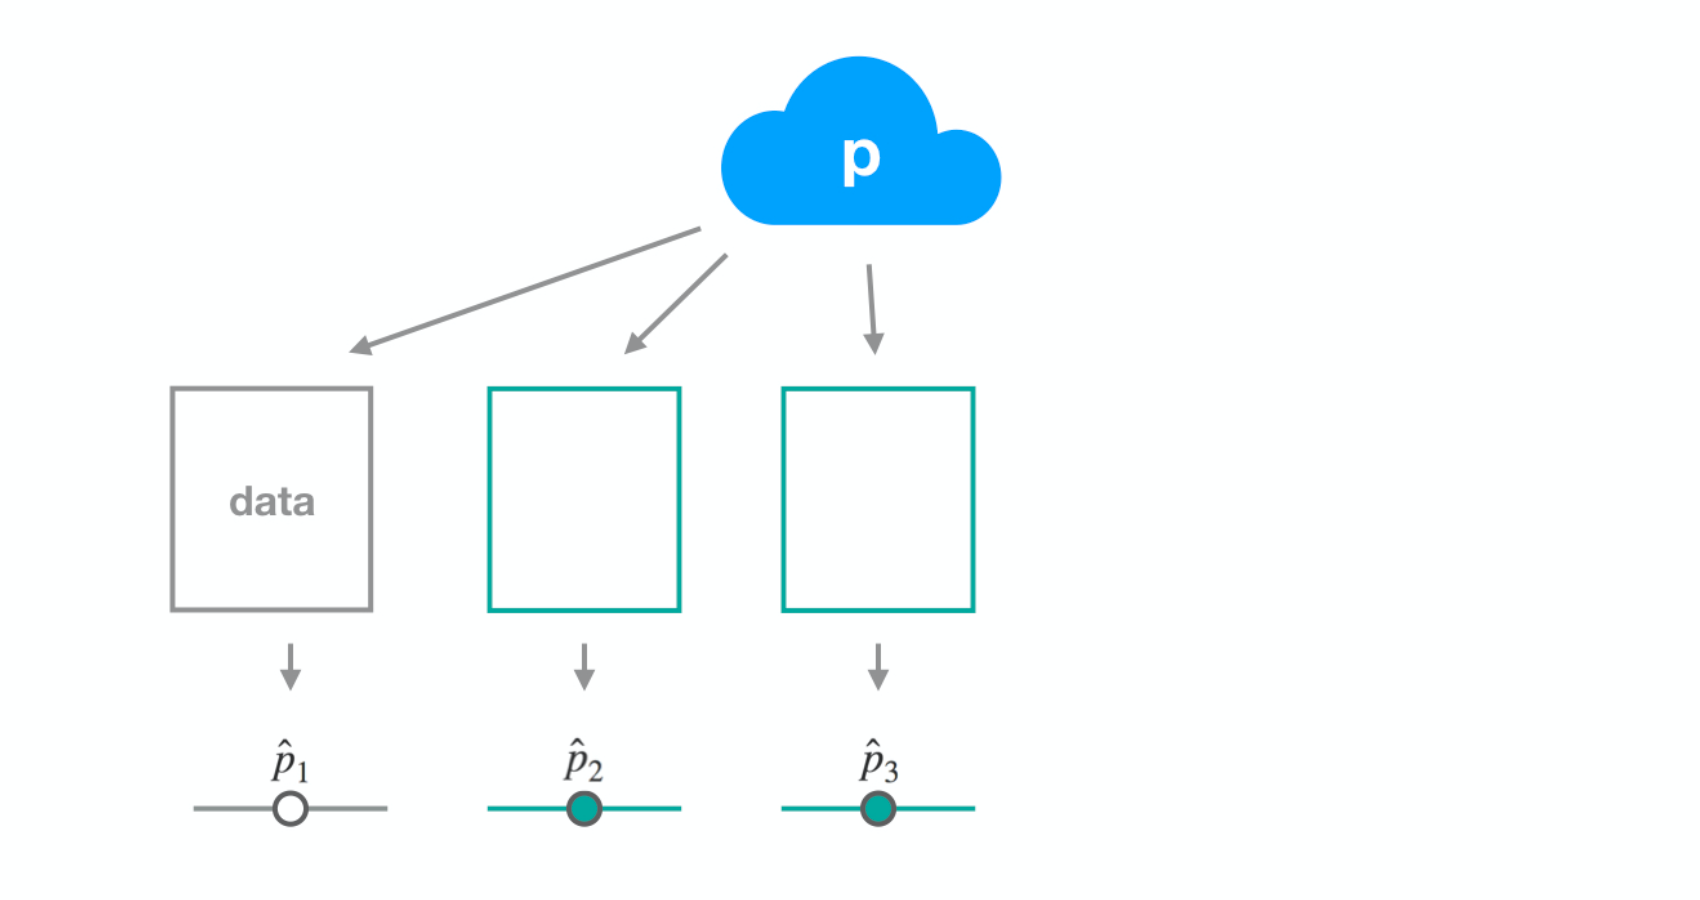
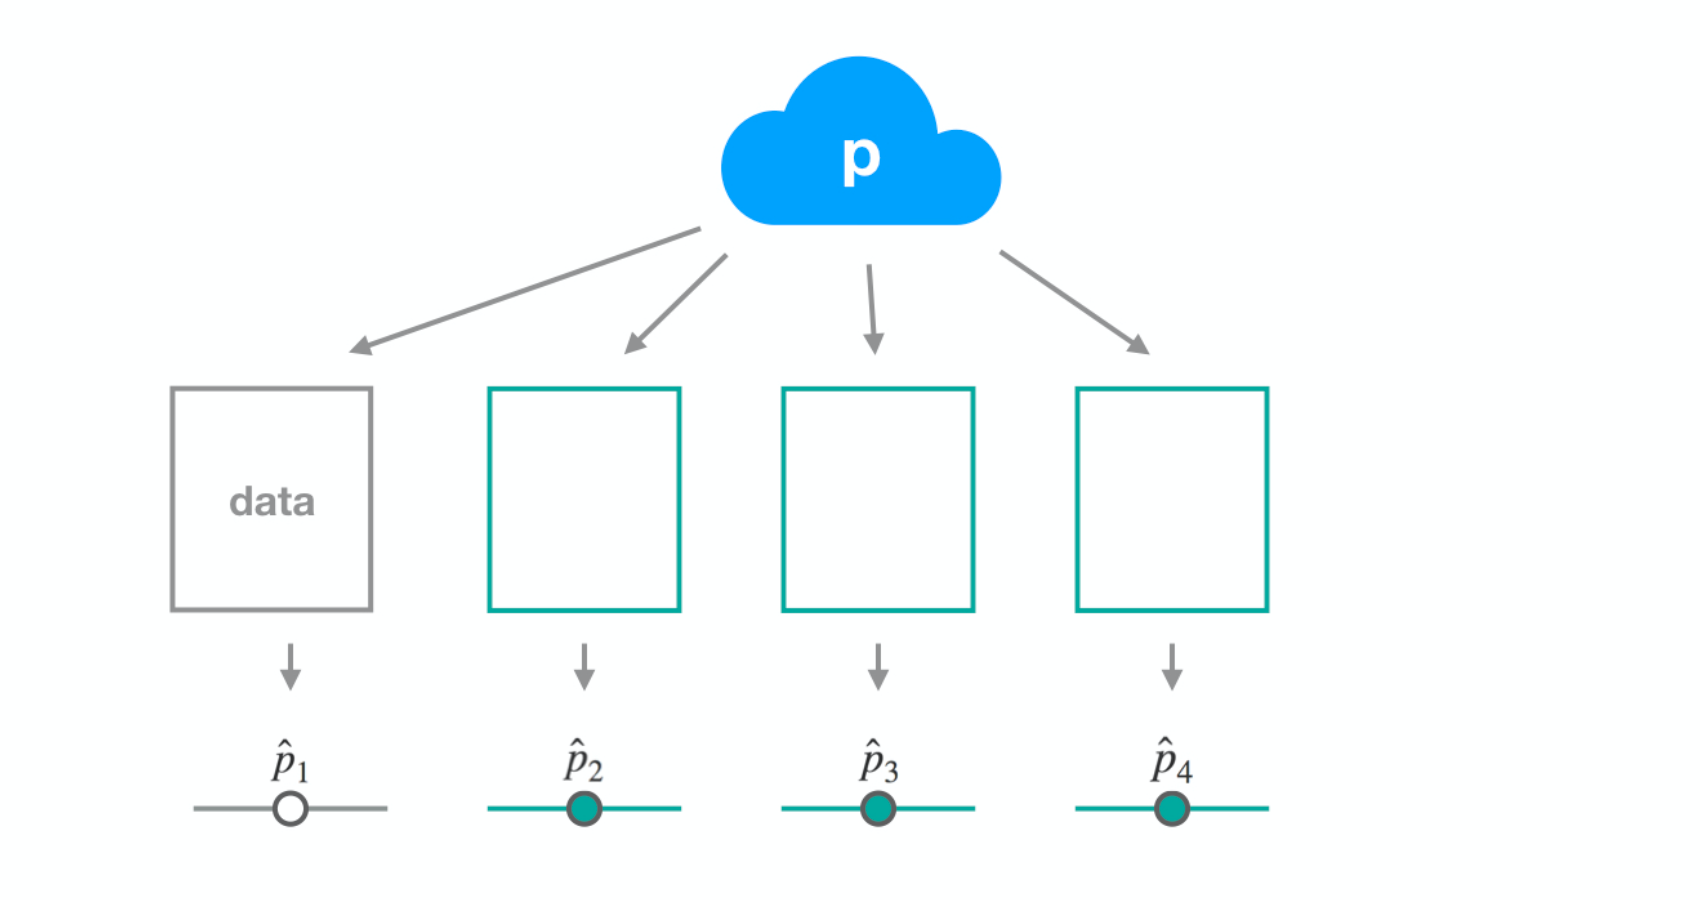
Interpretace intervalu spolehlivosti

Inference for Categorical Data in R

Andrew Bray

Assistant Professor of Statistics at Reed College

Intervaly spolehlivosti

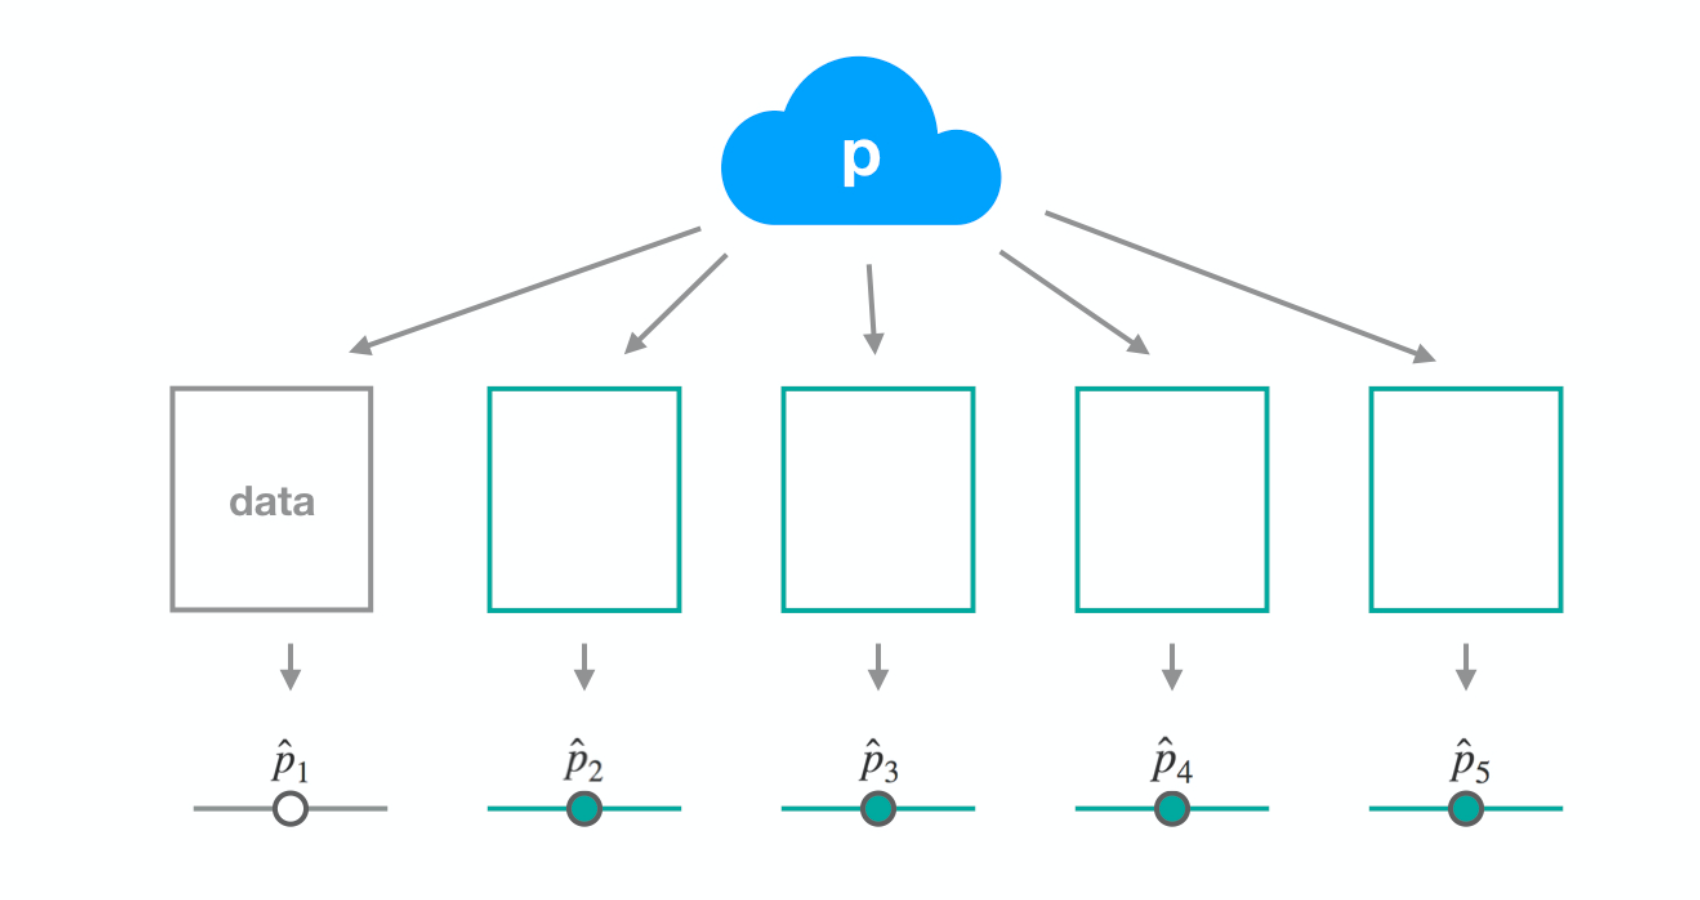
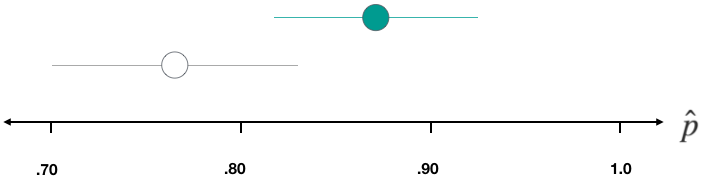
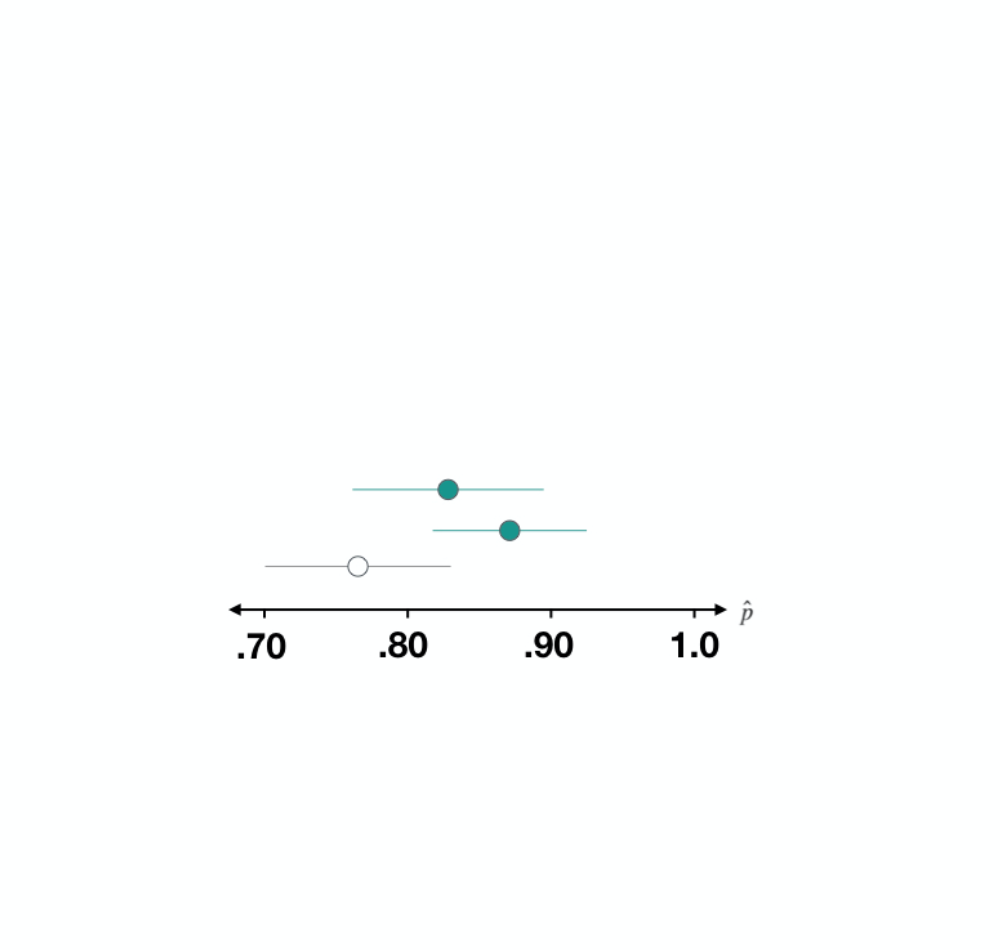
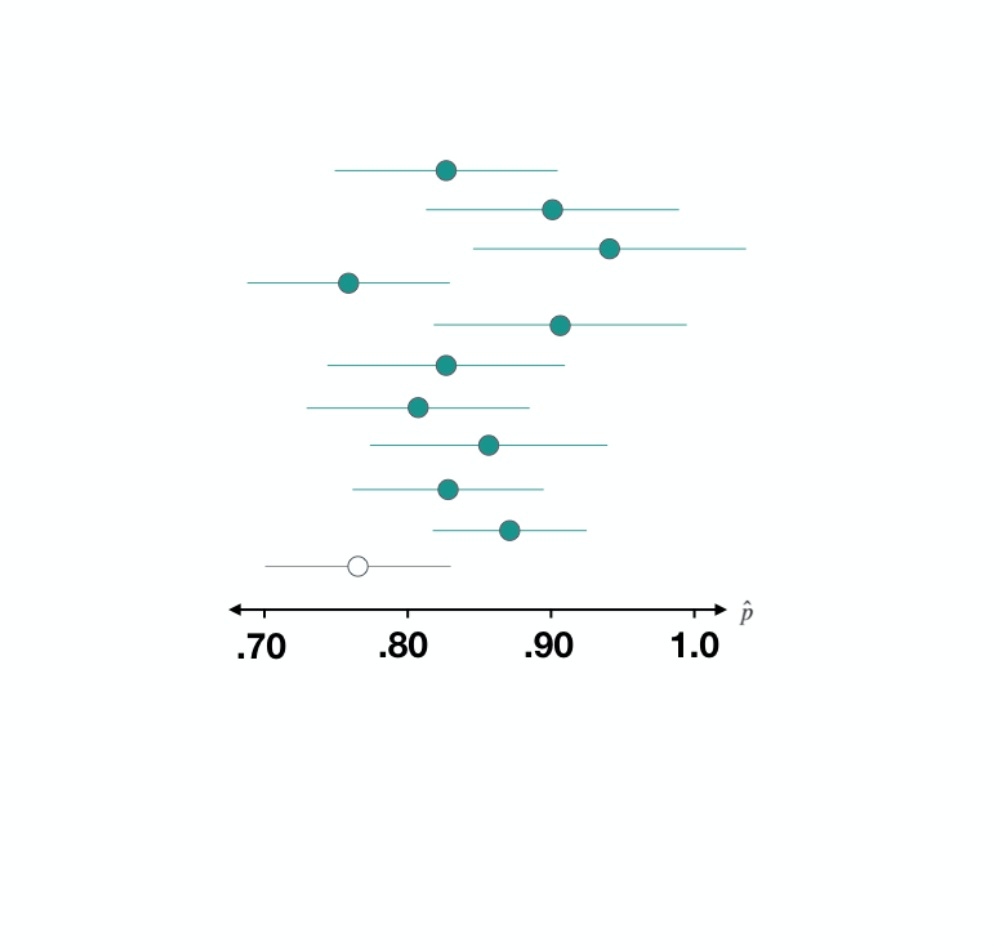
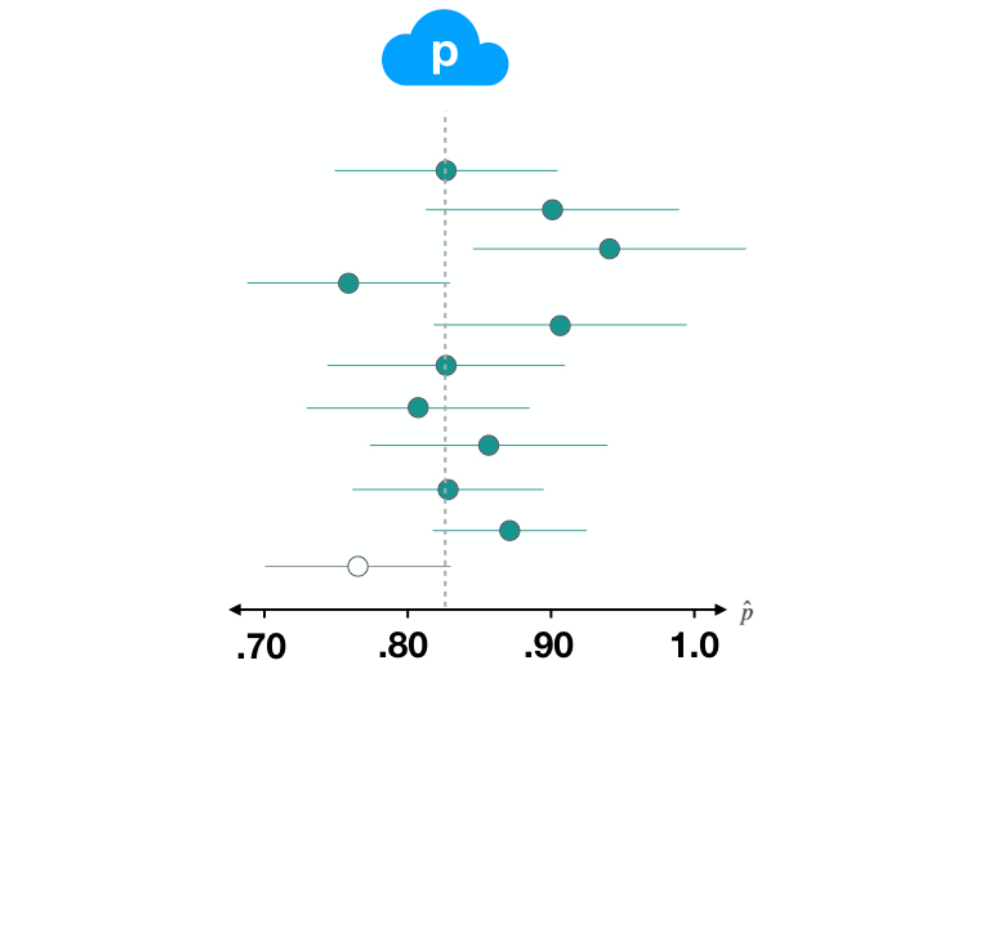
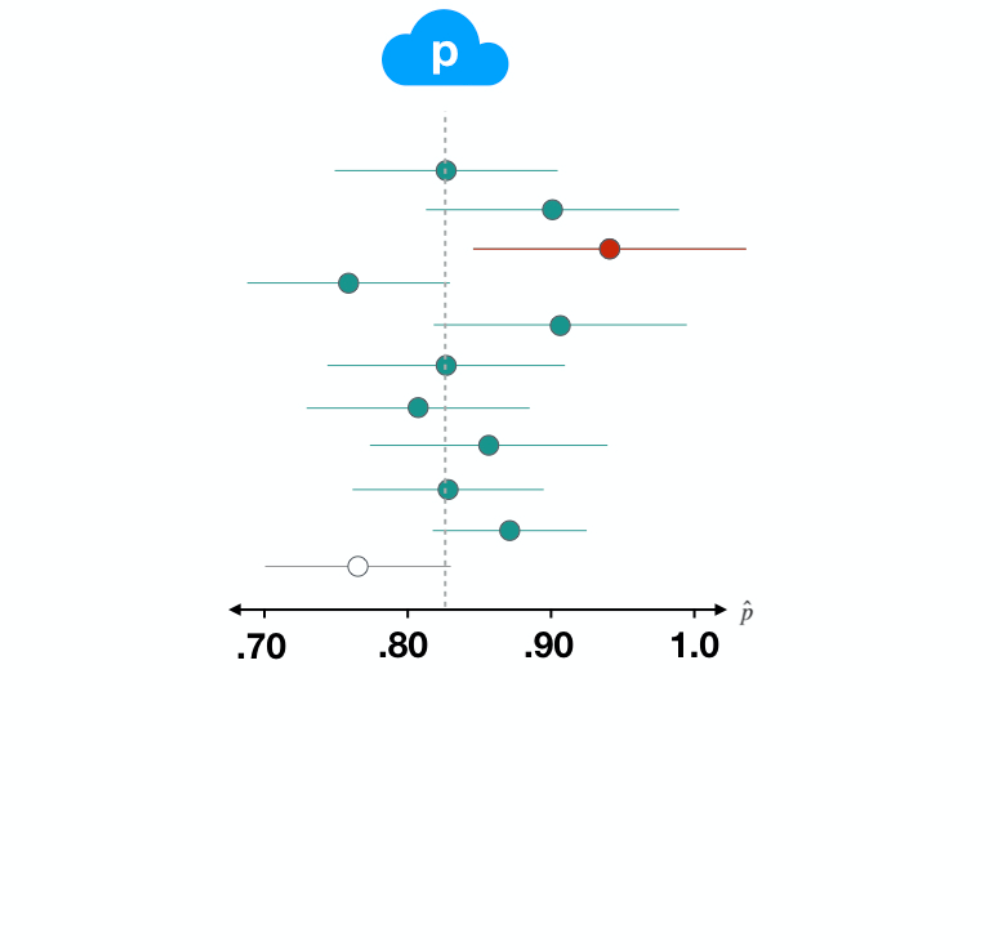
Závěr: skutečný podíl spokojených Američanů je mezi 0,705 a 0,841.

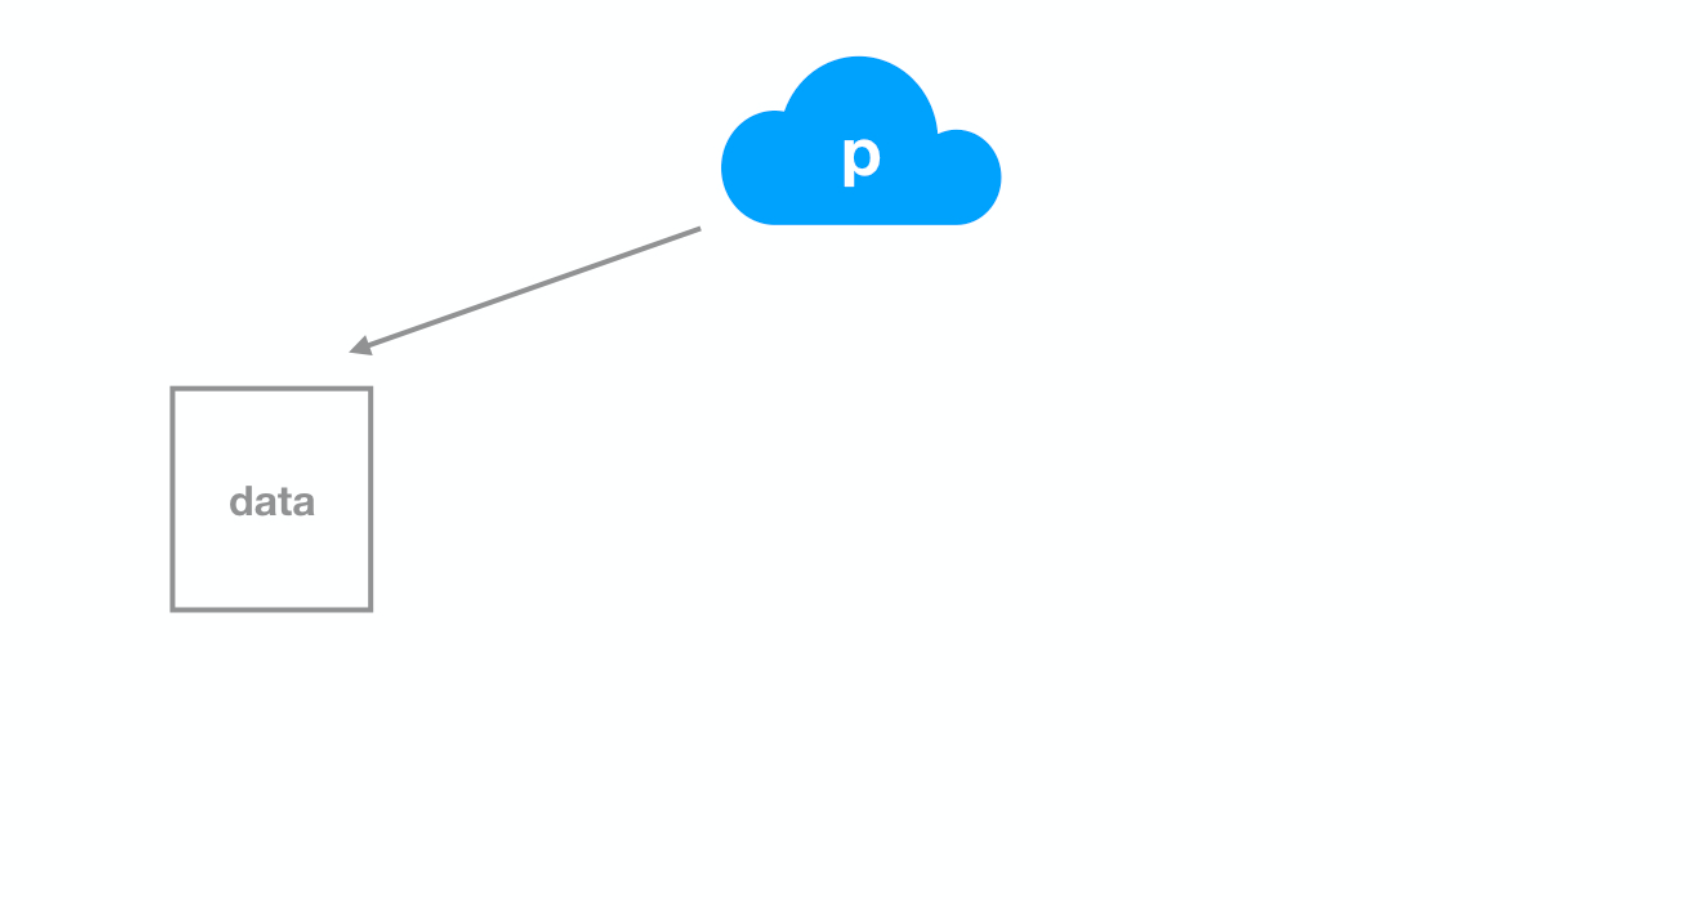
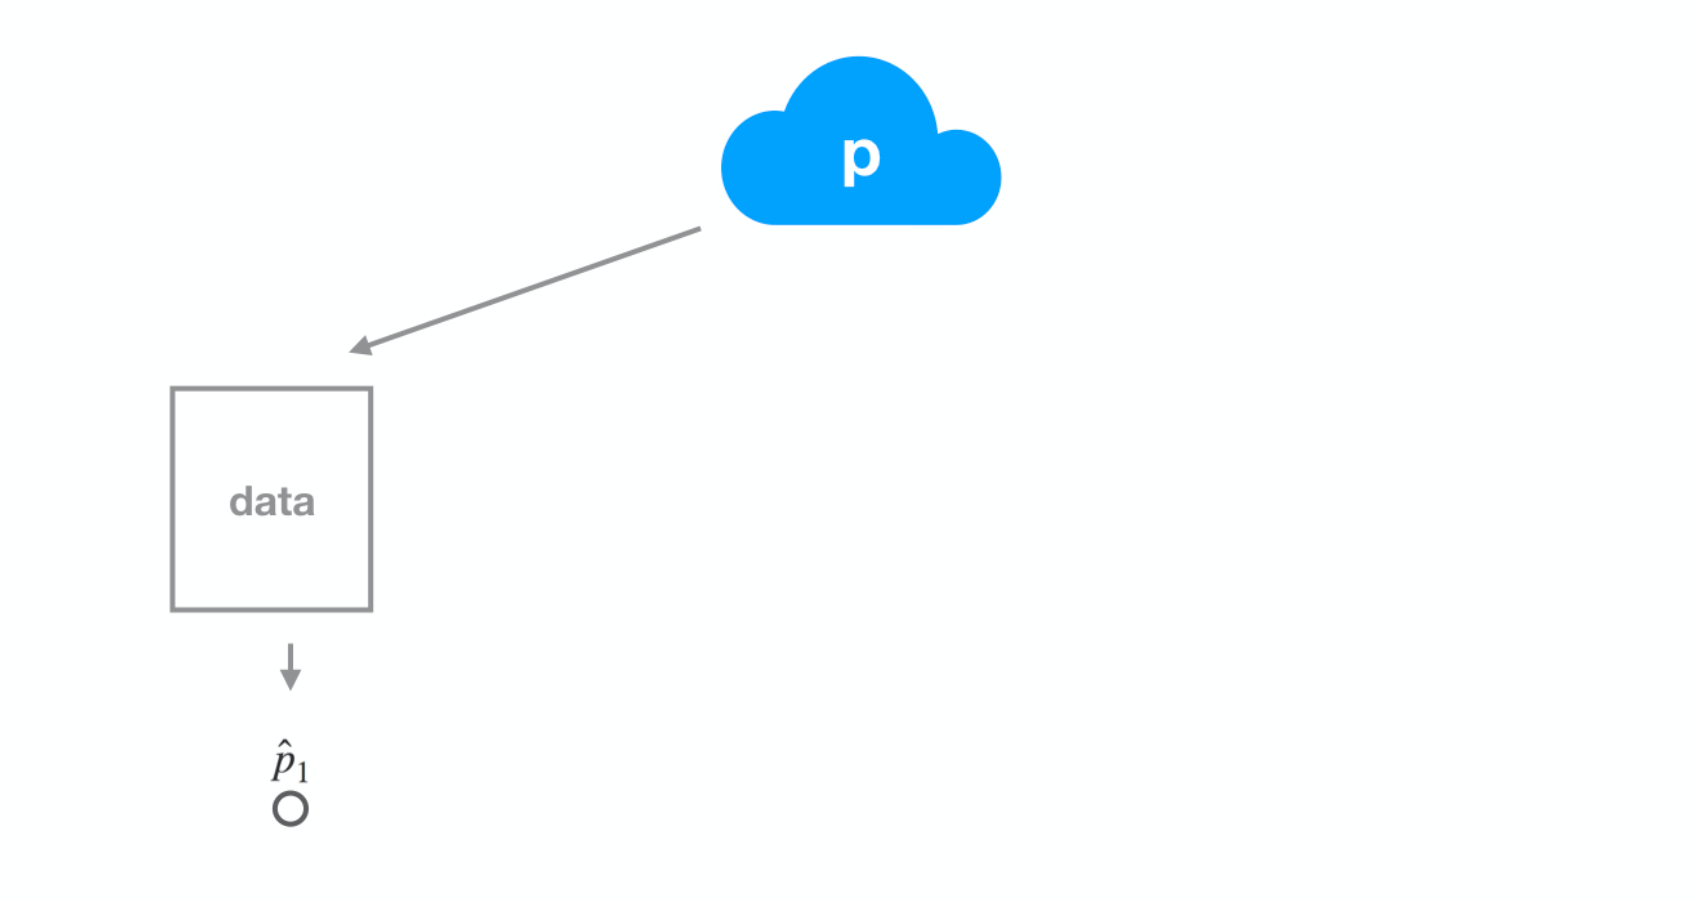
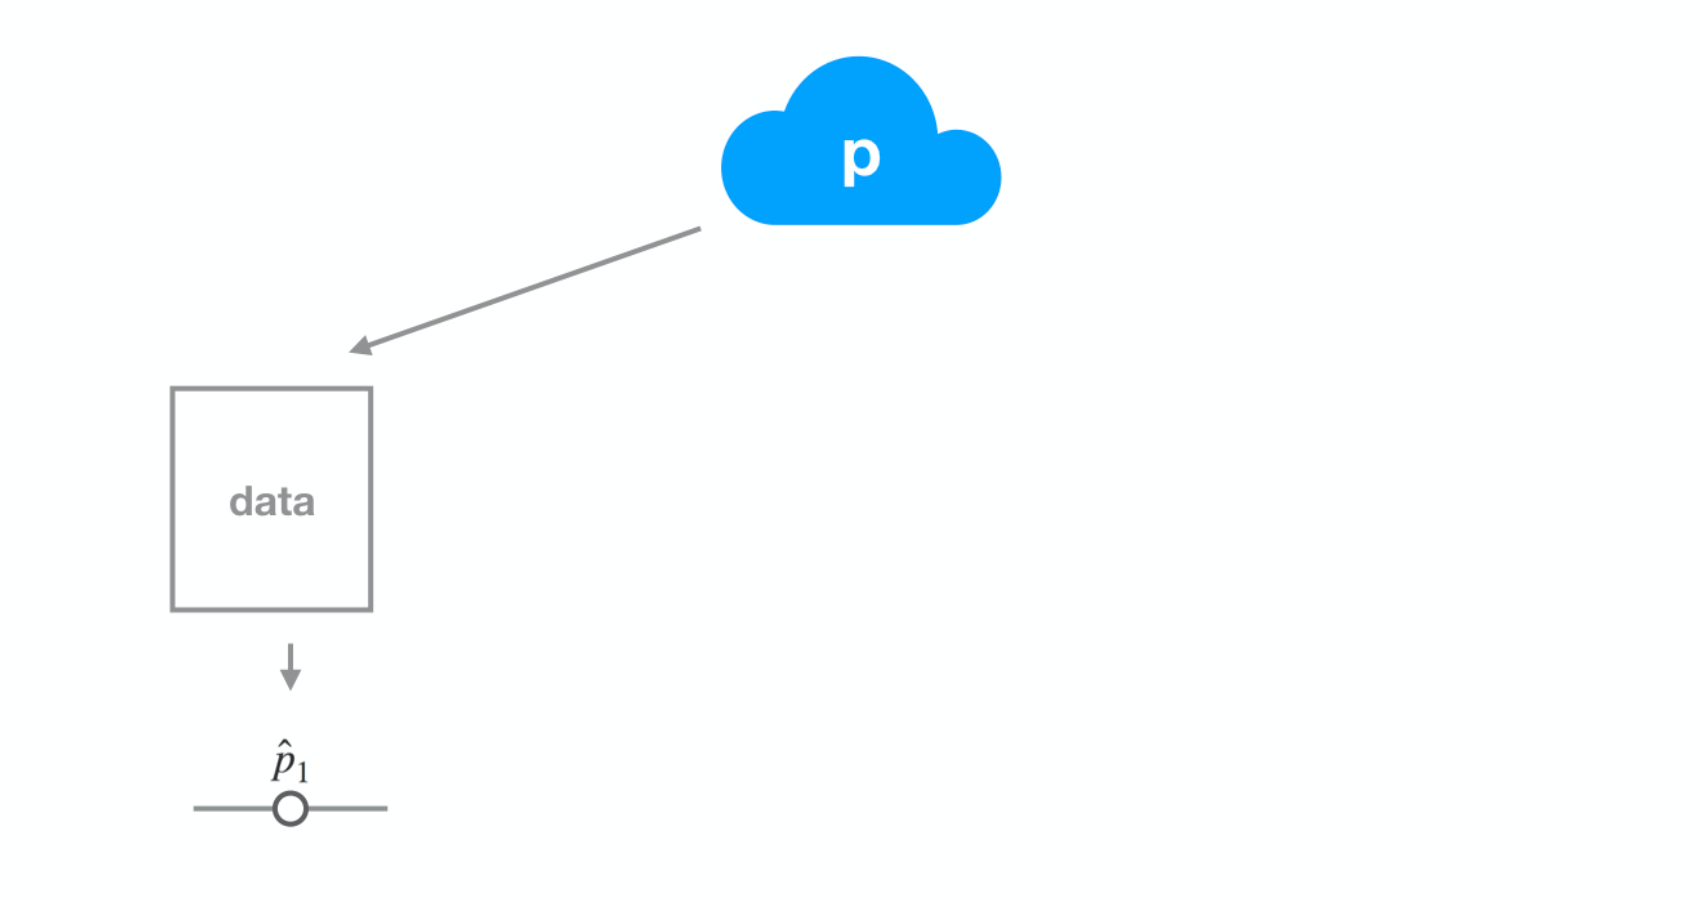
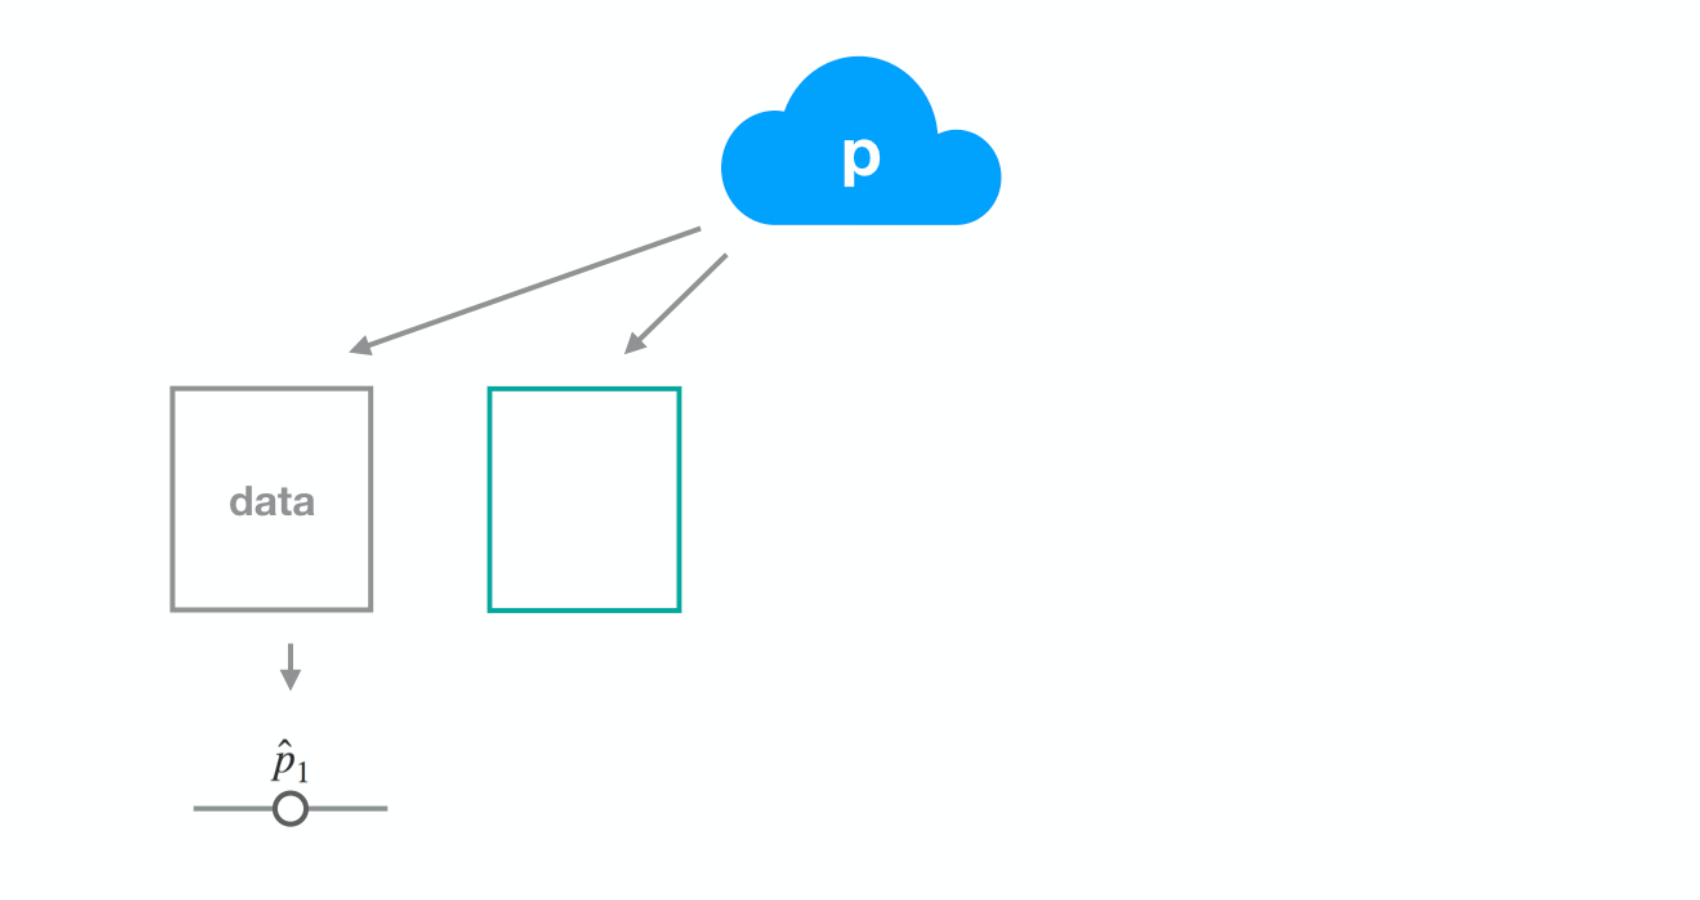
Co znamená s jistotou?

Inference for Categorical Data in R

Datová sada 1

ds1 <- filter(gss, year == 2016)

p_hat <- ds1 %>% summarize(mean(happy == "HAPPY")) %>% pull()
SE <- ds1 %>% specify(response = happy, success = "HAPPY") %>% generate(reps = 500, type = "bootstrap") %>% calculate(stat = "prop") %>% summarize(sd(stat)) %>% pull()
c(p_hat - 2 * SE, p_hat + 2 * SE)
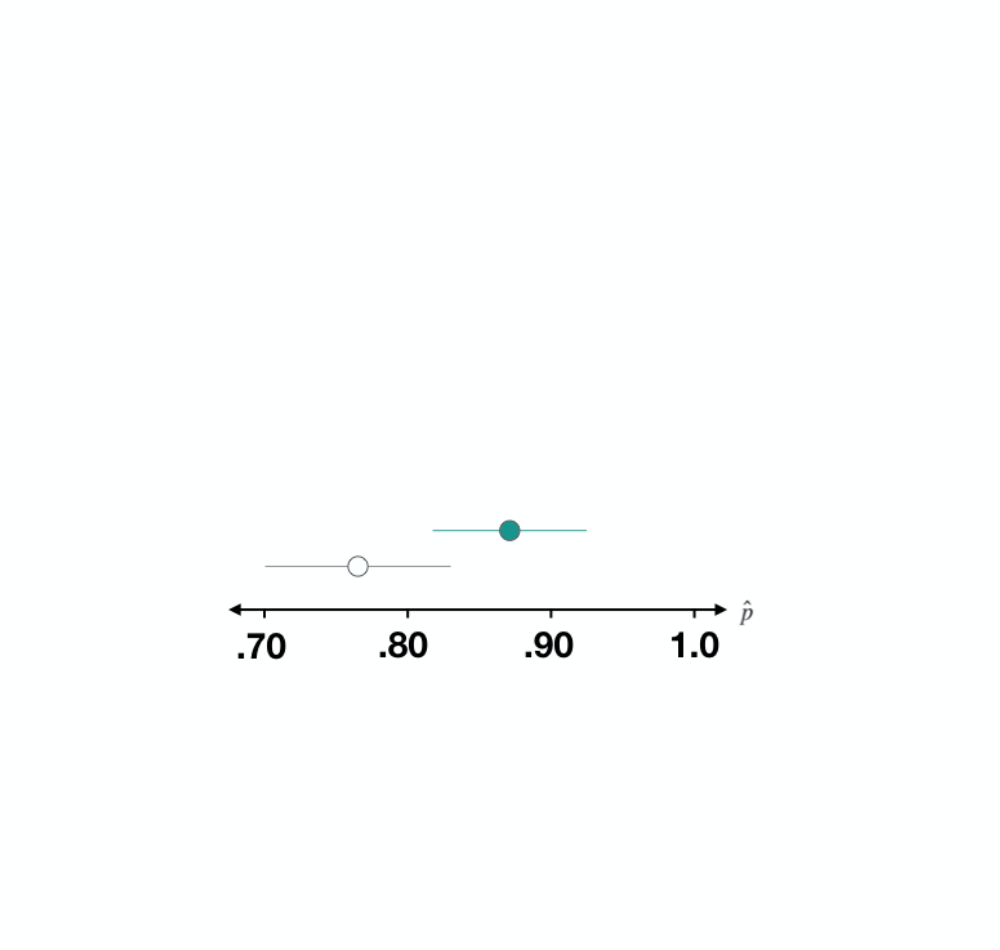
0.7073114 0.8393553

confidence-interval

Inference for Categorical Data in R

one.png

Inference for Categorical Data in R

two.png

Inference for Categorical Data in R

three.png

Inference for Categorical Data in R

four.png

Inference for Categorical Data in R

five.png

Inference for Categorical Data in R

six.png

Inference for Categorical Data in R

seven.png

Inference for Categorical Data in R

eight.png

Inference for Categorical Data in R

nine.png

Inference for Categorical Data in R

ten.png

Inference for Categorical Data in R

Datová sada 2

ds2 <- filter(gss, year == 2014)

p_hat <- ds1 %>% summarize(mean(happy == "HAPPY")) %>% pull()
SE <- ds1 %>% specify(response = happy, success = "HAPPY") %>% generate(reps = 500, type = "bootstrap") %>% calculate(stat = "prop") %>% summarize(sd(stat)) %>% pull()
c(p_hat - 2 * SE, p_hat + 2 * SE)
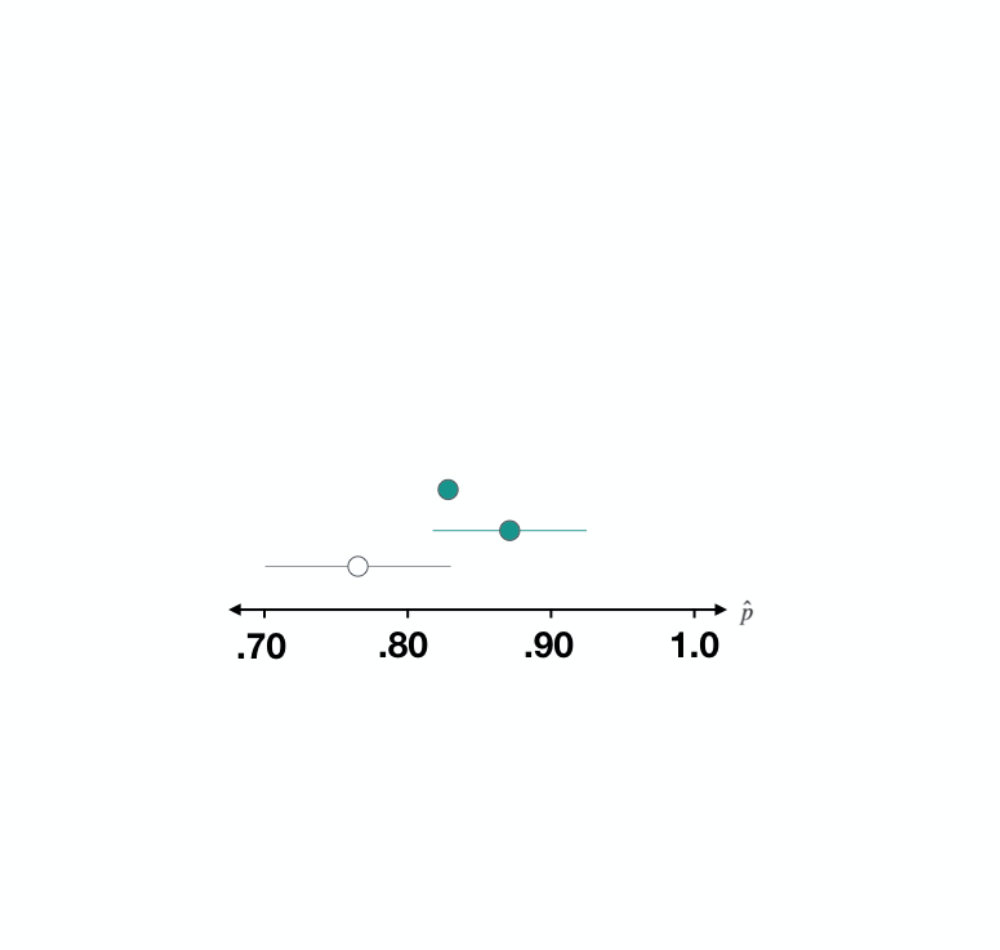
0.8348831 0.9384503

Screenshot 2019-02-21 18.05.03.png

Inference for Categorical Data in R

Datová sada 3

ds3 <- filter(gss, year == 2012)

p_hat <- ds1 %>% summarize(mean(happy == "HAPPY")) %>% pull()
SE <- ds1 %>% specify(response = happy, success = "HAPPY") %>% generate(reps = 500, type = "bootstrap") %>% calculate(stat = "prop") %>% summarize(sd(stat)) %>% pull()
c(p_hat - 2 * SE, p_hat + 2 * SE)
0.7626359 0.8906974

1-2-1.png

Inference for Categorical Data in R

Datová sada 3

ds3 <- filter(gss, year == 2012)
p_hat <- ds3 %>%
  summarize(mean(happy == "HAPPY")) %>%
  pull()
SE <- ds3 %>%
  specify(response = happy, 
          success = "HAPPY") %>%
  generate(reps = 500, 
           type = "bootstrap") %>%
  calculate(stat = "prop") %>%
  summarize(sd(stat)) %>%
  pull()

c(p_hat - 2 * SE, p_hat + 2 * SE)
0.7626359 0.8906974

1-2-2.png

Inference for Categorical Data in R

Datová sada 3

ds3 <- filter(gss, year == 2012)
p_hat <- ds3 %>%
  summarize(mean(happy == "HAPPY")) %>%
  pull()
SE <- ds3 %>%
  specify(response = happy, 
          success = "HAPPY") %>%
  generate(reps = 500, 
           type = "bootstrap") %>%
  calculate(stat = "prop") %>%
  summarize(sd(stat)) %>%
  pull()

c(p_hat - 2 * SE, p_hat + 2 * SE)
0.7626359 0.8906974

1-2-3.png

Inference for Categorical Data in R

Datová sada 3

ds3 <- filter(gss, year == 2012)
p_hat <- ds3 %>%
  summarize(mean(happy == "HAPPY")) %>%
  pull()
SE <- ds3 %>%
  specify(response = happy, 
          success = "HAPPY") %>%
  generate(reps = 500, 
           type = "bootstrap") %>%
  calculate(stat = "prop") %>%
  summarize(sd(stat)) %>%
  pull()

c(p_hat - 2 * SE, p_hat + 2 * SE)
0.7626359 0.8906974

1-2-4.png

Inference for Categorical Data in R

Datová sada 3

ds3 <- filter(gss, year == 2012)
p_hat <- ds3 %>%
  summarize(mean(happy == "HAPPY")) %>%
  pull()
SE <- ds3 %>%
  specify(response = happy, 
          success = "HAPPY") %>%
  generate(reps = 500, 
           type = "bootstrap") %>%
  calculate(stat = "prop") %>%
  summarize(sd(stat)) %>%
  pull()

c(p_hat - 2 * SE, p_hat + 2 * SE)
0.7626359 0.8906974

1-2-5.png

Inference for Categorical Data in R

Datová sada 3

ds3 <- filter(gss, year == 2012)
p_hat <- ds3 %>%
  summarize(mean(happy == "HAPPY")) %>%
  pull()
SE <- ds3 %>%
  specify(response = happy, 
          success = "HAPPY") %>%
  generate(reps = 500, 
           type = "bootstrap") %>%
  calculate(stat = "prop") %>%
  summarize(sd(stat)) %>%
  pull()

c(p_hat - 2 * SE, p_hat + 2 * SE)
0.7626359 0.8906974

1-2-6.png

Inference for Categorical Data in R

Intervaly spolehlivosti

Interpretace: „S 95% jistotou tvrdíme, že skutečný podíl spokojených Američanů je mezi 0,705 a 0,841."

Šířka intervalu závisí na

  • n
  • úrovni spolehlivosti
  • p
Inference for Categorical Data in R

Let's practice!

Inference for Categorical Data in R

Preparing Video For Download...