Marketing Analytics: Predicting Customer Churn in Python
Mark Peterson
Director of Data Science, Infoblox
Knihovna seaborn umožňuje snadno vytvářet přehledné a atraktivní grafy
Staví na matplotlib
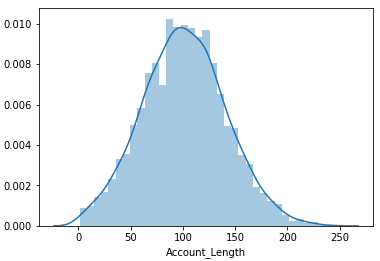
import matplotlib.pyplot as plt import seaborn as snssns.distplot(telco['Account_Length'])plt.show()

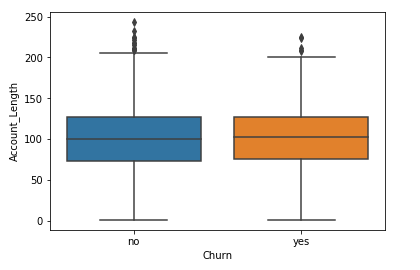
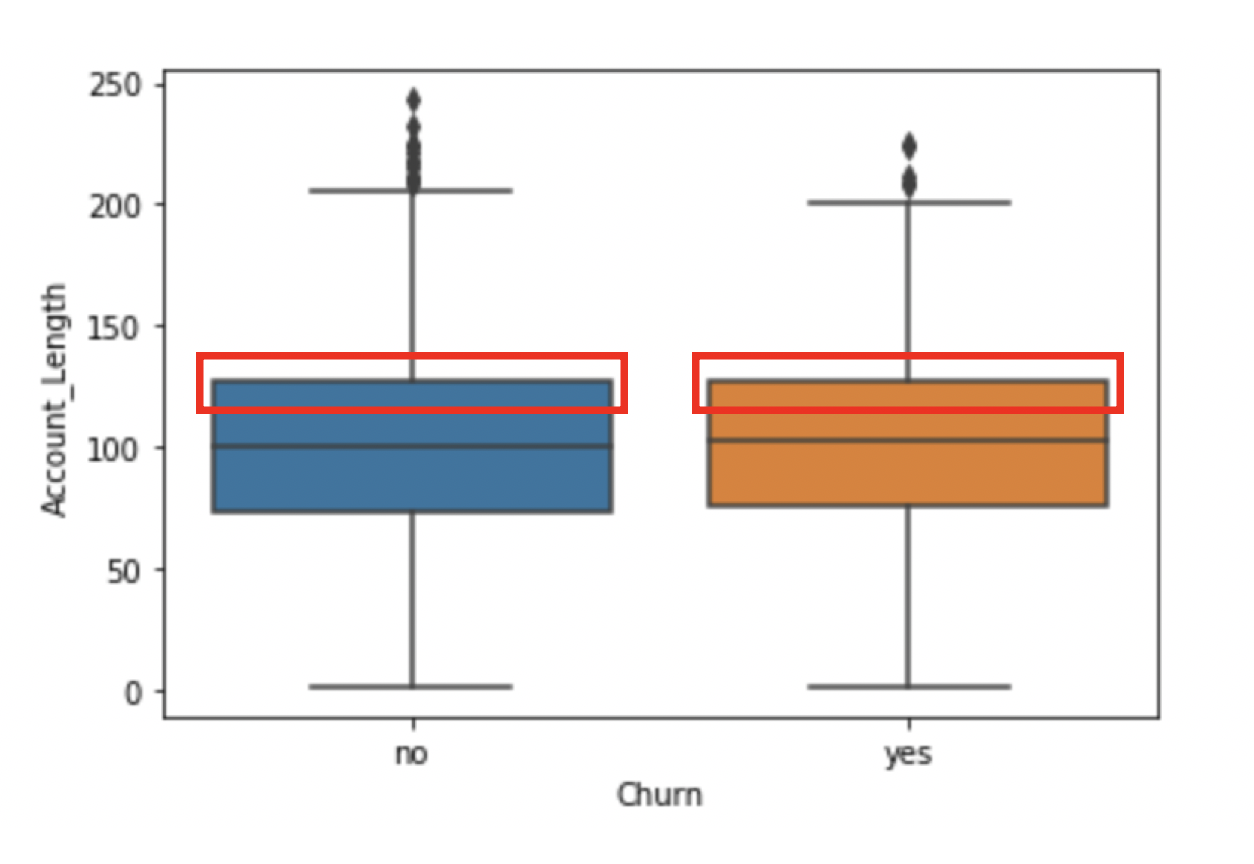
sns.boxplot(x = 'Churn',
y = 'Account_Length',
data = telco)
plt.show()

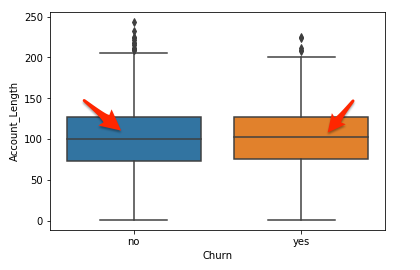
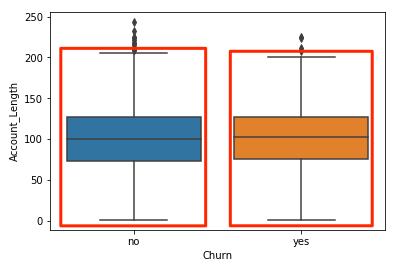
sns.boxplot(x = 'Churn',
y = 'Account_Length',
data = telco)
plt.show()

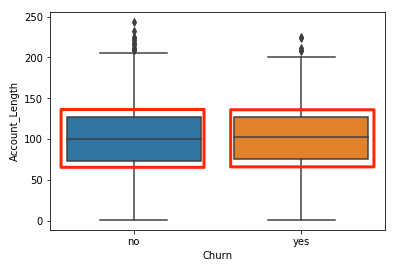
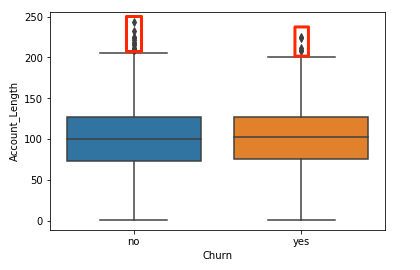
sns.boxplot(x = 'Churn',
y = 'Account_Length',
data = telco)
plt.show()

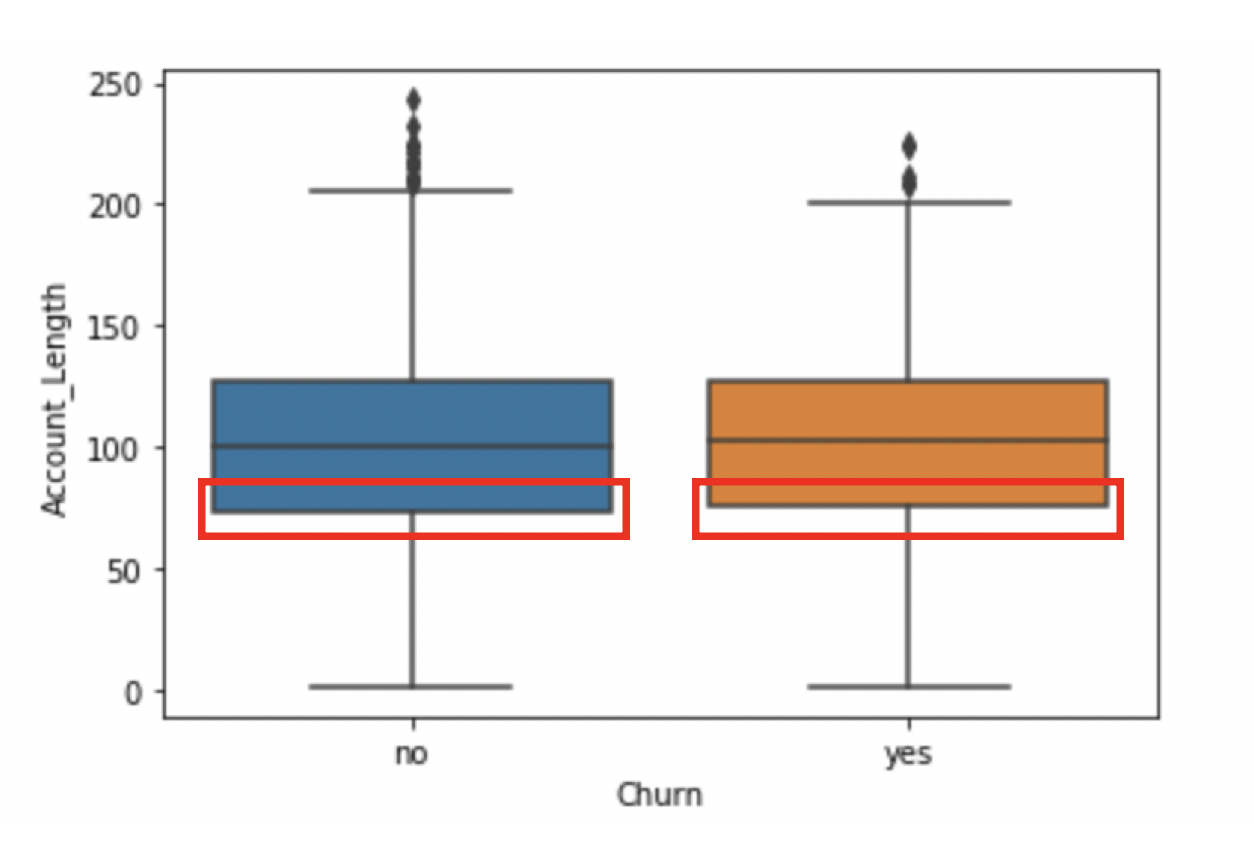
sns.boxplot(x = 'Churn',
y = 'Account_Length',
data = telco)
plt.show()

sns.boxplot(x = 'Churn',
y = 'Account_Length',
data = telco)
plt.show()

sns.boxplot(x = 'Churn',
y = 'Account_Length',
data = telco)
plt.show()

sns.boxplot(x = 'Churn',
y = 'Account_Length',
data = telco)
plt.show()

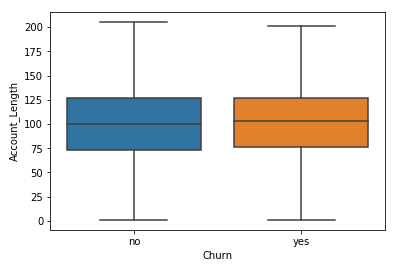
sns.boxplot(x = 'Churn',
y = 'Account_Length',
data = telco,
sym="")
plt.show()

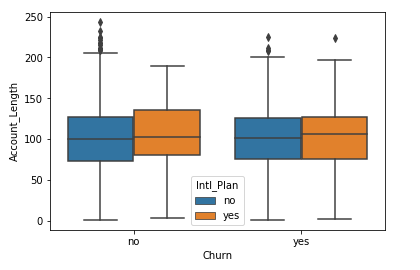
sns.boxplot(x = 'Churn',
y = 'Account_Length',
data = telco,
hue = 'Intl_Plan')
plt.show()

Marketing Analytics: Predicting Customer Churn in Python