Detekce driftu – univariátní metody

Monitoring Machine Learning in Python

Hakim Elakhrass

CEO and co-founder

Co je univariátní detekce driftu?
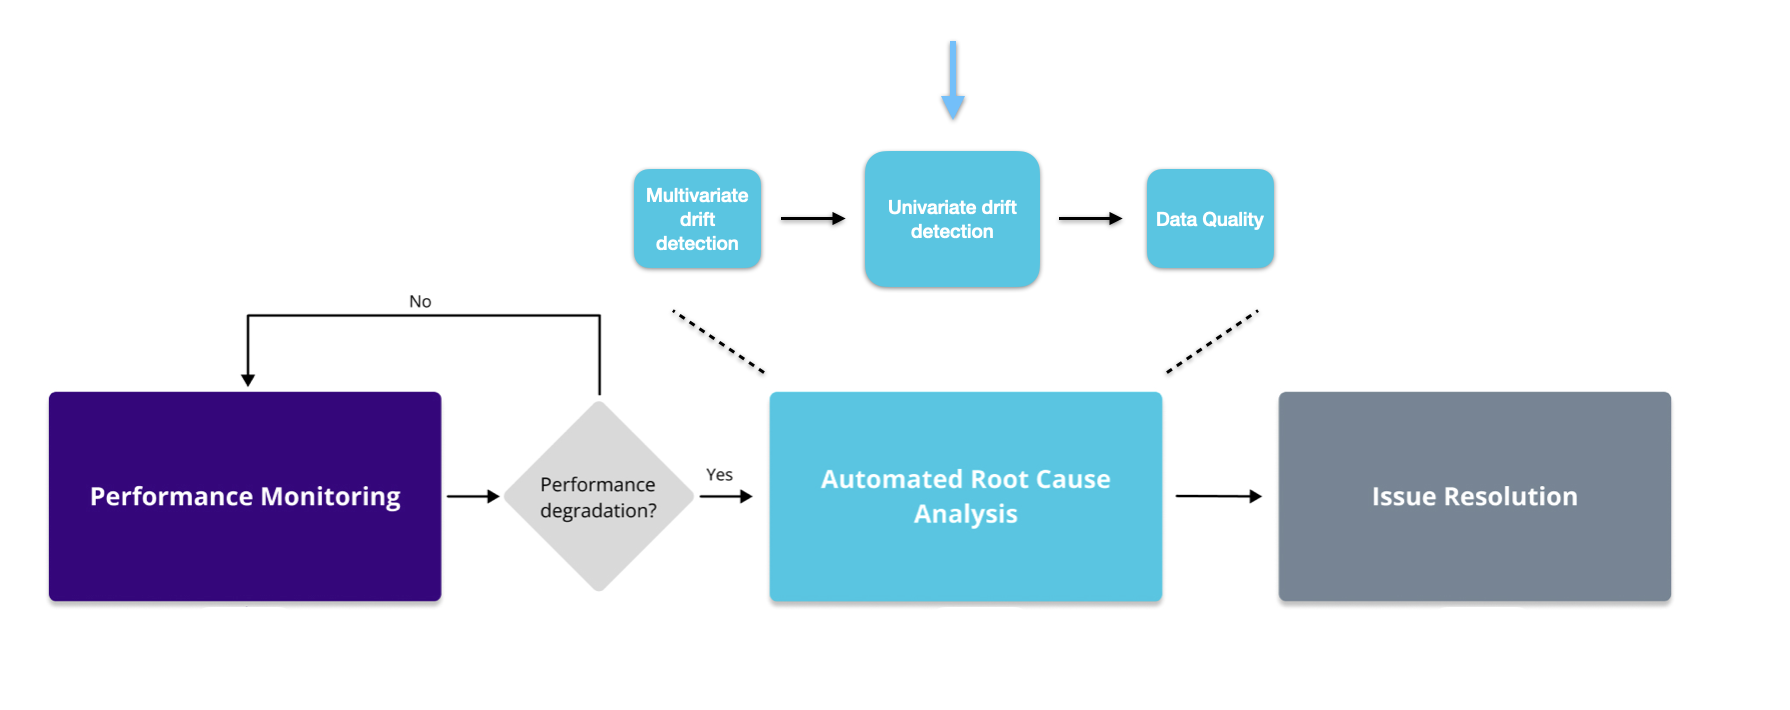
Obrázek zobrazuje monitorovací workflow a umístění univariátní metody v něm.

Monitoring Machine Learning in Python

Univariátní metody

  • Jensen-Shannonova vzdálenost – kategorické i spojité
  • Hellingerova vzdálenost – kategorické i spojité
  • Wassersteinova vzdálenost – pouze spojité
  • Kolmogorov-Smirnov – pouze spojité

  • L-nekonečno – pouze kategorické

  • Chi2 – pouze kategorické

1 https://nannyml.readthedocs.io/en/stable/how_it_works/univariate_drift_comparison.html
Monitoring Machine Learning in Python

Implementace kódu

# Intialize the univariate drift calculator
uv_calc = nannyml.UnivariateDriftCalculator(
    continuous_methods=['wasserstein', 'hellinger'],
    categorical_methods=['jensen_shannon', 'l_infinity', 'chi2'],
    column_names=feature_column_names,
    timestamp_column_name='timestamp',
    chunk_period='d'
    )
# Fit, calculate and plot the results
uv_calc.fit(reference)
uv_results = uv_calc.calculate(analysis)
uv_results.plot().show()
Monitoring Machine Learning in Python

Filtrování

  • Podle názvů sloupců
  • Podle univariátních metod
# Filter the univariate results
filtered_figure = uv_results.filter(column_names=['trip_distance', 'fare_amount'], 
            methods=['jensen_shannon'])

# Plot the filtered results
filtered_figure.show().plot()
Monitoring Machine Learning in Python

Ranker podle počtu alertů

  • Seřazení příznaků podle počtu alertů
# Initialize the alert count ranker
alert_count_ranker = nannyml.AlertCountRanker()
alert_count_ranked_results = alert_count_ranker.rank(
    uv_results,
    only_drifting=False)
# Display the results
display(alert_count_ranked_results)
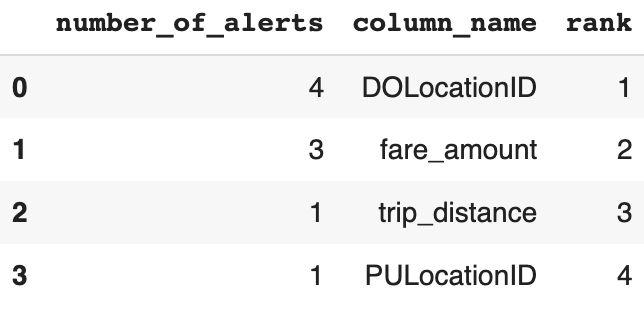
Obrázek zobrazuje dataframe s informacemi o počtu alertů pro konkrétní příznak.

Monitoring Machine Learning in Python

Korelační ranker

  • Seřazuje příznaky podle korelace s absolutními změnami výkonu
# Initialize the correlation ranker
correlation_ranker = nannyml.CorrelationRanker()
correlation_ranker.fit(perf_results.filter(period='reference'))
correlation_ranked_results = correlation_ranker.rank(uv_results, perf_results)

# Display the results
display(correlation_ranked_results)
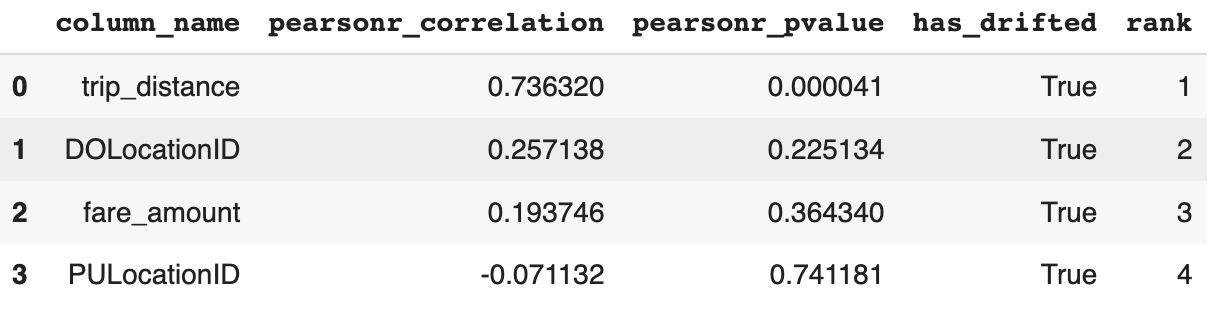
Obrázek zobrazuje dataframe s Pearsonovou korelací a p-hodnotou pro každý příznak.

Monitoring Machine Learning in Python

Monitorování distribuce příznaků

  • Poskytuje lepší přehled a zlepšuje interpretovatelnost
# Create distribution plots
distribution_results = uv_results.plot(kind='distribution')

# Show the plots
distribution_results.show()
Monitoring Machine Learning in Python

Graf distribuce příznaků


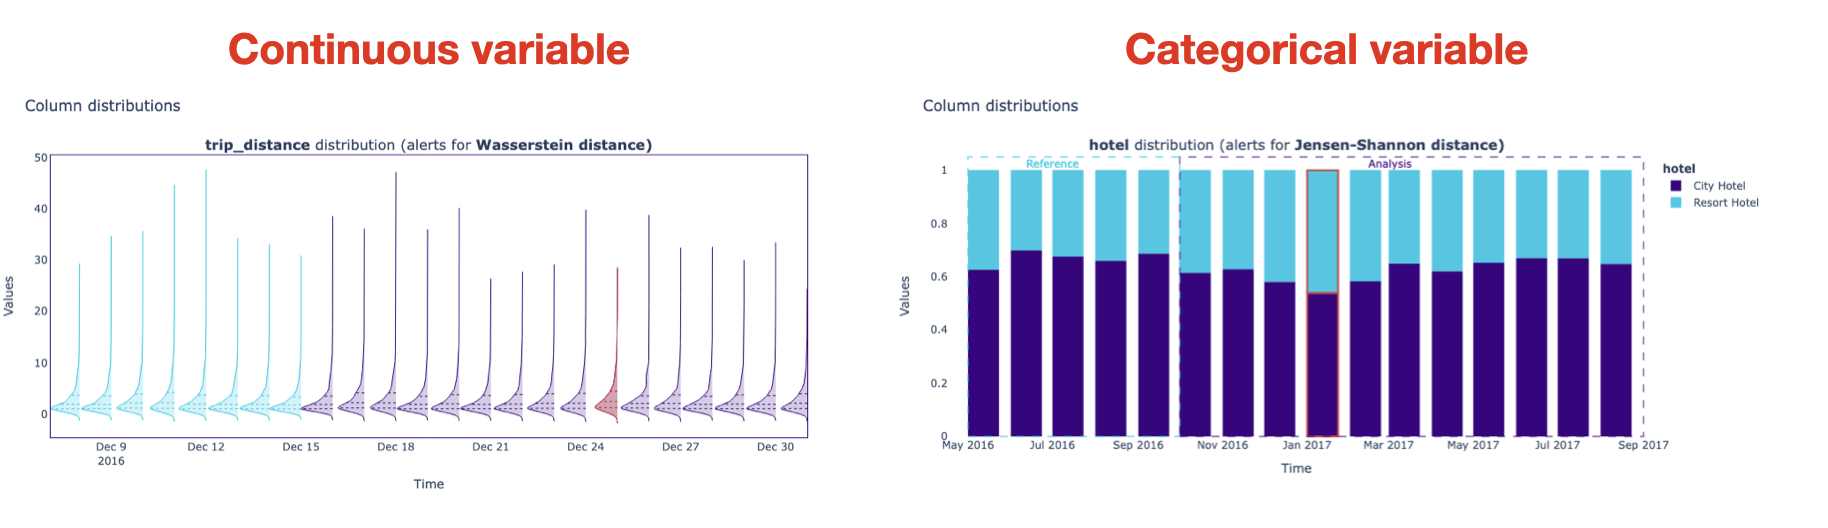
Obrázek zobrazuje grafy distribuce pro spojité a kategorické příznaky.

Monitoring Machine Learning in Python

Pojďme cvičit!

Monitoring Machine Learning in Python

Preparing Video For Download...