Vizualizace distribuce dat

Importing and Managing Financial Data in Python

Stefan Jansen

Instructor

Vždy si prohlédněte data!

  • Stejné metriky mohou popisovat velmi odlišná data
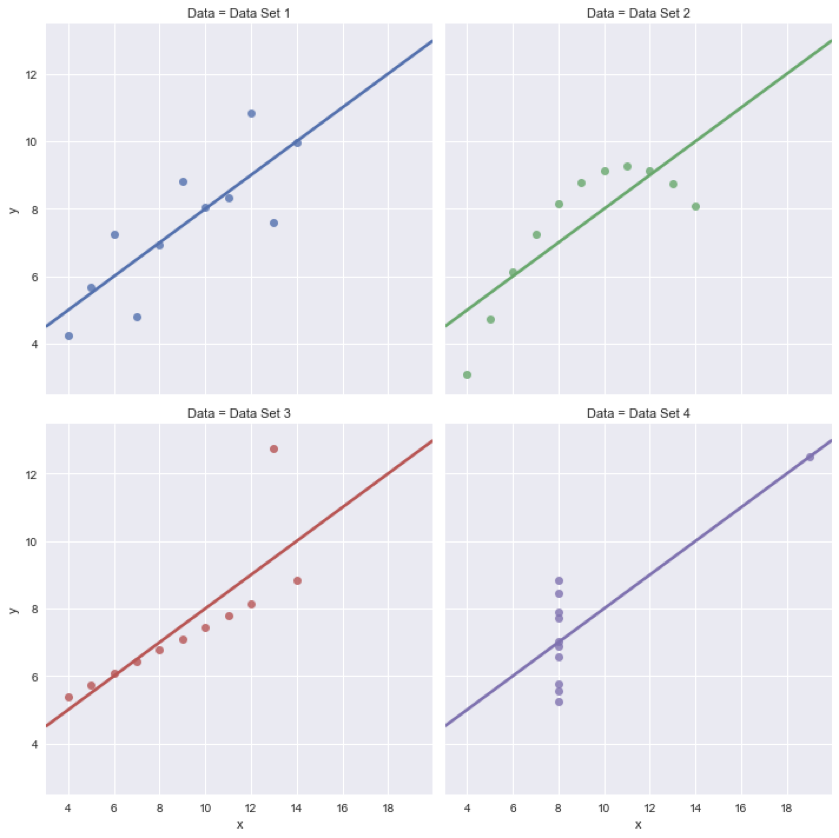
Vždy se podívejte na data

Importing and Managing Financial Data in Python

Grafy v knihovně seaborn

  • Mnoho přehledných a názorných statistických grafů
  • Založeno na matplotlib
  • Švýcarský nůž: seaborn.distplot()
    • Histogram
    • Odhad hustoty jádra (KDE)
    • Rugplot
Importing and Managing Financial Data in Python

10letý dluhopis: trend a distribuce

ty10 = web.DataReader('DGS10', 'fred', date(1962, 1, 1))
ty10.info()
DatetimeIndex: 15754 entries, 1962-01-02 to 2022-05-20
Data columns (total 1 columns):
 #   Column  Non-Null Count  Dtype  
 --  ------  --------------  -----  
 0   DGS10   15083 non-null  float64
ty10.describe()
              DGS10
mean       6.291073
std        2.851161
min        1.370000
25%        4.190000
50%        6.040000
...
Importing and Managing Financial Data in Python

10letý dluhopis: časový vývoj

ty10.dropna(inplace=True) # Avoid creation of copy

ty10.plot(title='10-year Treasury'); plt.tight_layout()
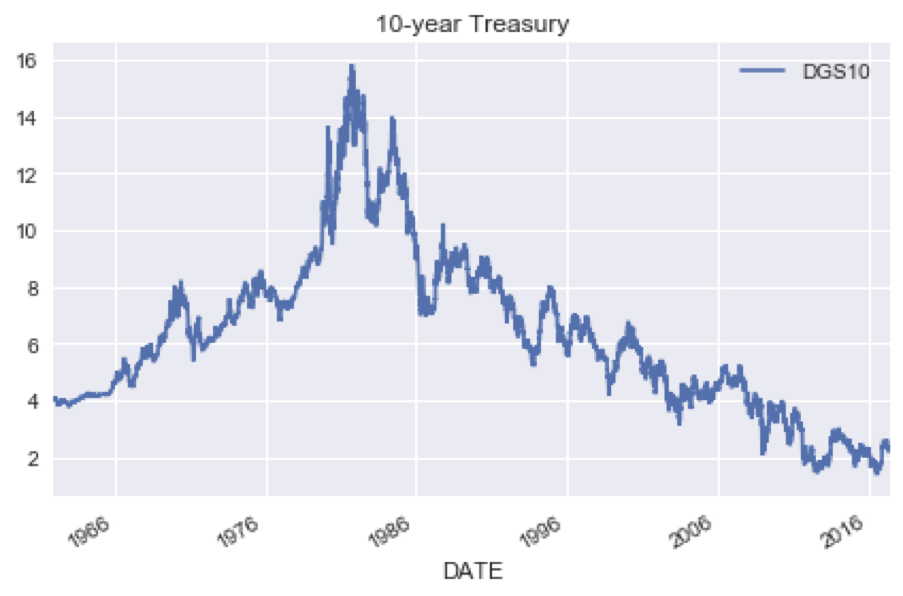
Graf 10letých výnosů

Importing and Managing Financial Data in Python

10letý dluhopis: historická distribuce

import seaborn as sns
sns.distplot(ty10)
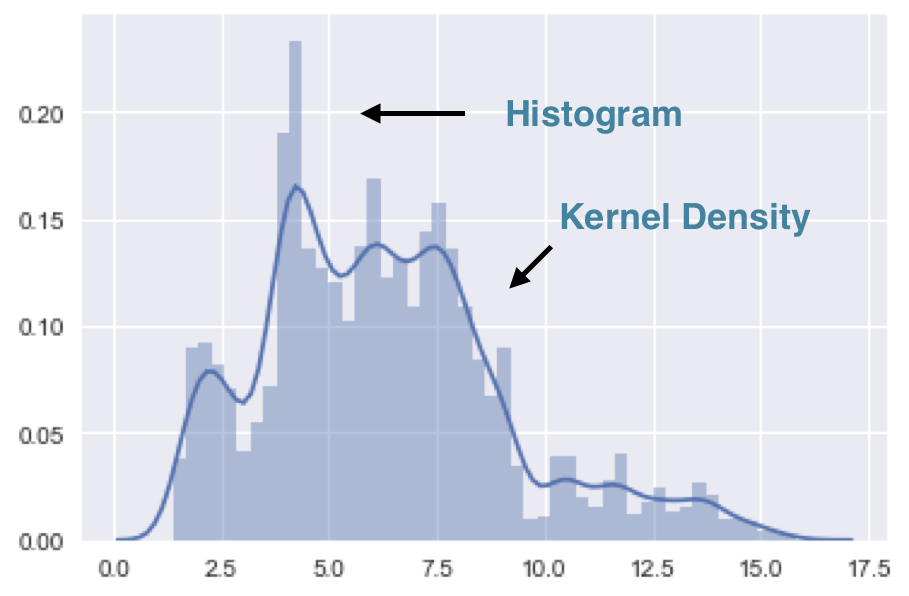
Histogram 10letých výnosů

Importing and Managing Financial Data in Python

10letý dluhopis: trend a distribuce

ax = sns.distplot(ty10)
ax.axvline(ty10['DGS10'].median(), color='black', ls='--')
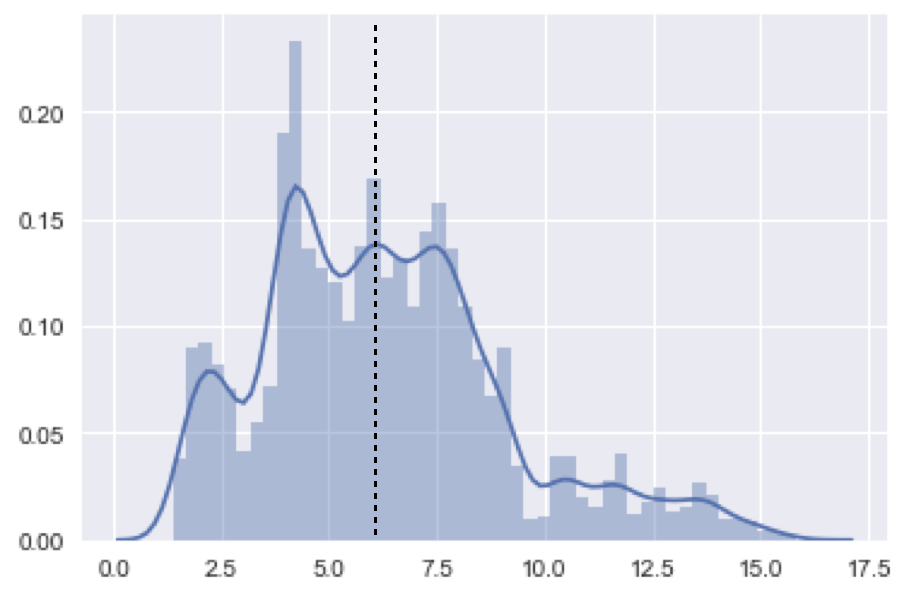
Hustota 10letých výnosů

Importing and Managing Financial Data in Python

Pojďme si procvičit!

Importing and Managing Financial Data in Python

Preparing Video For Download...