HR Analytics: Exploring Employee Data in R
Ben Teusch
HR Analytics Consultant
lm(salary ~ new_hire, data = pay) %>%
    tidy()
# A tibble: 2 × 5
  term        estimate std.error statistic p.value
  <chr>          <dbl>     <dbl>     <dbl>   <dbl>
1 (Intercept)   73425.      577.    127.    0
2 new_hireYes    2650.     1109.      2.39  0.0170
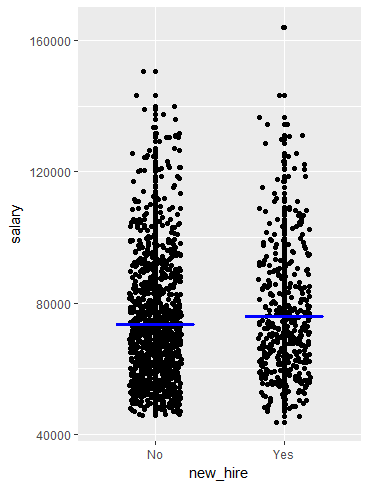
# A tibble: 2 × 2
  new_hire avg_salary
  <chr>         <dbl>
1 No           73425.
2 Yes          76074.
76074.28 - 73424.60
2649.68
lm(salary ~ new_hire + department, data = pay) %>%
    tidy()
# A tibble: 4 × 5
  term              estimate std.error statistic p.value
  <chr>                <dbl>     <dbl>     <dbl>   <dbl>
1 (Intercept)         72844.      679.    107.    0
2 new_hireYes          2649.     1109.      2.39  0.0170
3 departmentFinance    3093.     2457.      1.26  0.208
4 departmentSales      1477.     1082.      1.36  0.173
lm(salary ~ new_hire + department, data = pay) %>% summary()
Call:
lm(formula = salary ~ new_hire + department, data = pay)

Residuals:
   Min     1Q Median     3Q    Max
-31674 -14446  -3629  10657  88580

Coefficients:
                  Estimate Std. Error t value Pr(>|t|)
(Intercept)        72844.0      679.3 107.234   <2e-16 ***
new_hireYes         2649.0     1109.0   2.389    0.017 *
departmentFinance   3092.8     2457.1   1.259    0.208
departmentSales     1477.2     1082.5   1.365    0.173

Signif. codes:  0 '***' 0.001 '**' 0.01 '*' 0.05 '.' 0.1 ' ' 1

Residual standard error: 18890 on 1466 degrees of freedom
Multiple R-squared:  0.005923,    Adjusted R-squared:  0.003889
F-statistic: 2.912 on 3 and 1466 DF,  p-value: 0.03338