Seaborn
Python pro uživatele R

Daniel Chen
Instructor
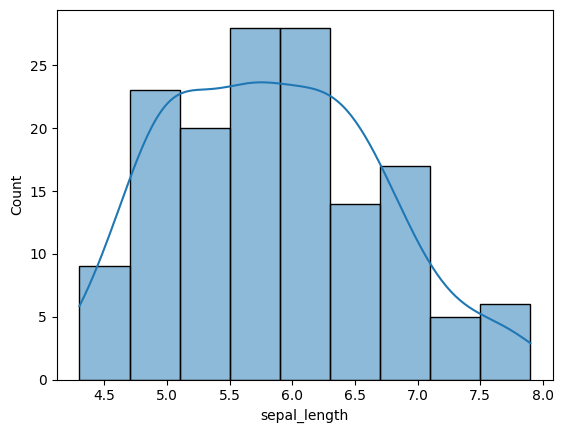
Seaborn histogramy
import seaborn as sns
import matplotlib.pyplot as plt
sns.histplot(iris['sepal_length'], kde = True)
plt.show()
Seaborn graf počtů
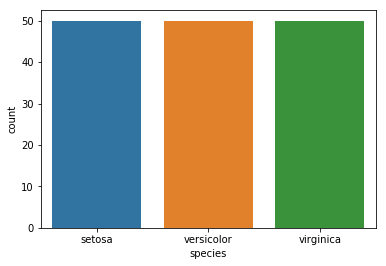
sns.countplot('species', data=iris)
plt.show()
Seaborn krabicové grafy
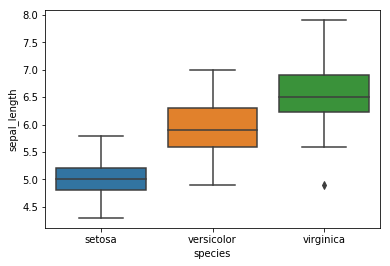
sns.boxplot(x='species', y='sepal_length', data=iris)
plt.show()
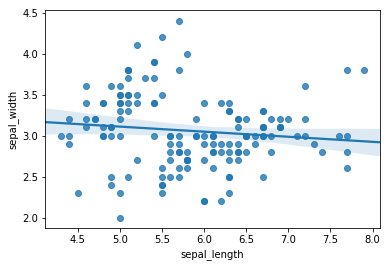
Seaborn bodové grafy
sns.regplot(x='sepal_length', y='sepal_width', data=iris)
plt.show()
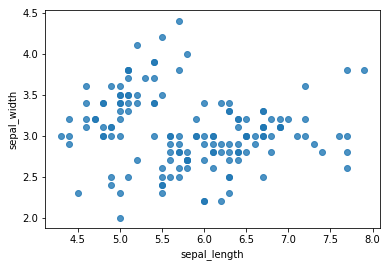
Seaborn bodové grafy bez regresní přímky
sns.regplot(x='sepal_length', y='sepal_width', data=iris,
            fit_reg=False)
plt.show()
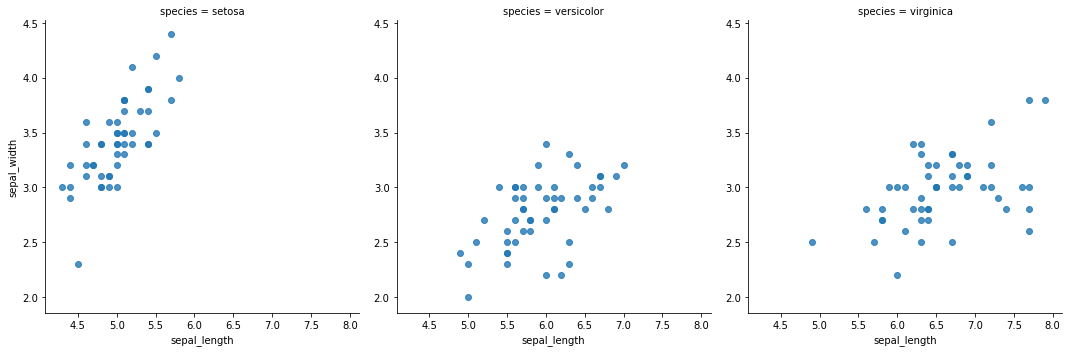
Seaborn facety
sns.lmplot(x='sepal_length', y='sepal_width', data=iris,
           fit_reg=False,
           col='species')
plt.show()
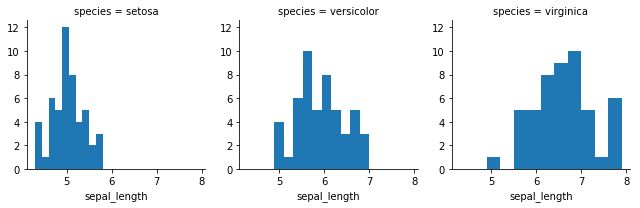
Seaborn FacetGrid
g = sns.FacetGrid(iris, col="species")
g = g.map(plt.hist, "sepal_length")
plt.show()