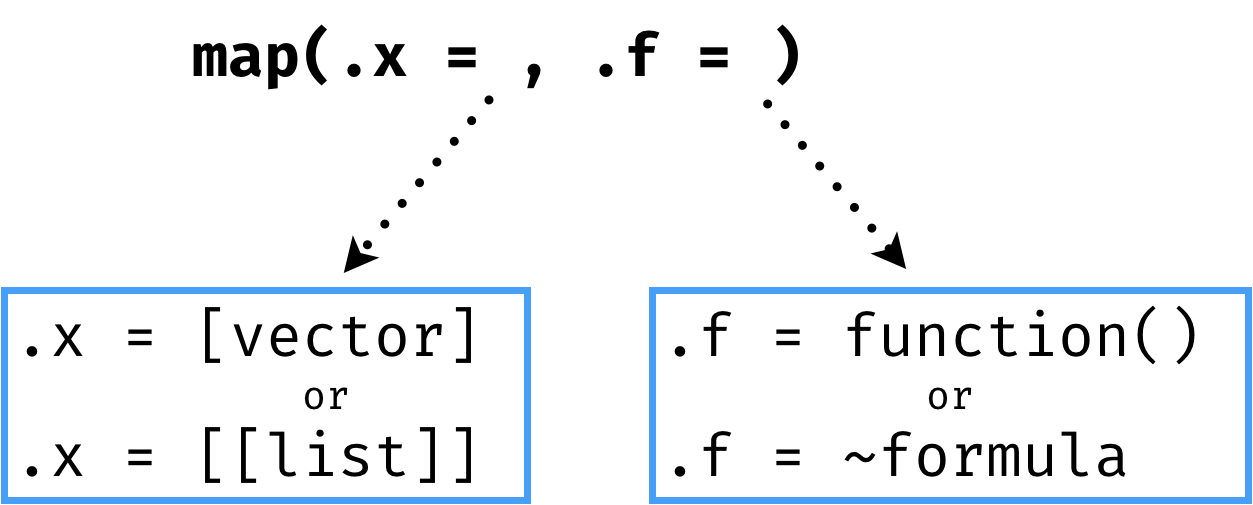
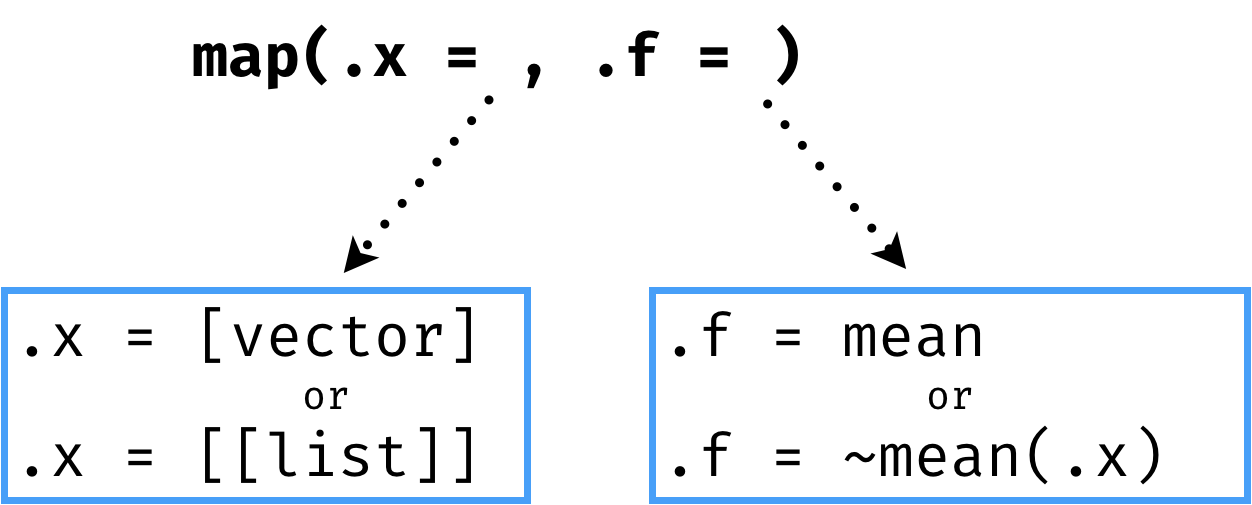
Rodina funkcí map

Machine Learning in the Tidyverse

Dmitriy (Dima) Gorenshteyn

Lead Data Scientist, Memorial Sloan Kettering Cancer Center

Pracovní postup se sloupcovými seznamy

Machine Learning in the Tidyverse

Pracovní postup se sloupcovými seznamy

Machine Learning in the Tidyverse

Funkce map

Machine Learning in the Tidyverse

Funkce map

Machine Learning in the Tidyverse

Funkce map

Machine Learning in the Tidyverse

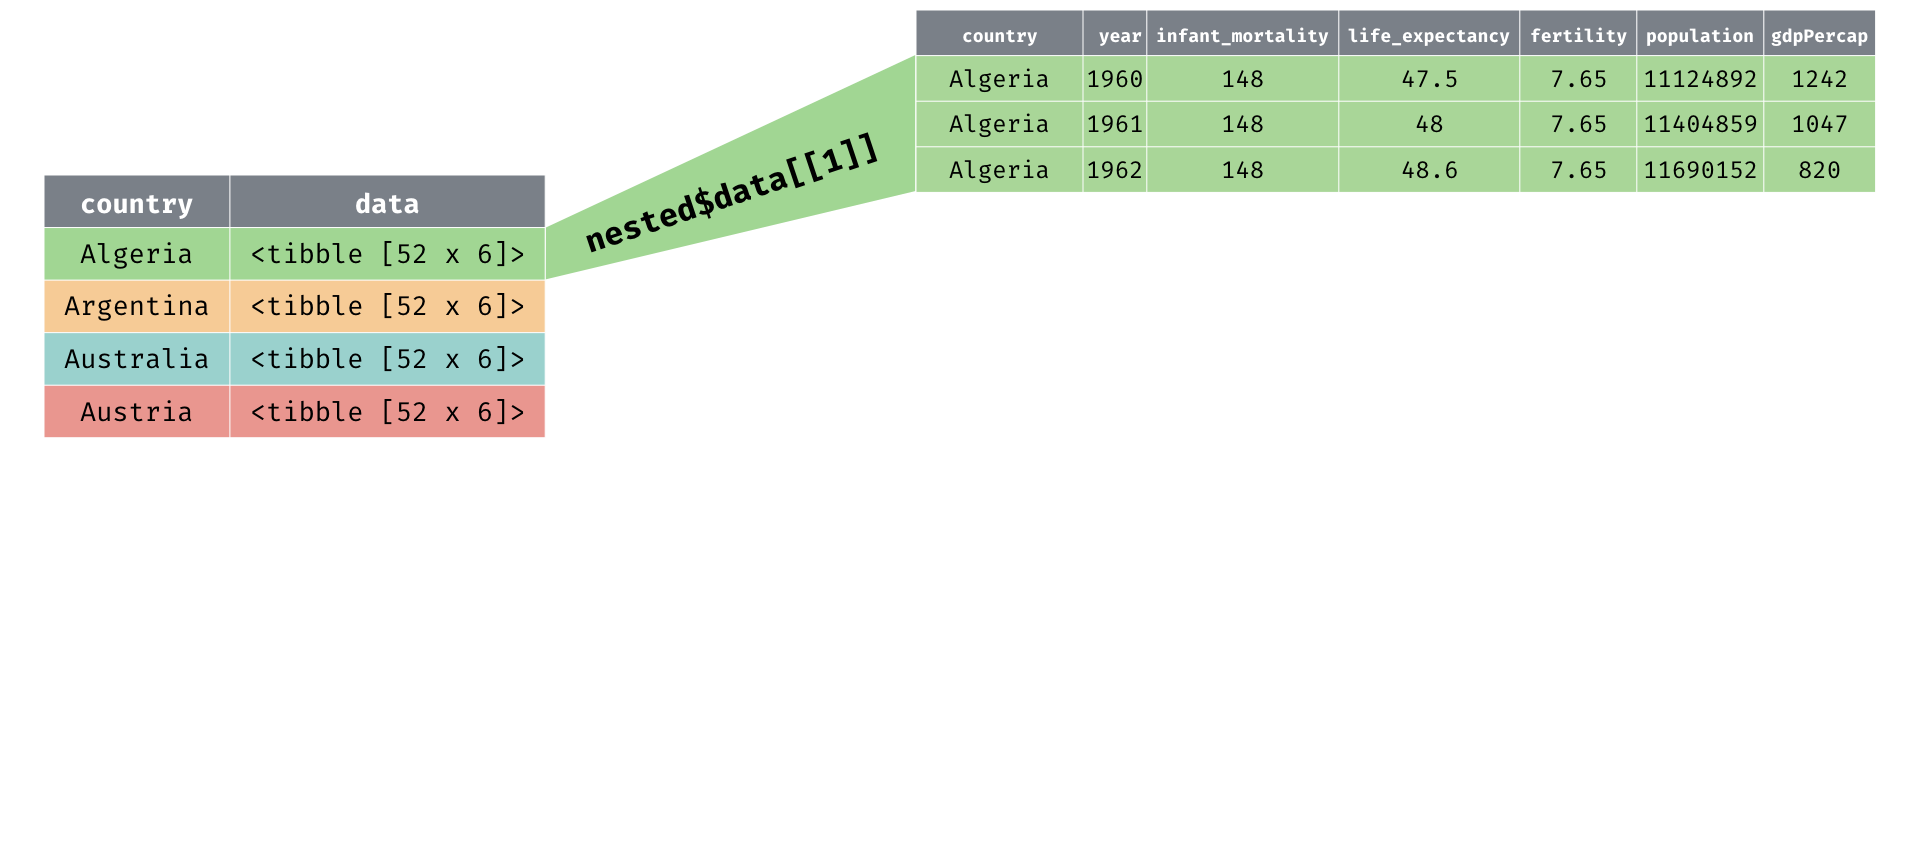
Průměr populace podle země

mean(nested$data[[1]]$population)
[1] 23129438
Machine Learning in the Tidyverse

Průměr populace podle země

map(.x = nested$data, .f = ~mean(.x$population))
[[1]]
[1] 23129438

[[2]]
[1] 30783053

[[3]]
[1] 16074837

[[4]]
[1] 7746272
Machine Learning in the Tidyverse

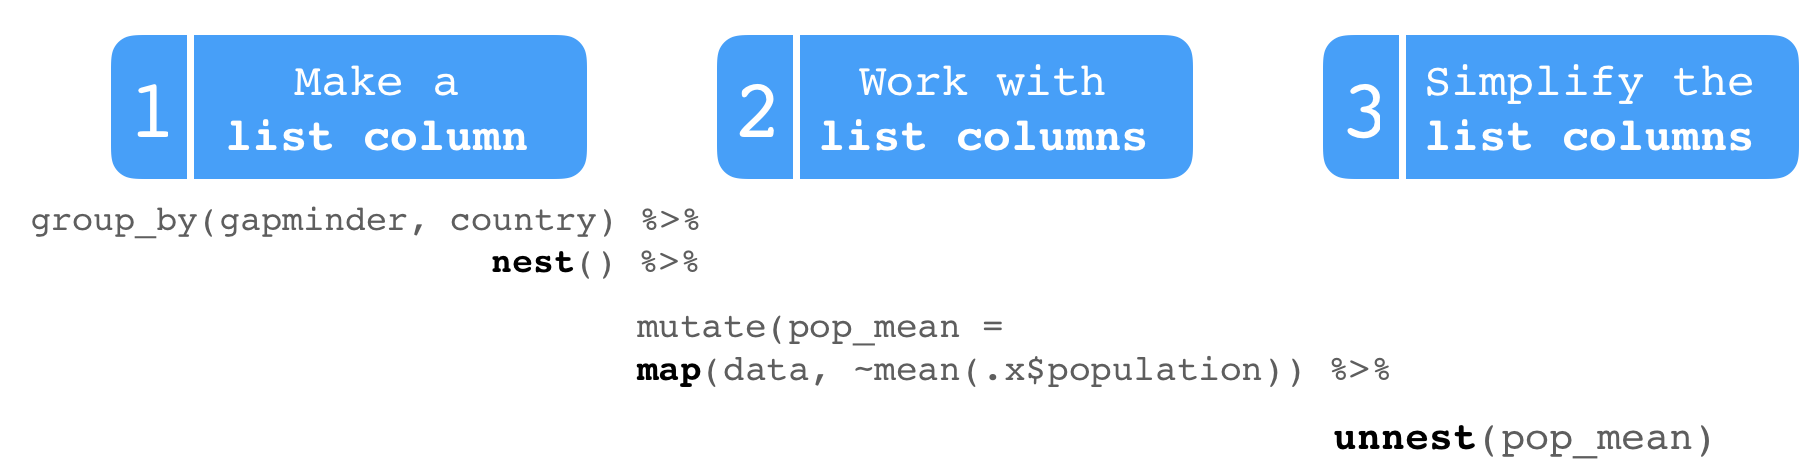
2: Práce se sloupcovými seznamy – map() a mutate()

pop_df <- nested %>% 
  mutate(pop_mean = map(data, ~mean(.x$population)))

pop_df
# A tibble: 77 x 3
   country    data              pop_mean 
   <fct>      <list>            <list>   
 1 Algeria    <tibble [52 × 6]> <dbl [1]>
 2 Argentina  <tibble [52 × 6]> <dbl [1]>
 3 Australia  <tibble [52 × 6]> <dbl [1]>
 4 Austria    <tibble [52 × 6]> <dbl [1]>
 5 Bangladesh <tibble [52 × 6]> <dbl [1]>
Machine Learning in the Tidyverse

3: Zjednodušení sloupcových seznamů – unnest()

pop_df %>% 
  unnest(pop_mean)
# A tibble: 77 x 3
   country    data               pop_mean
   <fct>      <list>                <dbl>
 1 Algeria    <tibble [52 × 6]>  23129438
 2 Argentina  <tibble [52 × 6]>  30783053
 3 Australia  <tibble [52 × 6]>  16074837
 4 Austria    <tibble [52 × 6]>   7746272
 5 Bangladesh <tibble [52 × 6]>  97649407
Machine Learning in the Tidyverse

Pracovní postup se sloupcovými seznamy
Machine Learning in the Tidyverse

Práce se sloupcovými seznamy a jejich zjednodušení pomocí map_*()

funkce vrací
map() list
map_dbl() double
map_lgl() logical
map_chr() character
map_int() integer
Machine Learning in the Tidyverse

Práce se sloupcovými seznamy a jejich zjednodušení pomocí map_dbl()

nested %>% 
  mutate(pop_mean = map_dbl(data, ~mean(.x$population)))
# A tibble: 77 x 3
   country    data               pop_mean
   <fct>      <list>                <dbl>
 1 Algeria    <tibble [52 × 6]>  23129438
 2 Argentina  <tibble [52 × 6]>  30783053
 3 Australia  <tibble [52 × 6]>  16074837
 4 Austria    <tibble [52 × 6]>   7746272
 5 Bangladesh <tibble [52 × 6]>  97649407
Machine Learning in the Tidyverse

Tvorba modelů pomocí map()

nested %>%
   mutate(model = map(data, ~lm(formula = population~fertility, 
             data = .x)))
# A tibble: 77 x 3
   country    data              model   
   <fct>      <list>            <list>  
 1 Algeria    <tibble [52 × 6]> <S3: lm>
 2 Argentina  <tibble [52 × 6]> <S3: lm>
 3 Australia  <tibble [52 × 6]> <S3: lm>
 4 Austria    <tibble [52 × 6]> <S3: lm>
 5 Bangladesh <tibble [52 × 6]> <S3: lm>
Machine Learning in the Tidyverse

Pojďme něco zmapovat!

Machine Learning in the Tidyverse

Preparing Video For Download...