Vizualizace metrik

Market Basket Analysis v R

Christopher Bruffaerts

Statistician

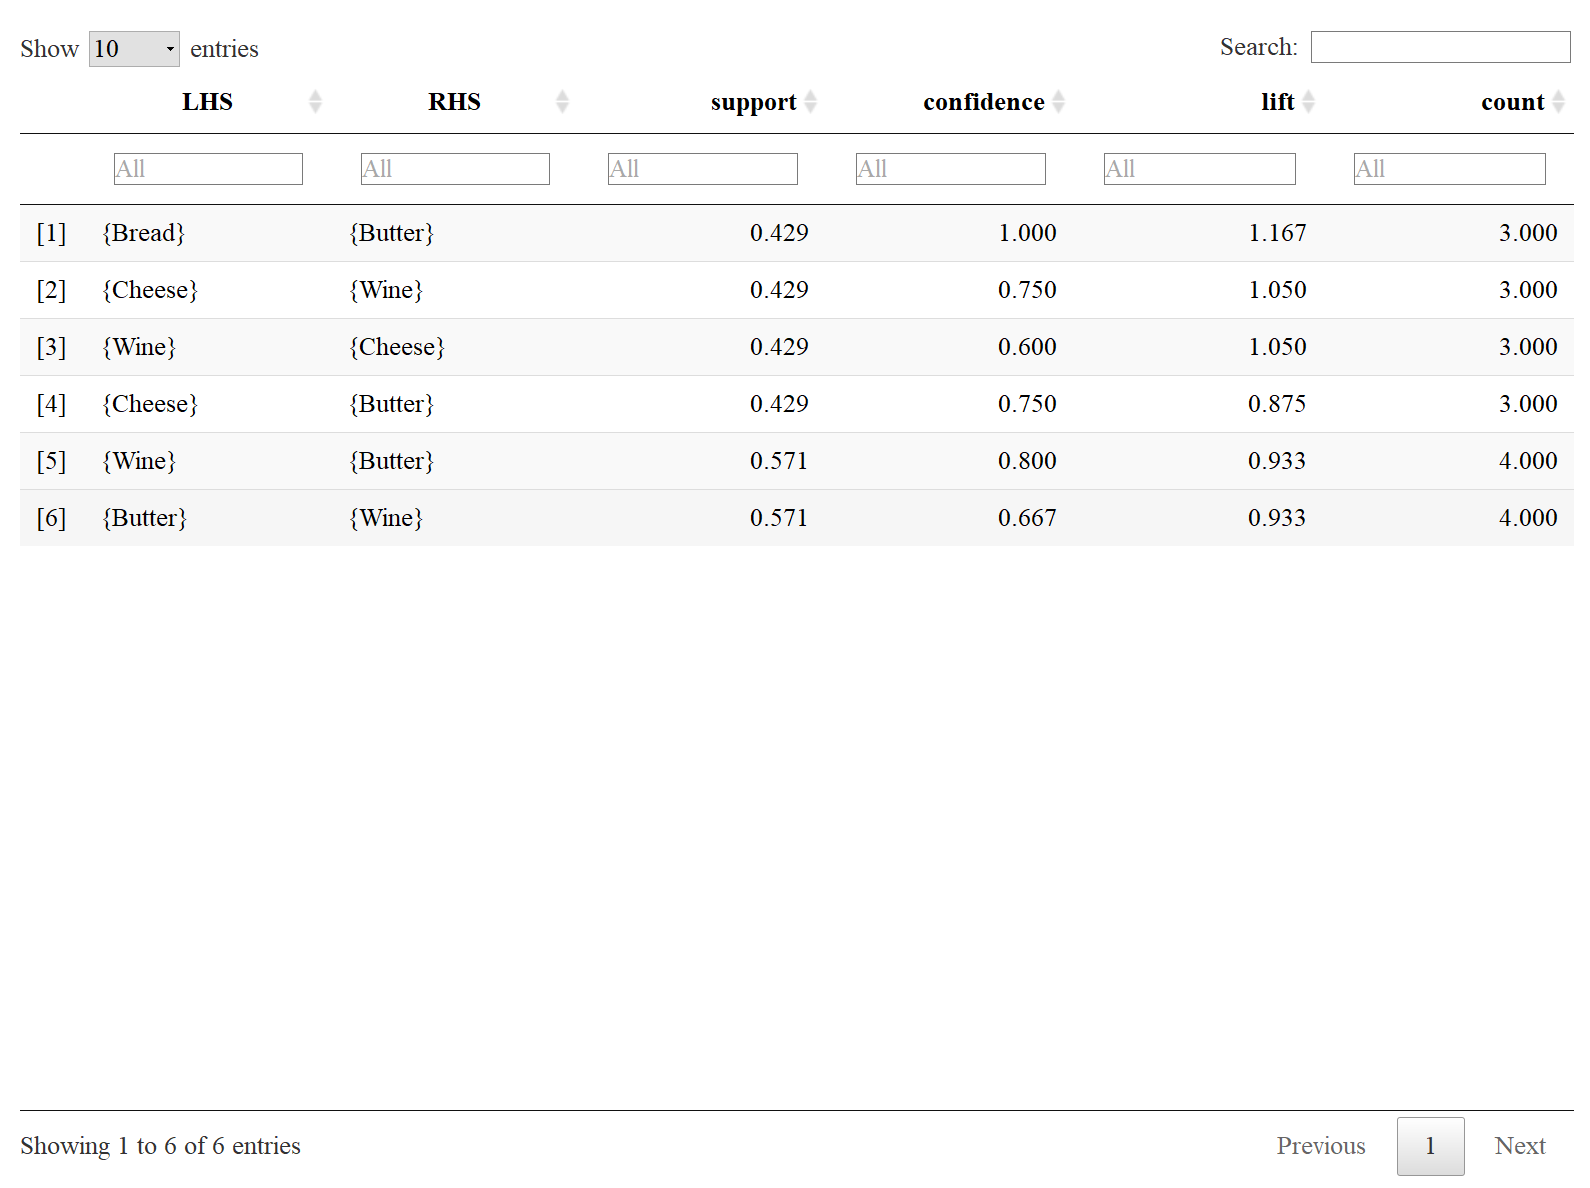
Interaktivní tabulka s metrikami

Pravidla z obchodu s potravinami

library(arules)
rules = apriori(data_trx, 
                parameter = list(
                  supp = 3/7, conf=0.6, minlen=2)
                )
inspect(rules)

Interaktivní tabulka

library(arulesViz)
inspectDT(rules)

Tabulka HTML

tabulka inspectDT pravidel

Market Basket Analysis v R

Úvod do bodových grafů

Prohlídka pravidel

inspect(rules)
    lhs         rhs      support   confidence lift      count
[1] {Bread}  => {Butter} 0.4285714 1.0000000  1.1666667 3    
[2] {Cheese} => {Wine}   0.4285714 0.7500000  1.0500000 3    
[3] {Wine}   => {Cheese} 0.4285714 0.6000000  1.0500000 3    
[4] {Cheese} => {Butter} 0.4285714 0.7500000  0.8750000 3    
[5] {Wine}   => {Butter} 0.5714286 0.8000000  0.9333333 4    
[6] {Butter} => {Wine}   0.5714286 0.6666667  0.9333333 4

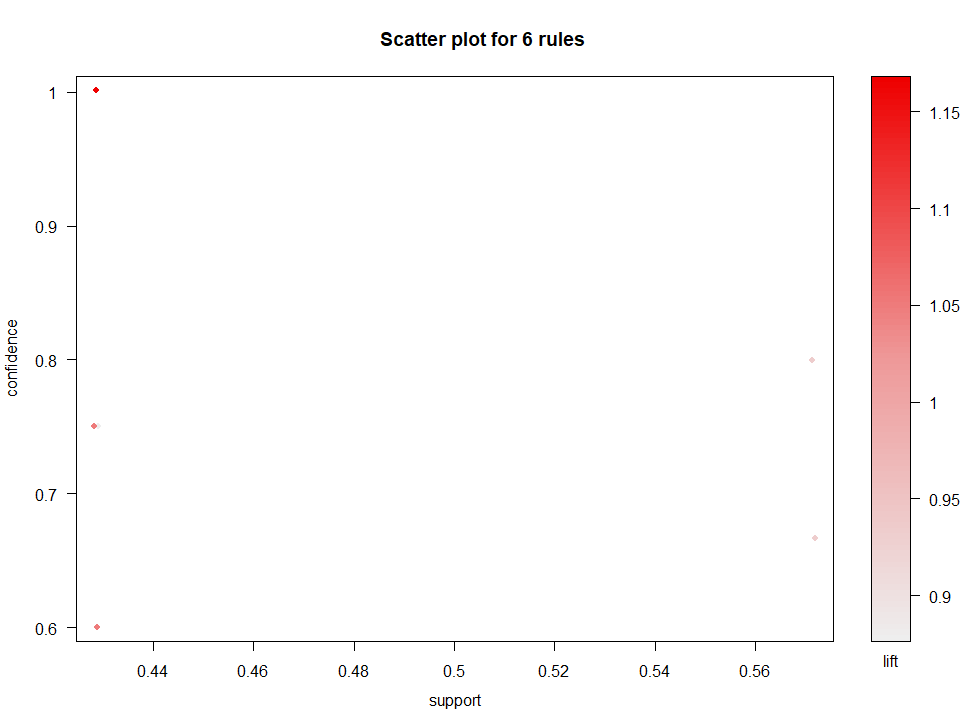
Bodový graf z arulesViz

plot(rules)

bodový graf obchod s potravinami

Market Basket Analysis v R

Flexibilní grafy arules

Parametry funkce plot

plot(rulesObject, measure, shading, method)
  • rulesObject: objekt pravidel k vykreslení
  • measure: míry zajímavosti pravidel (Support, Confidence, lift,...)
  • shading: míra použitá pro barevné odlišení bodů.
  • method: metoda vizualizace ("scatterplot", "matrix", "two-key plot", "matrix3D")

Příklad

plot(rules, measure = c("confidence", "lift"),
     shading = "support",
     method = "scatterplot")
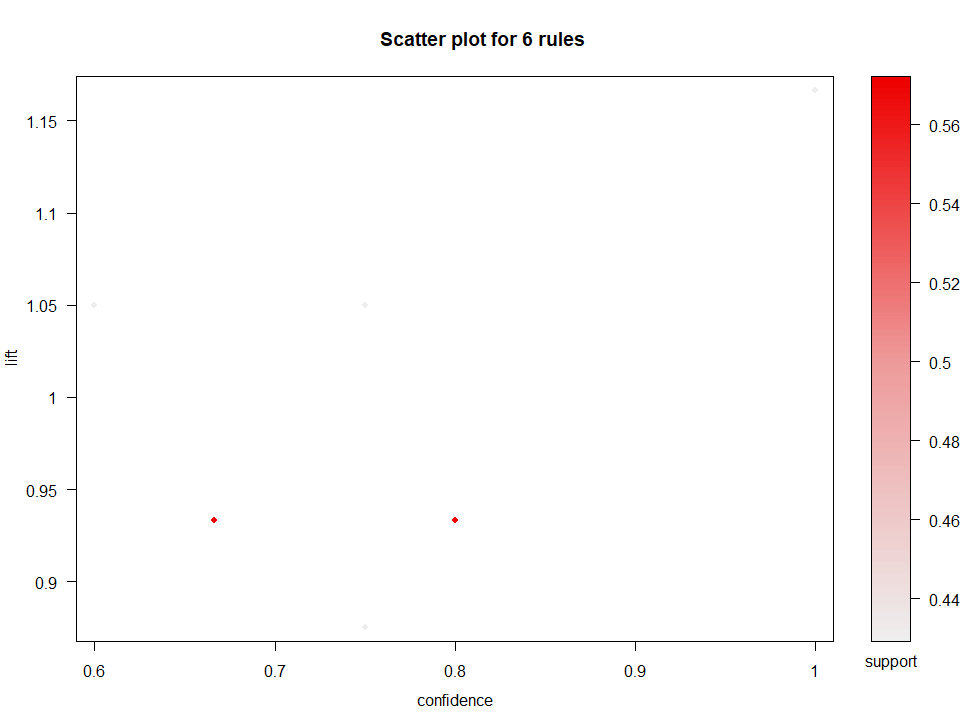
bodový graf obchod s potravinami – plot

Market Basket Analysis v R

Další grafy arules

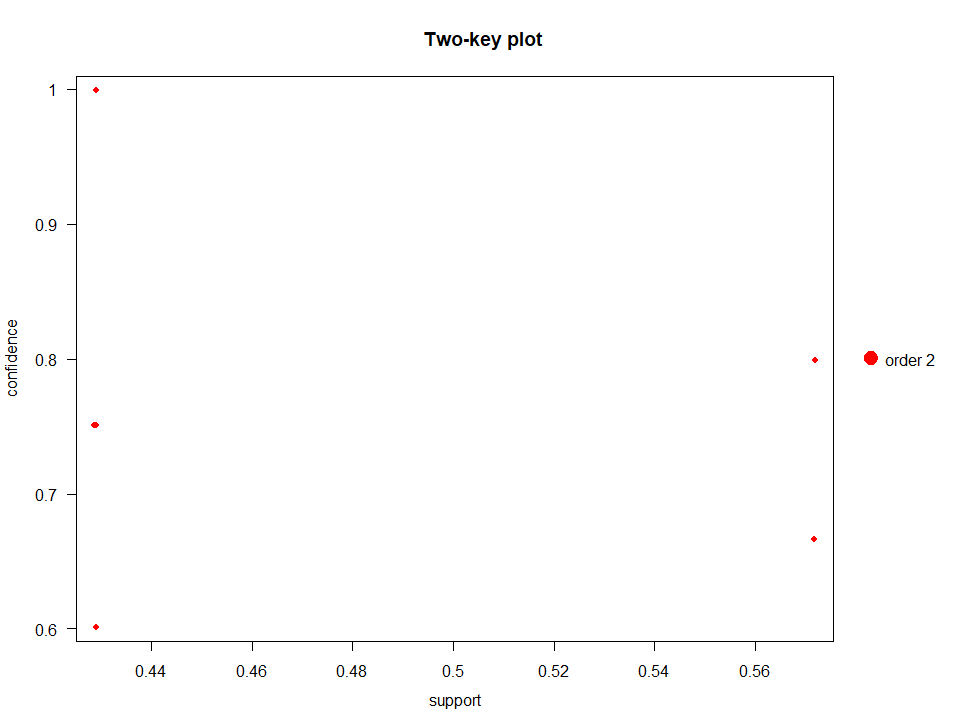
Graf dvou klíčů

plot(rules, method = "two-key plot")

graf dvou klíčů

Market Basket Analysis v R

Jittering grafů

Bez jitteringu

plot(rules, method = "two-key plot")

graf dvou klíčů

S jitteringem

plot(rules, method = "two-key plot",jitter = 2)
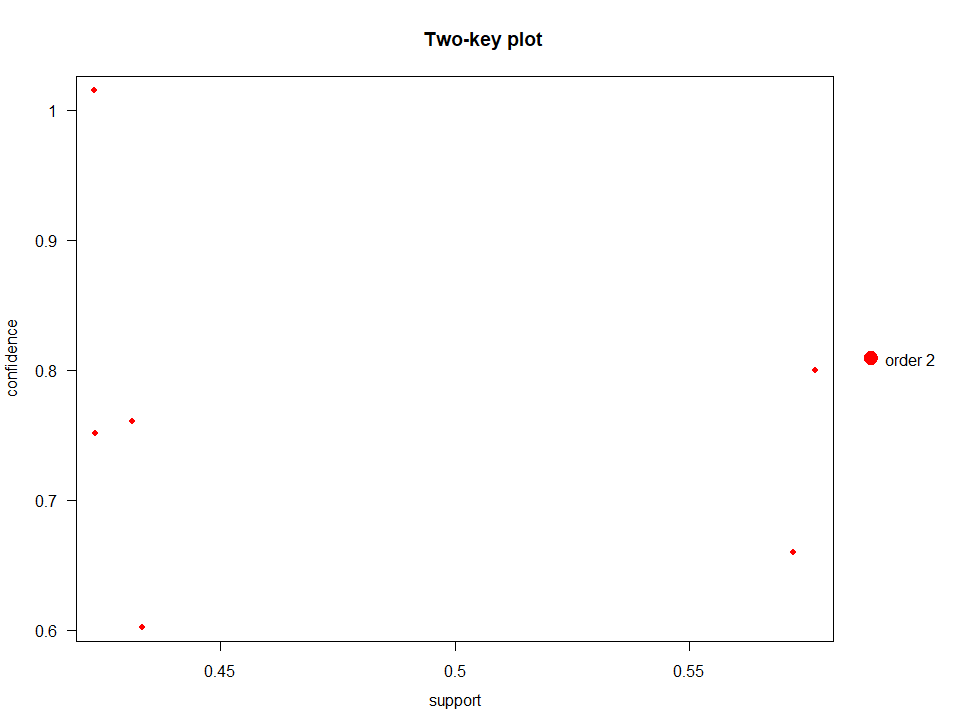
graf dvou klíčů s jitteringem

Market Basket Analysis v R

Interaktivní grafy arules

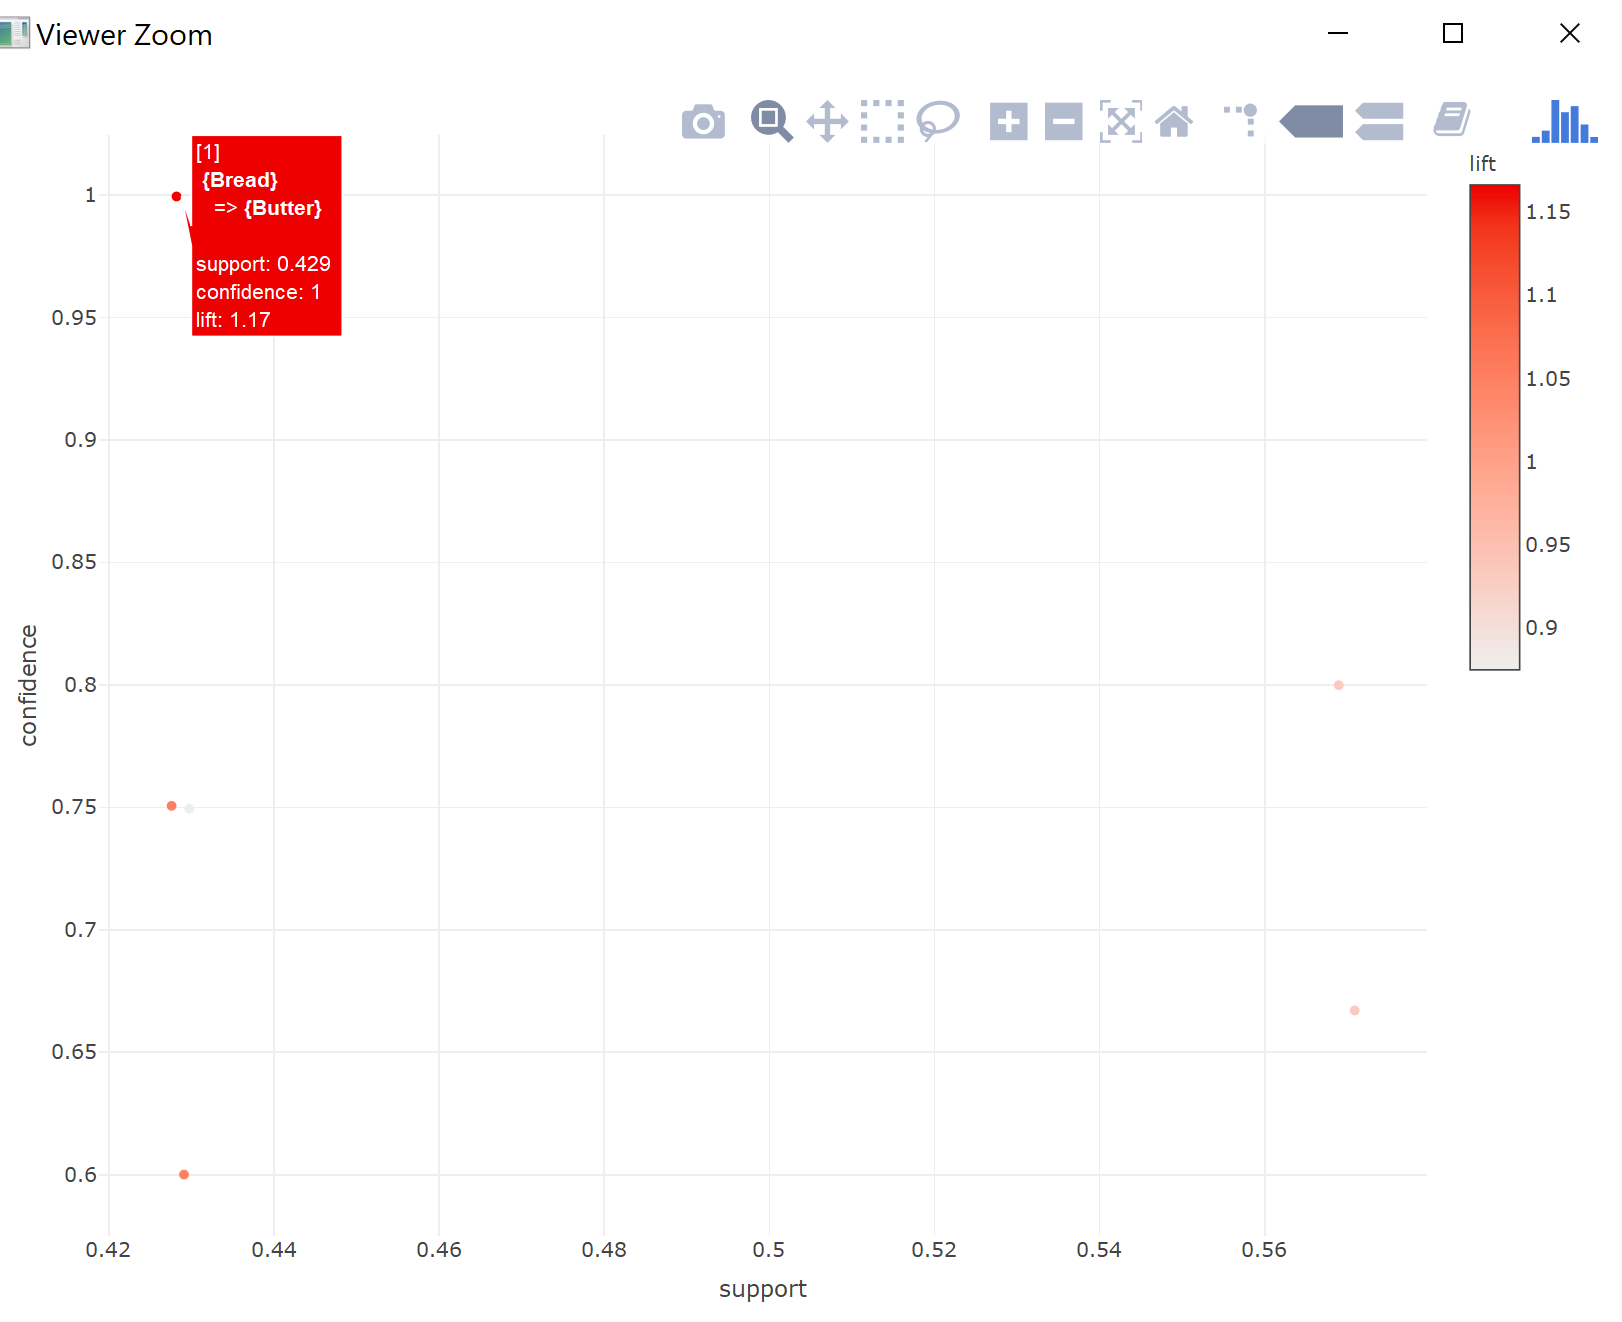
Interaktivní pravidla

plot(rules, engine = "plotly")

Ze statického na interaktivní

interaktivní pravidla plotly

Market Basket Analysis v R

Pojďme vizualizovat metriky!

Market Basket Analysis v R

Preparing Video For Download...