Rekapitulace transakcí

Market Basket Analysis v R

Christopher Bruffaerts

Statistician

Důležité aspekty analýzy nákupního košíku

Analýza nákupního košíku

Důraz na co, nikoli na kolik;
tj. co mají zákazníci v košíku?
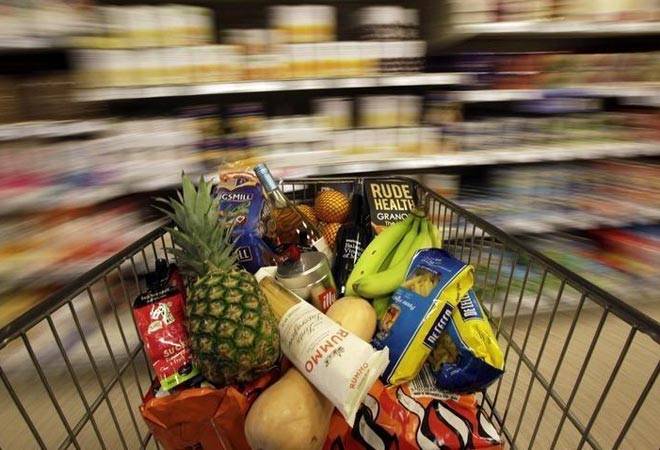
one_grocery_basket

Hlavní metriky

  • Support
  • Confidence
  • Lift

Upozornění

Sada extrahovaných pravidel může být velmi rozsáhlá!
V takovém případě nezobrazujte všechna pravidla – vždy pracujte s podmnožinou nebo použijte funkce head či tail!

Market Basket Analysis v R

Datová sada Groceries

Zpět do obchodu s potravinami
Groceries

Datová sada z balíčku arules

# Loading the arules package
library(arules)

# Loading the Groceries dataset
data(Groceries)
summary(Groceries)
Market Basket Analysis v R

Souhrn datové sady Groceries

transactions as itemMatrix in sparse format with
 9835 rows (elements/itemsets/transactions) and
 169 columns (items) and a density of 0.02609146 

most frequent items:
      whole milk other vegetables       rolls/buns             soda           yogurt 
            2513             1903             1809             1715             1372 
         (Other) 
           34055 

element (itemset/transaction) length distribution:
sizes
   1    2    3    4    5    6    7    8    9   10   11   12   13   14   15   16   17 
2159 1643 1299 1005  855  645  545  438  350  246  182  117   78   77   55   46   29 
  18   19   20   21   22   23   24   26   27   28   29   32 
  14   14    9   11    4    6    1    1    1    1    3    1 

   Min. 1st Qu.  Median    Mean 3rd Qu.    Max. 
  1.000   2.000   3.000   4.409   6.000  32.000 

includes extended item information - examples:
       labels  level2           level1
1 frankfurter sausage meat and sausage
2     sausage sausage meat and sausage
3  liver loaf sausage meat and sausage
Market Basket Analysis v R

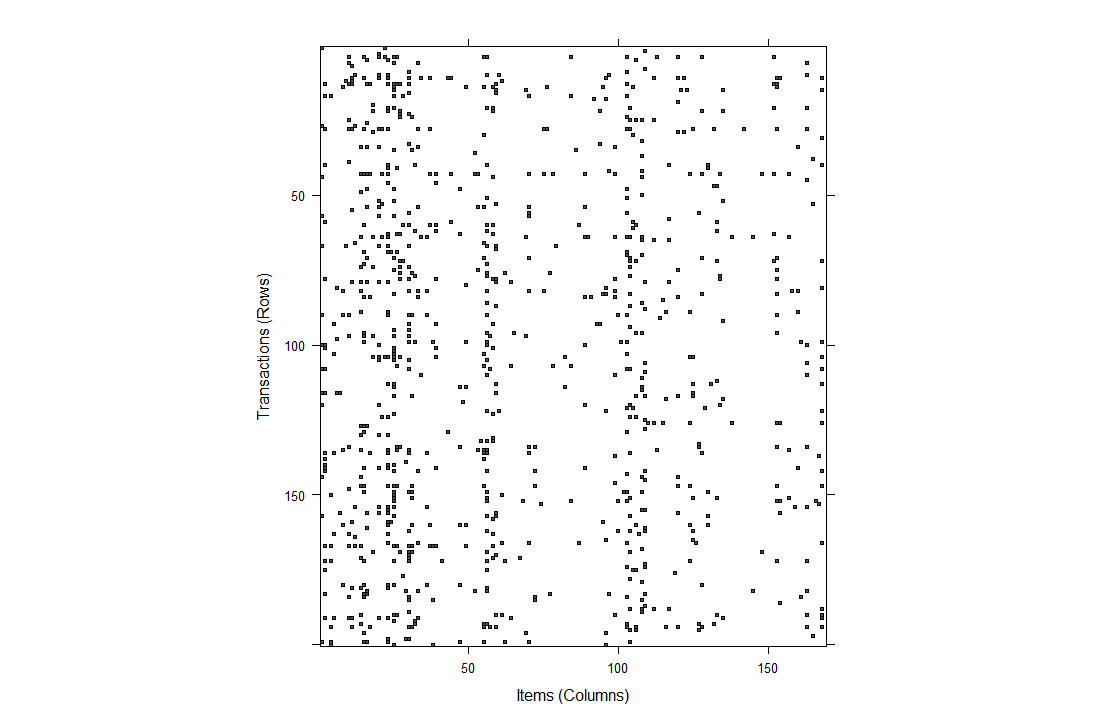
Hustota datové sady Groceries

# Plotting a sample of 200 transactions
image(sample(Groceries, 200))
image_groceries_200

1 Hustota matice položek je 2,6 %.
Market Basket Analysis v R

Nejoblíbenější a nejméně oblíbené položky

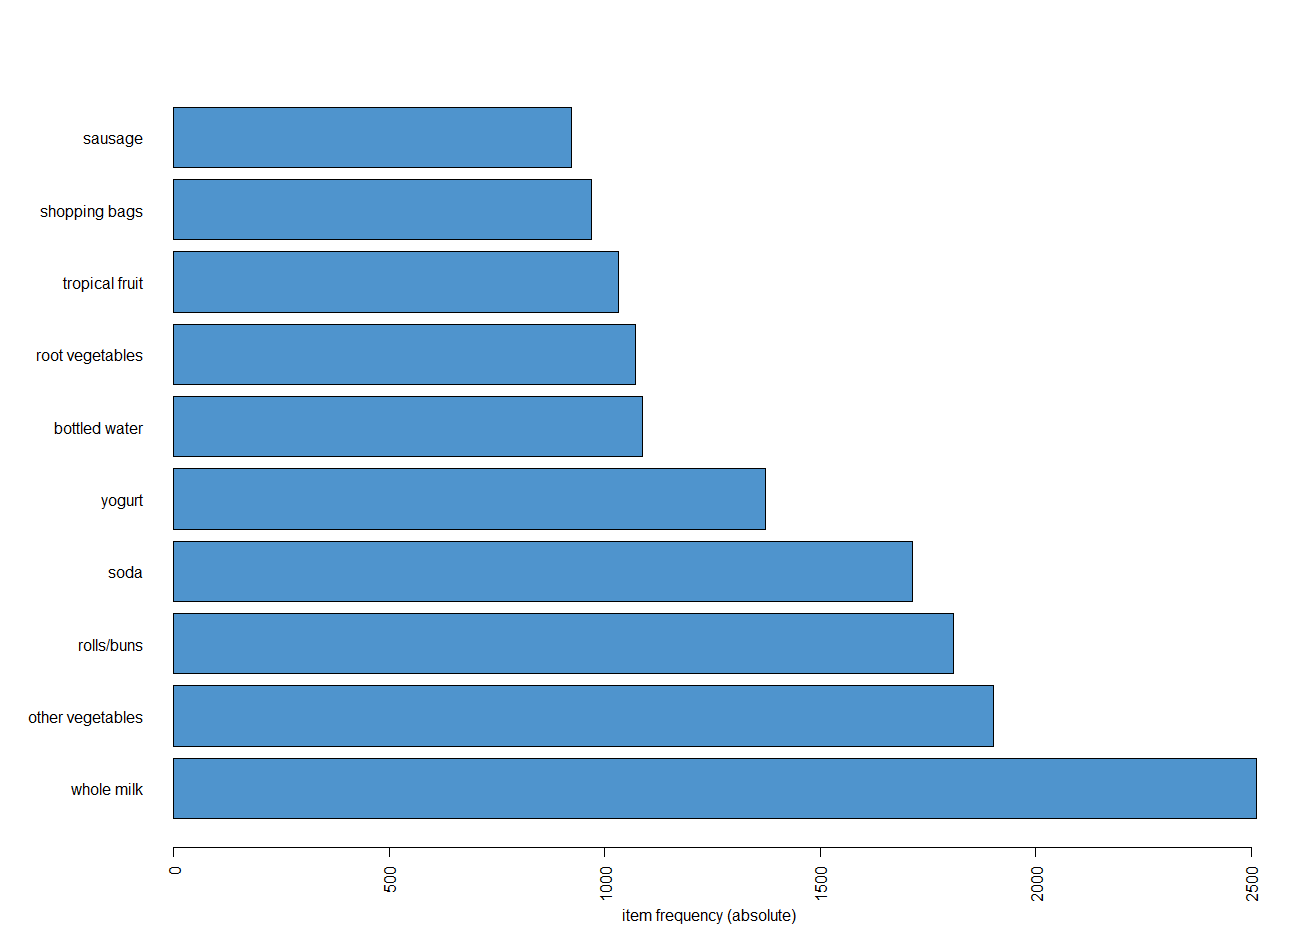
Nejoblíbenější položky

itemFrequencyPlot(Groceries,type="relative",
                  topN=10,horiz=TRUE,col='steelblue3')
itemFreqPlot_groceries

Nejméně oblíbené položky

par(mar=c(2,10,2,2), mfrow=c(1,1))
barplot(sort(table(unlist(LIST(Groceries))))[1:10],
        horiz = TRUE,las = 1,col='orange')
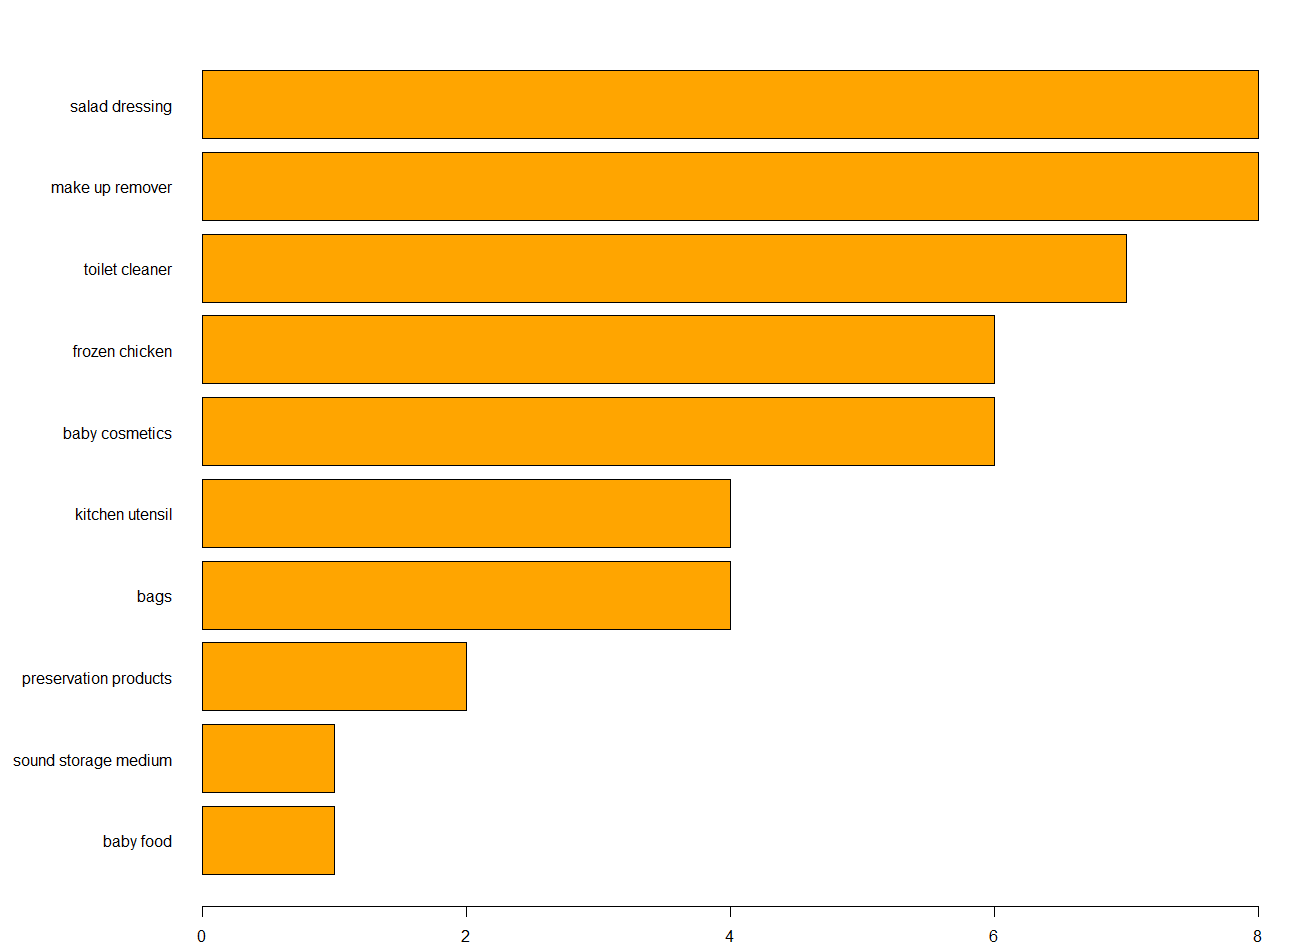
itemFreqPlot_groceries_leas

Market Basket Analysis v R

Křížové tabulky podle indexu

Kontingenční tabulky

# Contingency table
tbl = crossTable(Groceries)
tbl[1:4,1:4]
            frankfurter sausage liver loaf ham
frankfurter         580      99          7  25
sausage              99     924         10  49
liver loaf            7      10         50   3
ham                  25      49          3 256

Seřazená kontingenční tabulka

# Sorted contingency table
tbl = crossTable(Groceries, sort = TRUE)
tbl[1:4,1:4]
                whole milk other vegetables rolls/buns soda
whole milk             2513              736        557  394
other vegetables        736             1903        419  322
rolls/buns              557              419       1809  377
soda                    394              322        377 1715
Market Basket Analysis v R

Křížové tabulky podle názvů položek

Kontingenční tabulky

# Counts
tbl['whole milk','flour']
[1] 83
# Chi-square test
crossTable(Groceries, measure='chi')['whole milk', 'flour']
[1] 0.003595389

Kontingenční tabulky s dalšími metrikami

crossTable(Groceries, measure='lift',sort=T)[1:4,1:4]
                 whole milk other vegetables rolls/buns      soda   
whole milk               NA        1.5136341   1.205032 1.571735
other vegetables  1.5136341               NA   1.197047 0.9703476 
rolls/buns        1.2050318        1.1970465         NA 1.1951242 
soda              0.8991124        0.9703476   1.195124        NA
Market Basket Analysis v R

Datová sada MovieLens

MovieLens: Webový doporučovací systém filmů pro své uživatele.
movielens

Market Basket Analysis v R

Pojďme se dívat na filmy!

Market Basket Analysis v R

Preparing Video For Download...