Váš první shinydashboard

Tvorba dashboardů pomocí shinydashboard

Png Kee Seng

Researcher

Dosavadní postup

  • Wireframing uživatelského rozhraní (UI)
    • Záhlaví, postranní panel, tělo
  • Definování výstupů a jejich interakce se vstupy uživatele
  • Tuto roli plní server

drawing

header <- dashboardHeader(...)
sidebar <- dashboardSidebar(...)
body <- dashboardBody(...)

ui <- dashboardPage(header, sidebar, body)
server <- function(input, output) { ... }
shinyApp(ui, server)
Tvorba dashboardů pomocí shinydashboard

Server

  • Je třeba definovat výstupy a vstupy
  • Určit výstupy a způsob interakce s uživatelskými vstupy
  • Vlastní pomocné funkce snižují nepřehlednost a zlepšují čitelnost
    • Umístěte pomocné funkce na začátek kódu

Server je jako číšník, který předává vaše pokyny do kuchyně. Server v shinyApp říká R, jak mají vstupy interagovat s výstupy.

Tvorba dashboardů pomocí shinydashboard

Přidání grafu

  • Zpět k dashboardu fotbalového turnaje
  • Přidáme hexbin graf pro tým 1
  • Graf umístíme do serveru
  • Co když chceme stejný graf pro tým 2?
soccer %>%
  ggplot(aes(x=`1_passes_compeletd`, 
             y=`1_goal_prevented`)) +
  geom_hex(bins=10) + theme_classic()
server <- function(input, output){
  output$plot1 <- renderPlot({
  fifa %>%
    ggplot(aes(x=`1_passes_compeletd`, 
               y=`1_goal_prevented`)) +
    geom_hex(bins=10) + theme_classic()
  })
}
Tvorba dashboardů pomocí shinydashboard

Definování objektů ggplot v serveru

server <- function(input, output) {
  output$plot1 <- renderPlot({
    if (input$team == 1){

fifa %>% ggplot(aes(x=`1_passes_compeletd`, y=`1_goal_prevented`)) + geom_hex(bins=10) + theme_classic()
} else if (input$team == 2){
fifa %>% ggplot(aes(x=`2_passes_compeletd`, y=`2_goal_prevented`)) + geom_hex(bins=10) + theme_classic()
} }) }
Tvorba dashboardů pomocí shinydashboard

Použití pomocných funkcí

plot_hex <- function(team){
  if (team == 1){
    soccer %>% ggplot(aes(x=`1_passes_compeletd`, 
                        y=`1_goal_prevented`)) +
      geom_hex(bins=10) + theme_classic()
  }
  else if (team == 2){
    soccer %>% ggplot(aes(x=`2_passes_compeletd`, 
                        y=`2_goal_prevented`)) +
      geom_hex(bins=10) + theme_classic()
  }
}
Tvorba dashboardů pomocí shinydashboard

Použití pomocných funkcí

S pomocnou funkcí

server <- function(input, output) {
  output$plot1 <- renderPlot(plot_hex(input$team)) 
}
  • Není to přehlednější?

Bez pomocné funkce

server <- function(input, output) {
  output$plot1 <- renderPlot({
    if (input$team == 1){
      soccer %>% ggplot(aes(x=`1_passes_compeletd`, 
              y=`1_goal_prevented`)) +
        geom_hex(bins=10) + theme_classic()
      }
    else if (input$team == 2){
      soccer %>% ggplot(aes(x=`2_passes_compeletd`, 
              y=`2_goal_prevented`)) +
        geom_hex(bins=10) + theme_classic()
      }
    })
}
Tvorba dashboardů pomocí shinydashboard

Vše dohromady

# A complete shinydashboard

header <- dashboardHeader(title = "Soccer tournament")
sidebar <- dashboardSidebar(sidebarMenu(menuItem("Passes/goals", tabName = "passtab"), menuItem("Empty", tabName = "emptytab")))
body <- dashboardBody(tabItems( tabItem("passtab", fluidRow(box(selectInput("team", "Team number", choices = c(1,2))), box(plotOutput("plot1"))) ), tabItem("emptytab")) )
ui <- dashboardPage(header, sidebar, body)
server <- function(input, output) { output$plot1 <- renderPlot(plot_hex(input$team)) }
shinyApp(ui, server)
Tvorba dashboardů pomocí shinydashboard

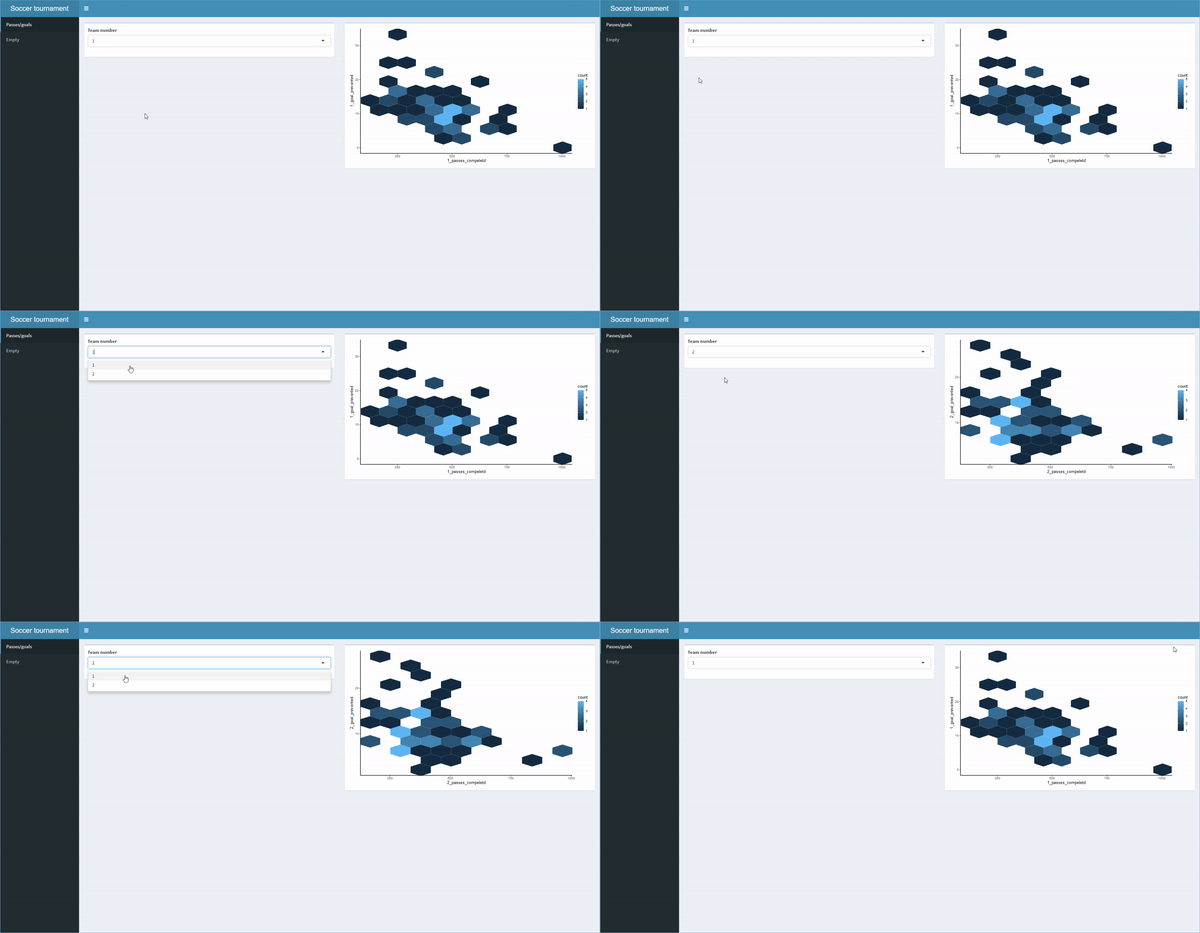
Animace zobrazující výsledný shinydashboard. Uživatel může přepínat mezi záložkami a zadávat vstupy pro různé výstupy.

Tvorba dashboardů pomocí shinydashboard

Pojďme procvičovat!

Tvorba dashboardů pomocí shinydashboard

Preparing Video For Download...