Multivariate Probability Distributions in R
Surajit Ray
Professor, University of Glasgow
summary(cars.pca)
Importance of components:
Comp.1 Comp.2 Comp.3 Comp.4 Comp.5 Comp.6 Comp.7 Comp.8 Comp.9
Standard deviation 2.378 1.443 0.710 0.5148 0.4280 0.3518 0.3241 0.2419 0.14896
Proportion of Variance 0.628 0.231 0.056 0.0294 0.0204 0.0138 0.0117 0.0065 0.00247
Cumulative Proportion 0.628 0.860 0.916 0.9453 0.9656 0.9794 0.9910 0.9975 1.00000
Metoda 1
Podíl vysvětlené variability
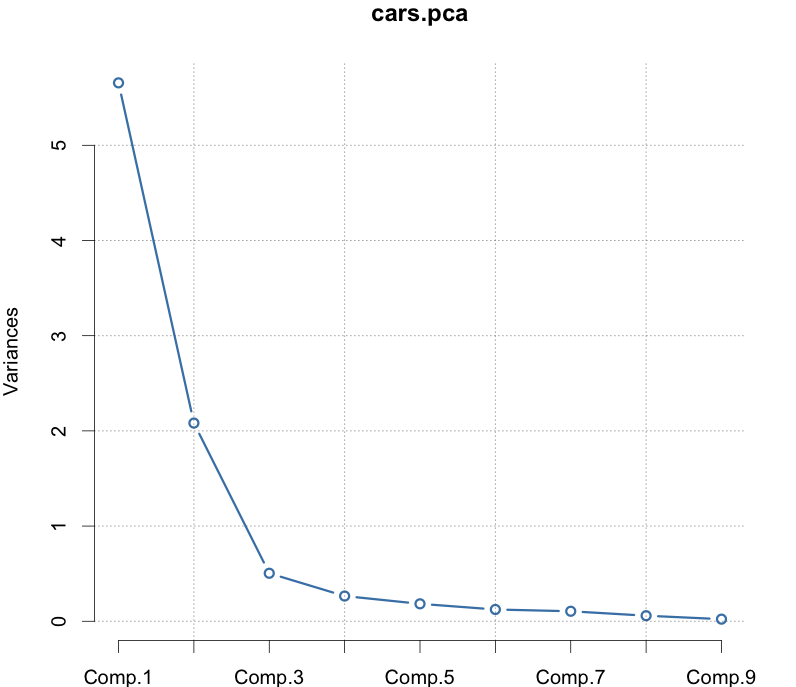
screeplot(cars.pca, type = "lines")
Volba na základě


Metoda 2
summary(cars.pca)
Importance of components:
Comp.1 Comp.2 Comp.3 Comp.4 Comp.5 Comp.6 Comp.7 Comp.8 Comp.9
Standard deviation 2.378 1.443 0.710 0.5148 0.4280 0.3518 0.3241 0.2419 0.14896
Proportion of Variance 0.628 0.231 0.056 0.0294 0.0204 0.0138 0.0117 0.0065 0.00247
Cumulative Proportion 0.628 0.860 0.916 0.9453 0.9656 0.9794 0.9910 0.9975 1.00000
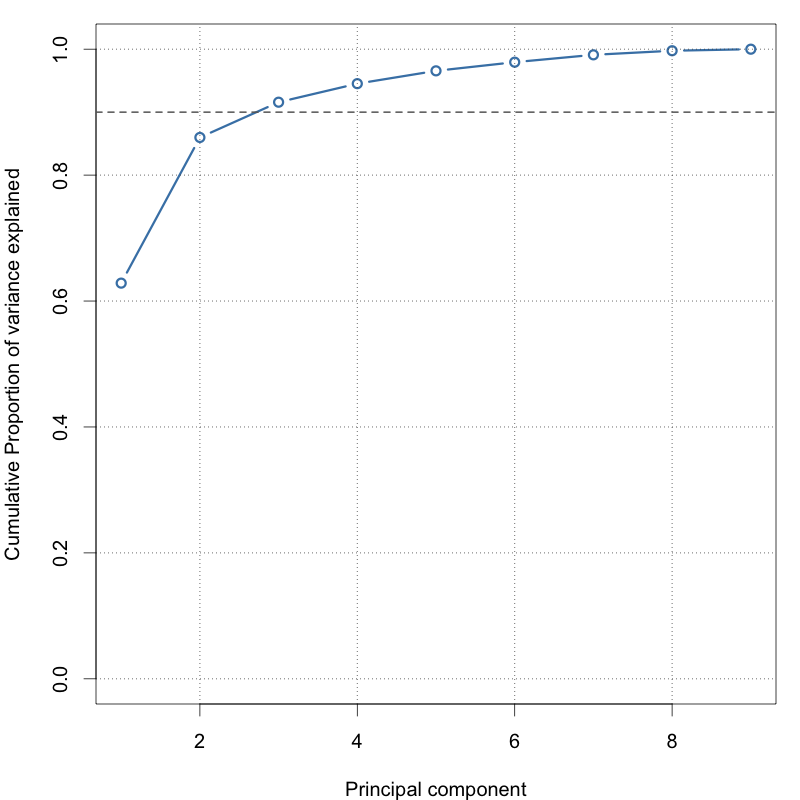
Kumulativní podíl
# Variance explained
pc.var <- cars.pca$sdev^2
# Proportion of variation
pc.pvar <- pc.var / sum(pc.var)
# Cumulative proportion
plot(cumsum(pc.pvar), type = 'b')
abline(h = 0.9, lty = 2)

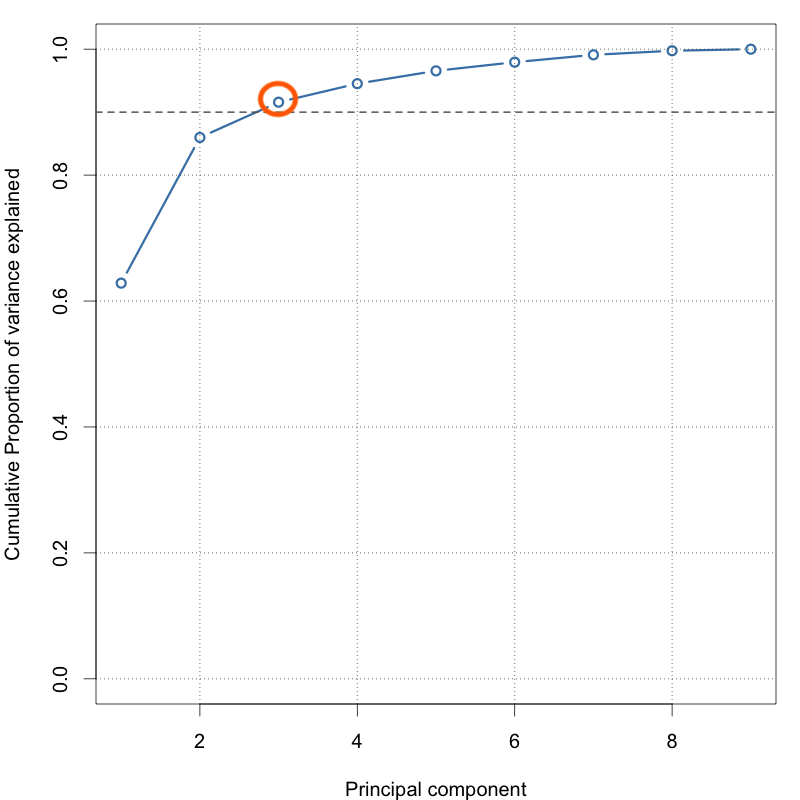
Kumulativní podíl
# Variance explained
pc.var <- cars.pca$sdev^2
# Proportion of variation
pc.pvar <- pc.var / sum(pc.var)
# Cumulative proportion
plot(cumsum(pc.pvar), type = 'b')
abline(h = 0.9, lty = 2)
3 hlavní komponenty vysvětlují 90 % variability
Multivariate Probability Distributions in R