Vektor středních hodnot a varianční-kovarianční matice

Multivariate Probability Distributions in R

Surajit Ray

Professor, University of Glasgow

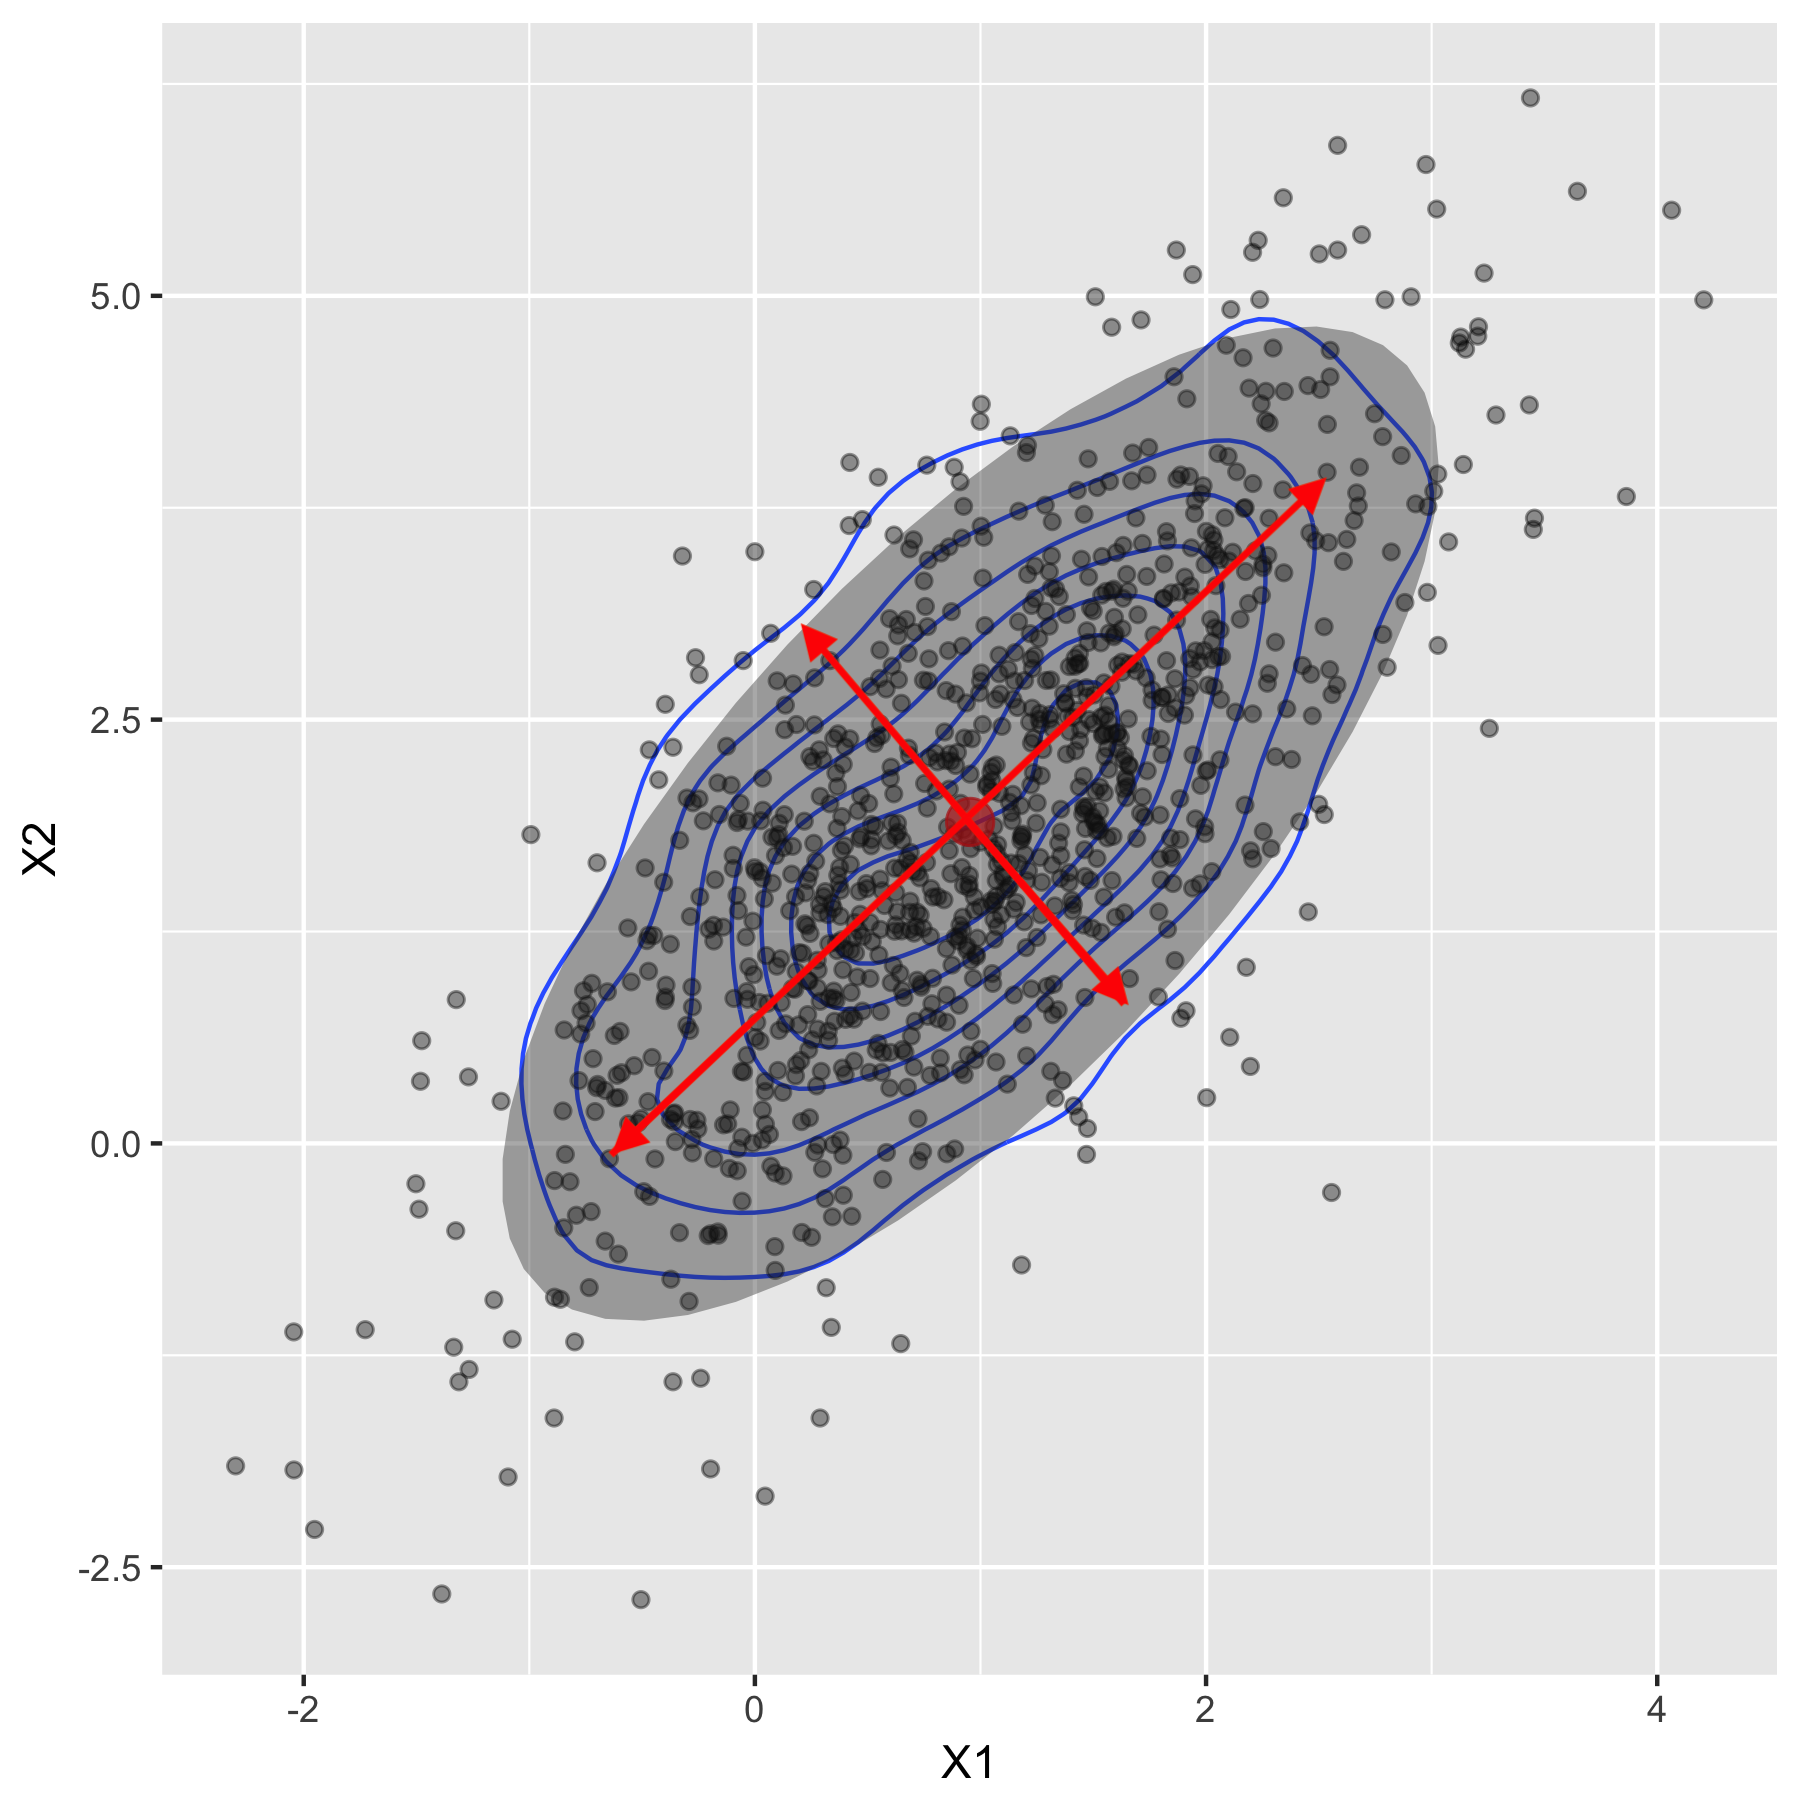
Průměr vyjadřuje polohu rozdělení
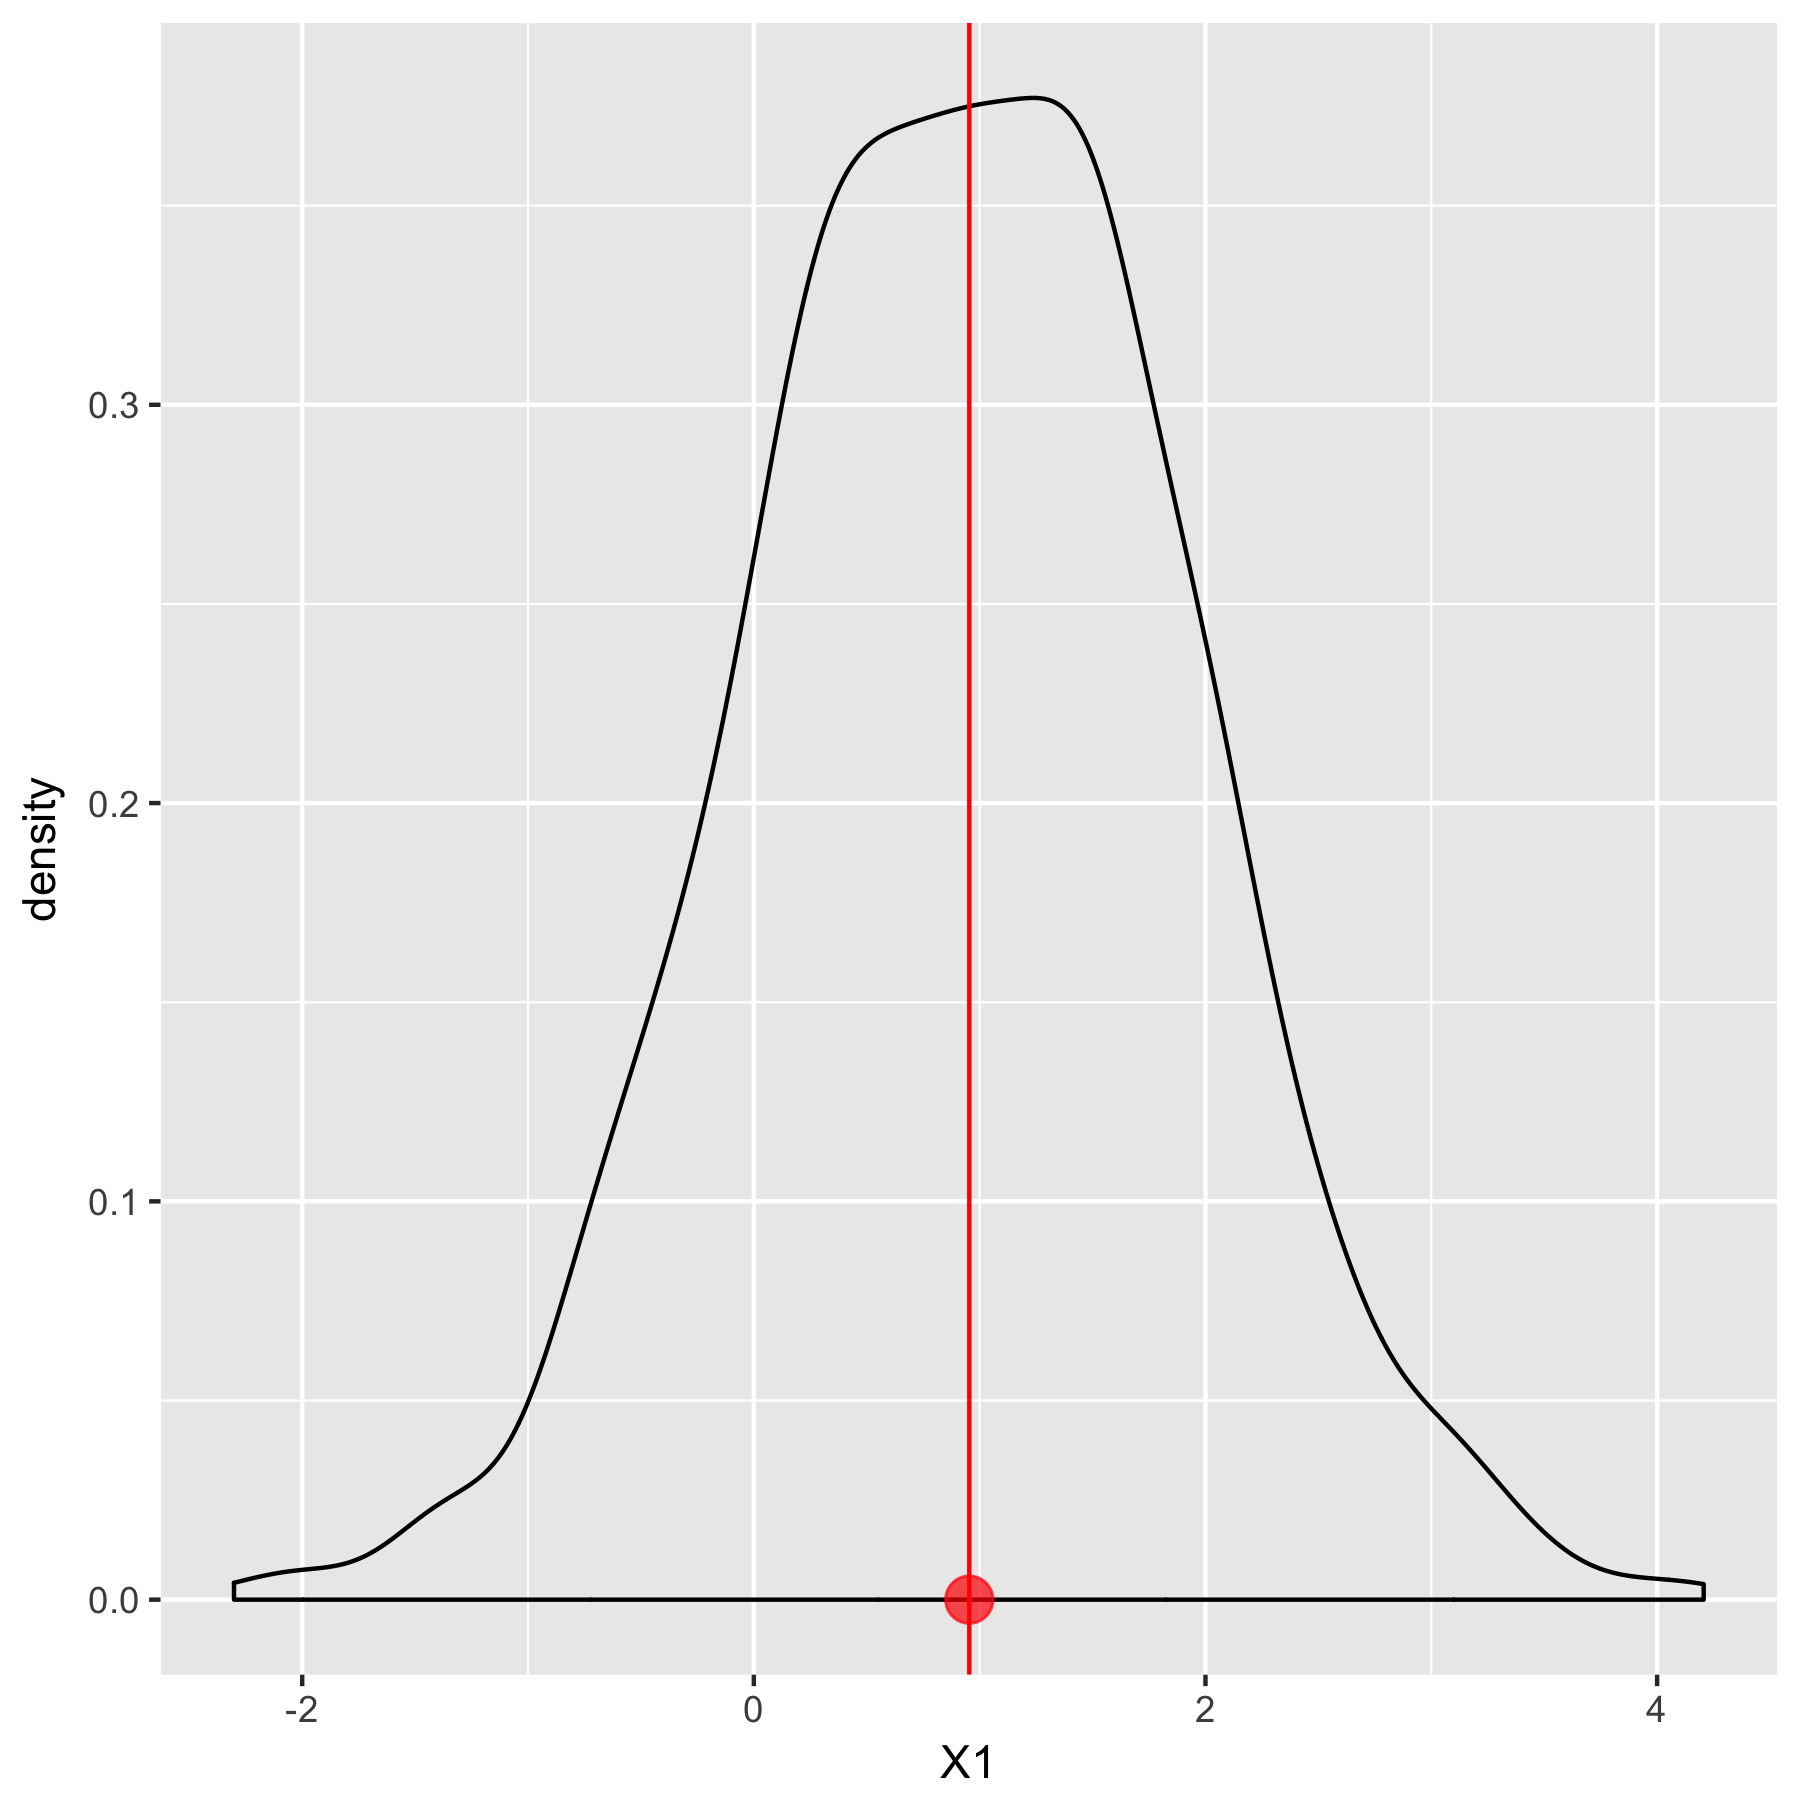
                                               Průměr $0.95$
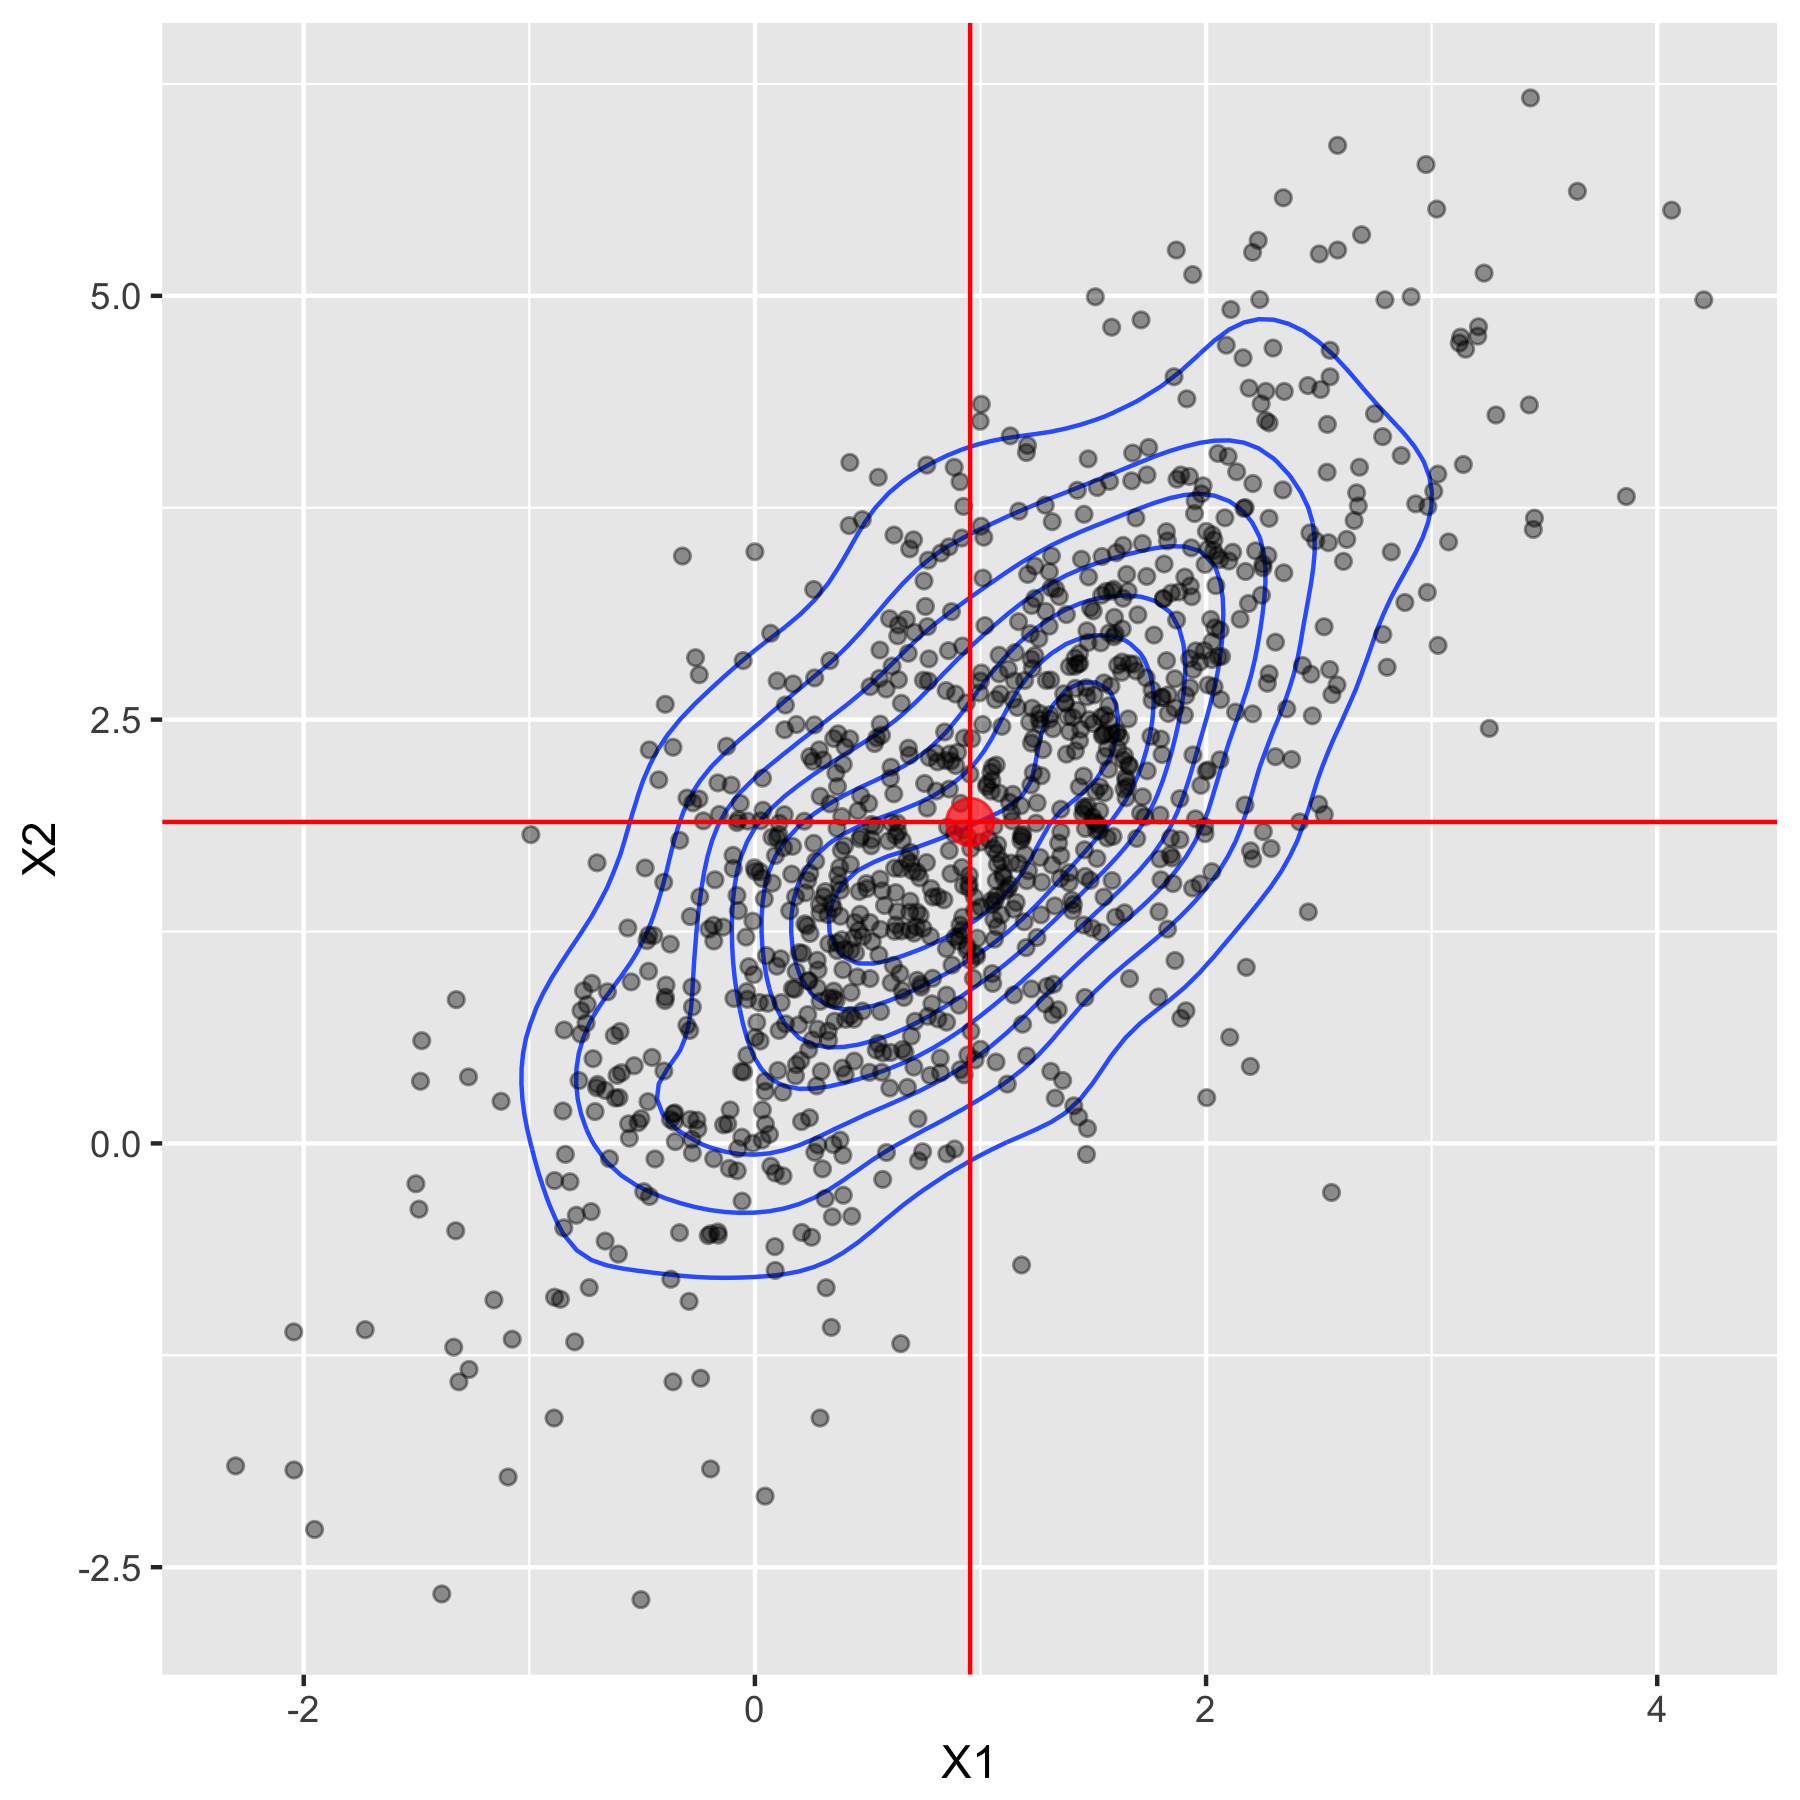
                                  Vektor průměrů (0.95 1.89)

Multivariate Probability Distributions in R

Varianční-kovarianční matice popisuje rozptyl
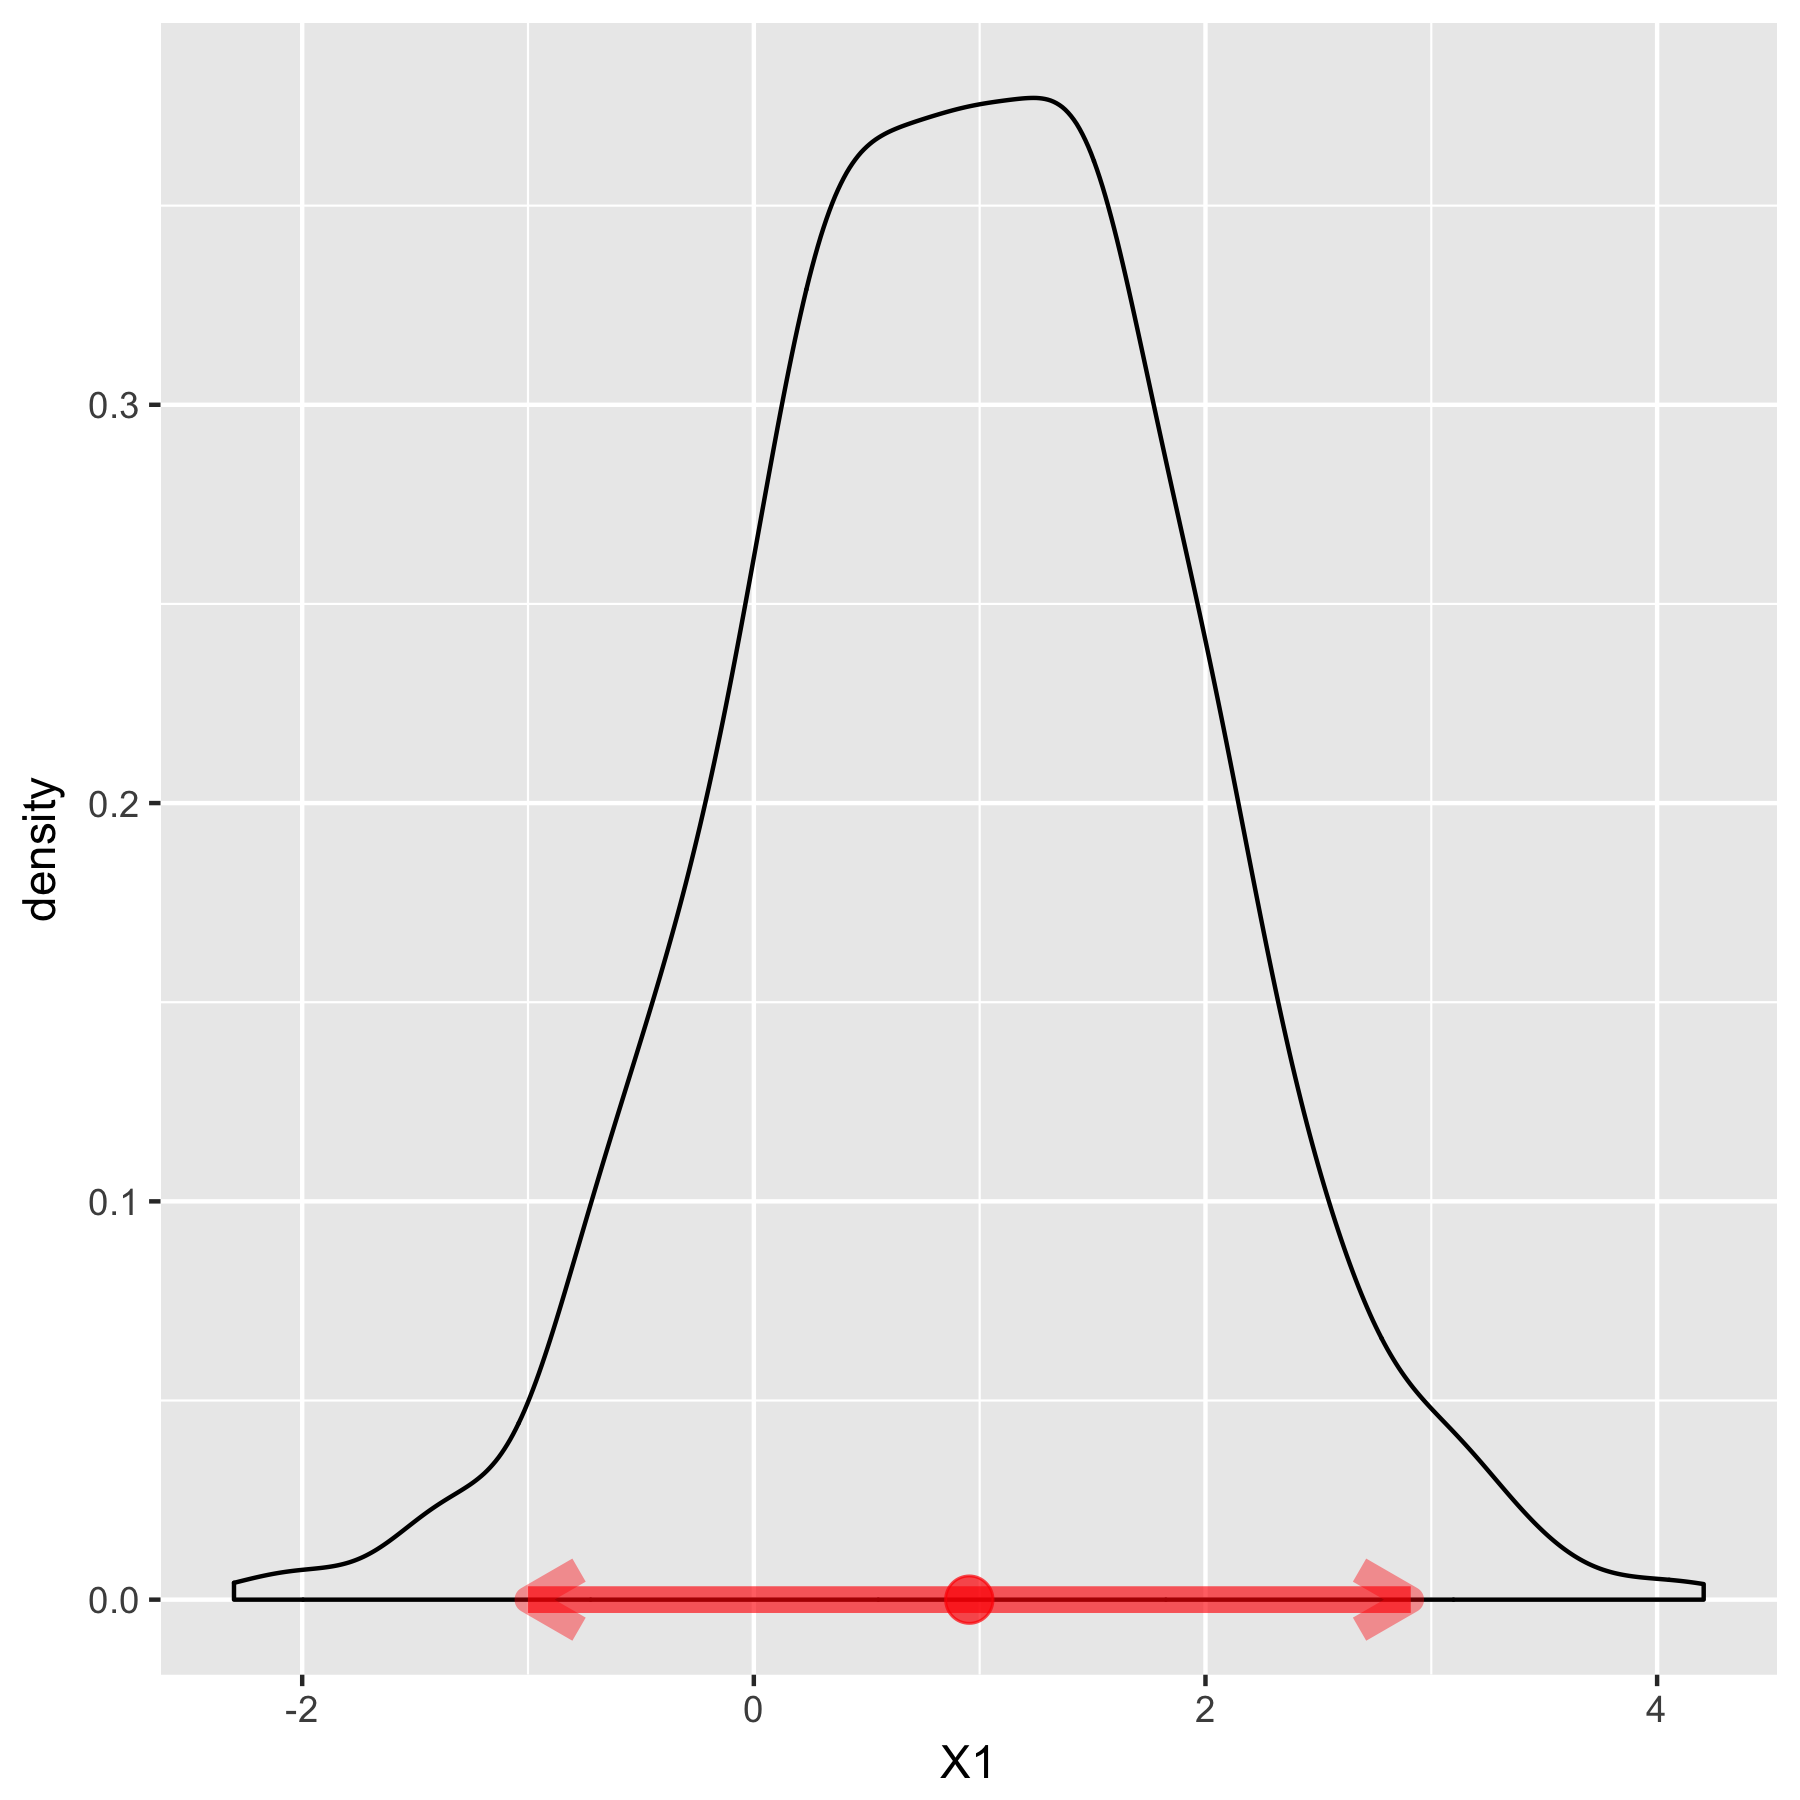
                                            Rozptyl $1.02$

Varianční-kovarianční matice ${\begin{pmatrix} 1.02 & 0.97 \\ 0.97 & 2 \end{pmatrix}}$

Multivariate Probability Distributions in R

Výpočet průměru

colMeans(iris_raw[, 1:4])
Sepal.Length  Sepal.Width Petal.Length  Petal.Width 
        5.84         3.05         3.76         1.20

Funkce pro výpočet průměrů podle skupin

  • by()
  • aggregate()
Multivariate Probability Distributions in R

Výpočet skupinového průměru pomocí by

by(data = iris[,1:4], INDICES = iris$Species, FUN = colMeans)
iris_raw$Species: setosa
Sepal.Length  Sepal.Width Petal.Length  Petal.Width 
       5.006        3.418        1.464        0.244 
 ----------------------------------------------------
iris_raw$Species: versicolor
Sepal.Length  Sepal.Width Petal.Length  Petal.Width 
       5.936        2.770        4.260        1.326 
 ----------------------------------------------------
iris_raw$Species: virginica
Sepal.Length  Sepal.Width Petal.Length  Petal.Width 
       6.588        2.974        5.552        2.026
Multivariate Probability Distributions in R

Výpočet skupinového průměru pomocí aggregate

aggregate(. ~ Species, iris_raw, mean)
     Species Sepal.Length Sepal.Width Petal.Length Petal.Width
1     setosa         5.01        3.42         1.46       0.244
2 versicolor         5.94        2.77         4.26       1.326
3  virginica         6.59        2.97         5.55       2.026
Multivariate Probability Distributions in R

Výpočet varianční-kovarianční a korelační matice

var(iris_raw[, 1:4])
             Sepal.Length Sepal.Width Petal.Length Petal.Width
Sepal.Length       0.6857     -0.0393        1.274       0.517
Sepal.Width       -0.0393      0.1880       -0.322      -0.118
Petal.Length       1.2737     -0.3217        3.113       1.296
Petal.Width        0.5169     -0.1180        1.296       0.582

Korelace

cor(iris_raw[, 1:4])
             Sepal.Length Sepal.Width Petal.Length Petal.Width
Sepal.Length        1.000      -0.109        0.872       0.818
Sepal.Width        -0.109       1.000       -0.421      -0.357
Petal.Length        0.872      -0.421        1.000       0.963
Petal.Width         0.818      -0.357        0.963       1.000
Multivariate Probability Distributions in R

Vizualizace korelační matice

Funkce corrplot pro vizualizaci korelačního grafu

corrplot(cor(iris_raw[, 1:4]), method = "ellipse")
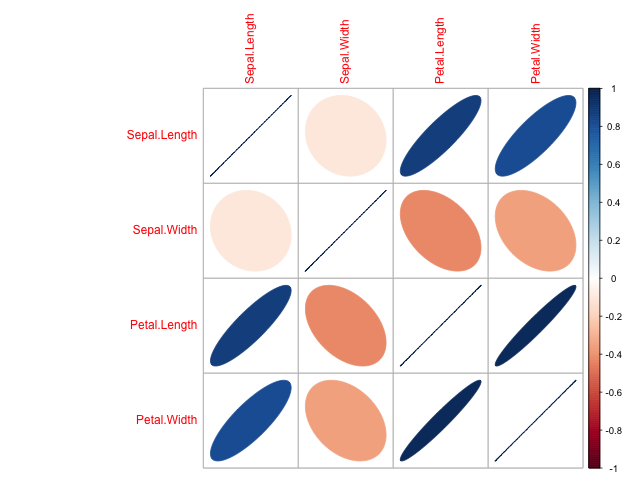
Multivariate Probability Distributions in R

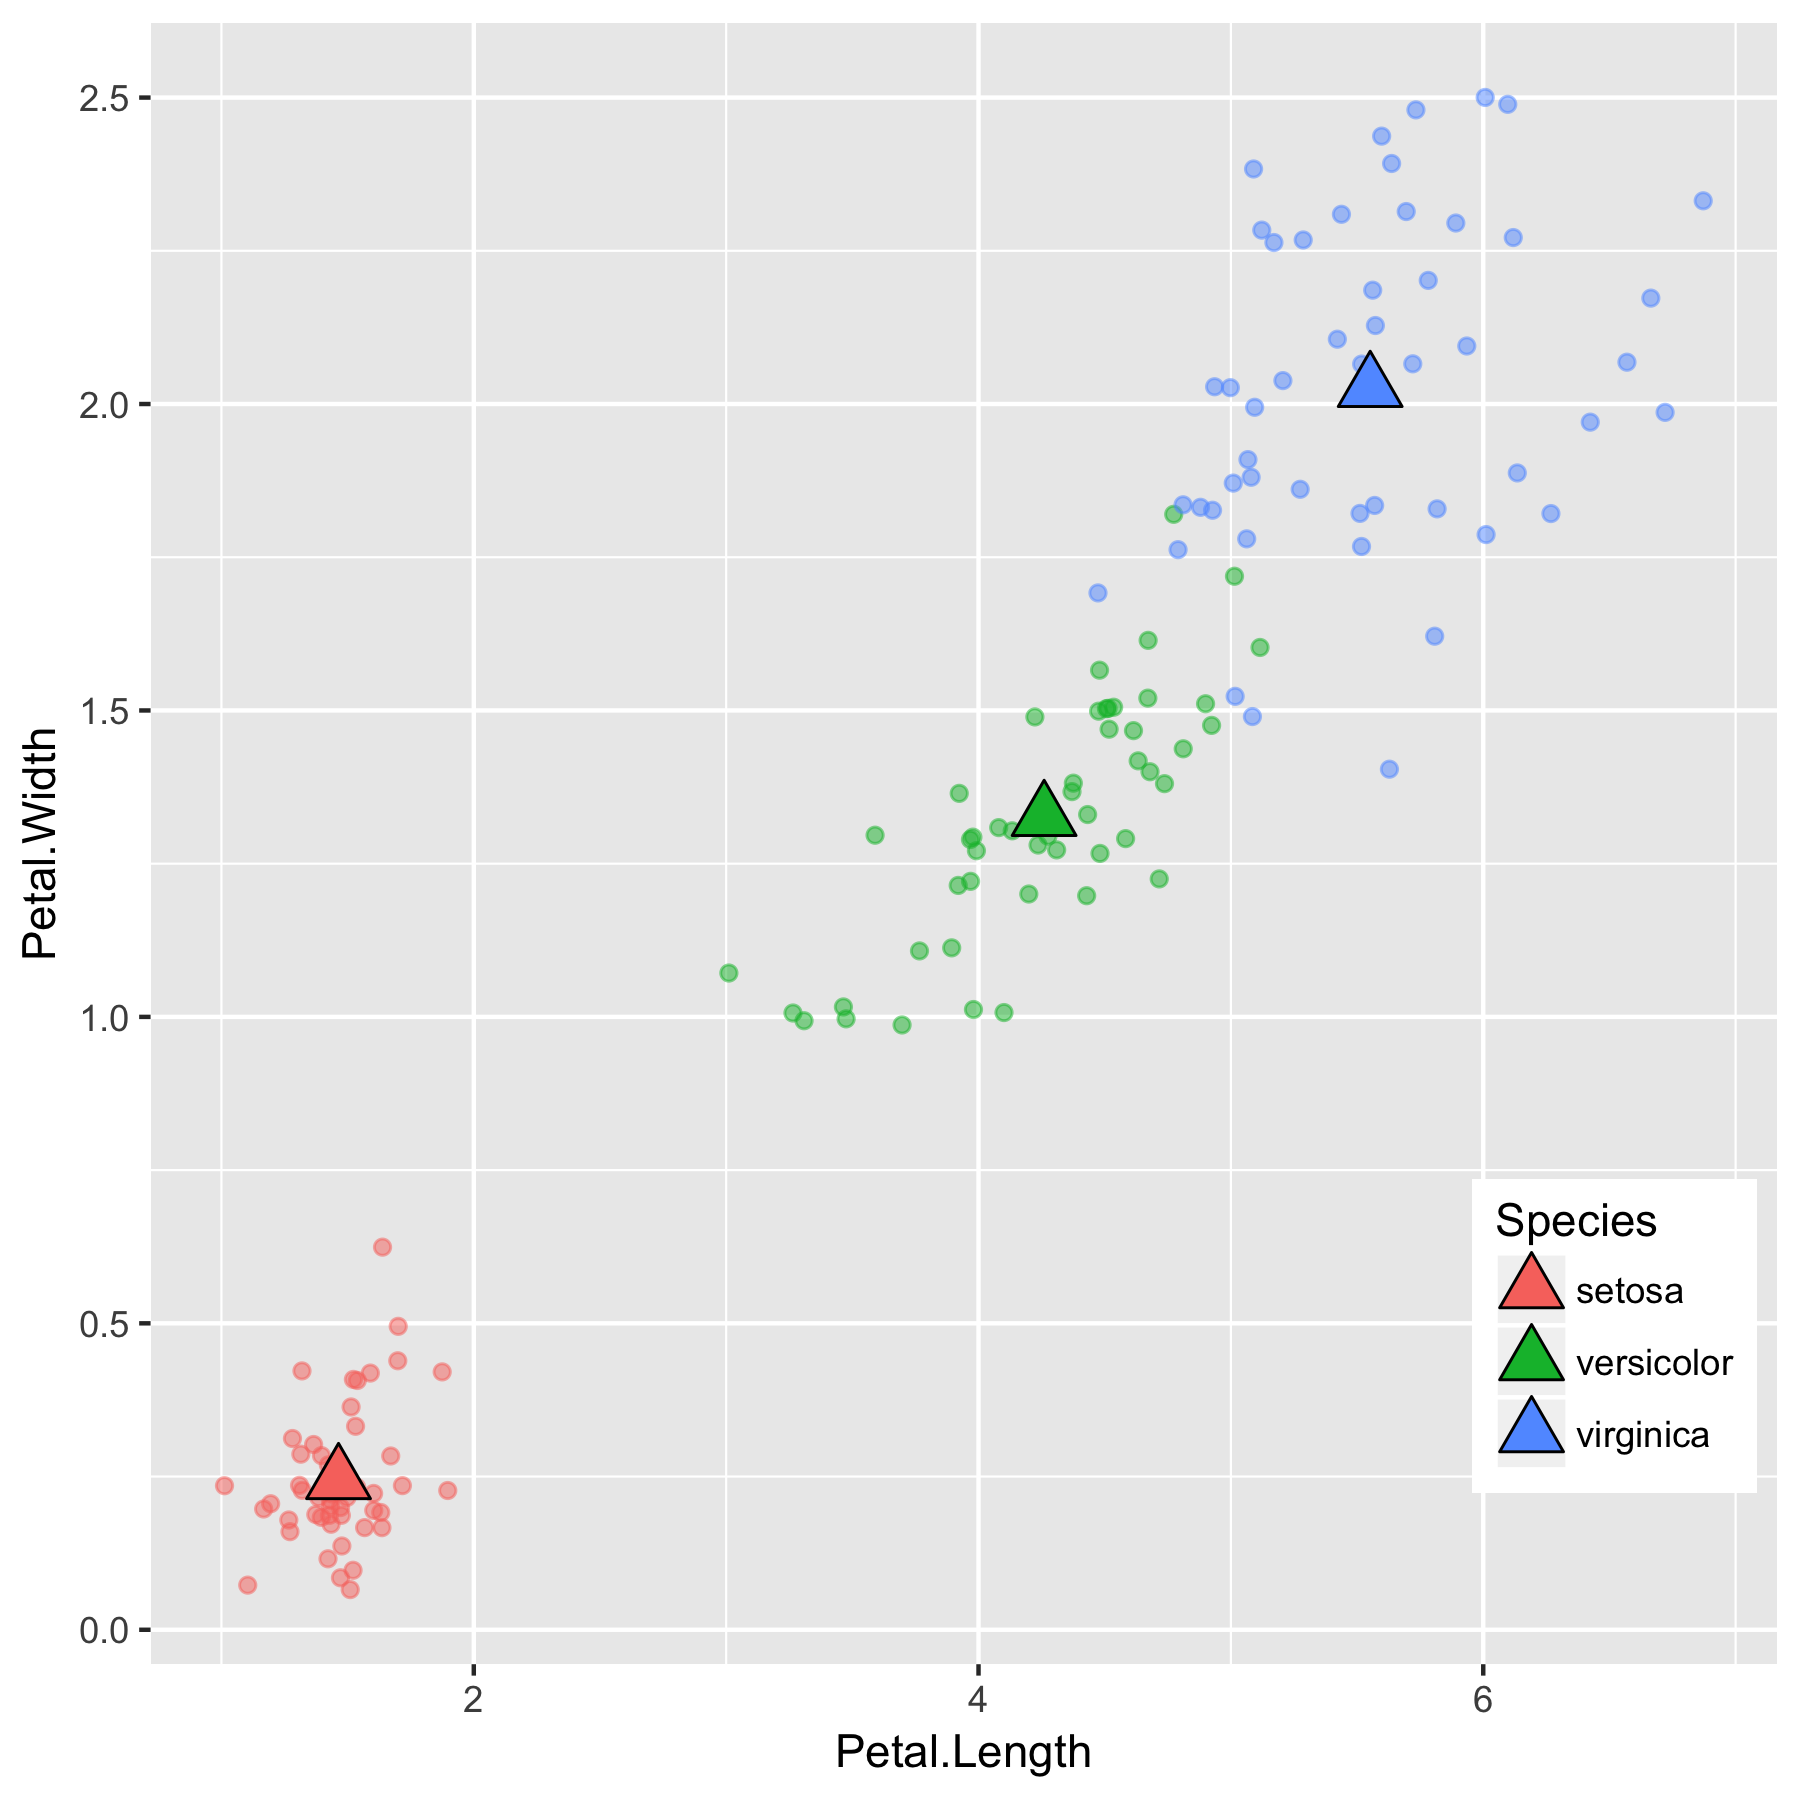
Interpretace průměrů

Průměry

Species Petal.Length Petal.Width
setosa 1.46 0.244
versicolor 4.26 1.326
virginica 5.55 2.026

průměr

Multivariate Probability Distributions in R

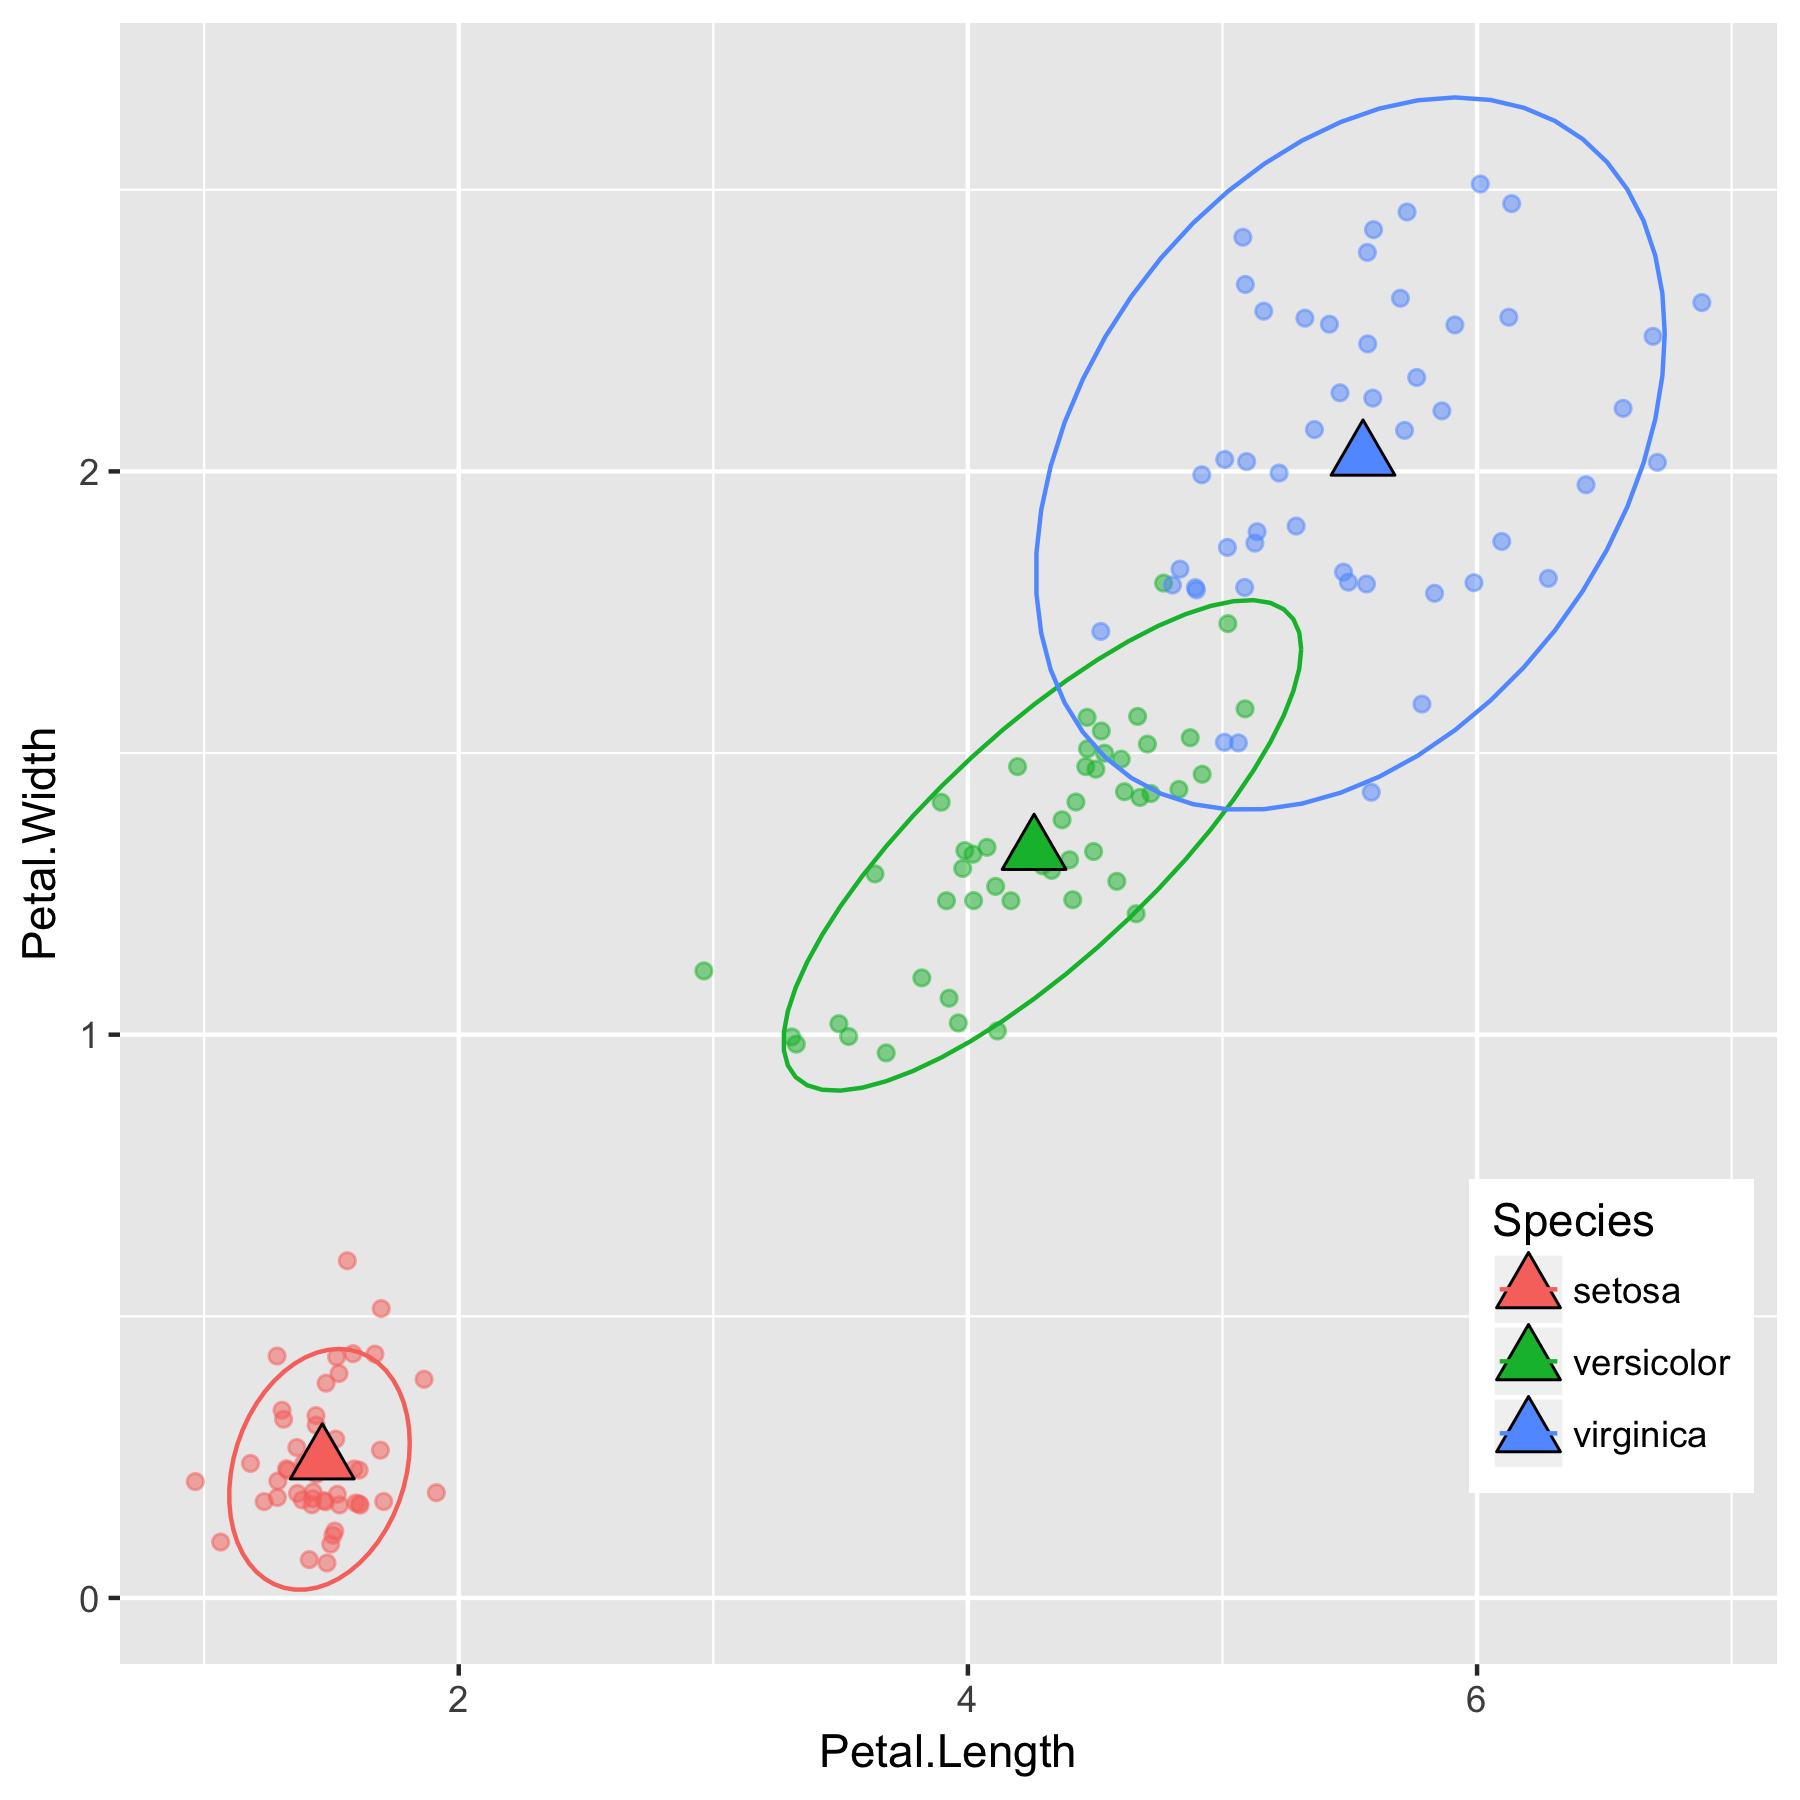
Interpretace rozptylů

setosa Petal.Length Petal.Width
Petal.Length 0.030 0.006
Petal.Width 0.006 0.011
versicolor Petal.Length Petal.Width
Petal.Length 0.221 0.073
Petal.Width 0.073 0.039
virginica Petal.Length Petal.Width
Petal.Length 0.305 0.049
Petal.Width 0.049 0.075

průměr a rozptyl

Multivariate Probability Distributions in R

Pojďme si procvičit!

Multivariate Probability Distributions in R

Preparing Video For Download...