Vizualizace skóre izolace

Úvod do detekce anomálií v R

Alastair Rushworth

Data Scientist

Sekvence hodnot

h_seq <- seq(min(furniture$Height), max(furniture$Height), length.out = 20)

w_seq <- seq(min(furniture$Width),  max(furniture$Width),  length.out = 20)


Argumenty seq()

  • from - dolní mez
  • to - horní mez
  • length.out - počet hodnot v sekvenci
Úvod do detekce anomálií v R

Vytvoření mřížky

furniture_grid <- expand.grid(Width = w_seq, Height = h_seq)

head(furniture_grid)
     Width Height  
1 46.85100 44.359 
2 51.48663 44.359 
3 56.12225 44.359 
4 60.75788 44.359 
5 65.39351 44.359 
6 70.02913 44.359 
Úvod do detekce anomálií v R

Skórování mřížky

furniture_grid$score <- predict(furniture_forest, furniture_grid)
Úvod do detekce anomálií v R

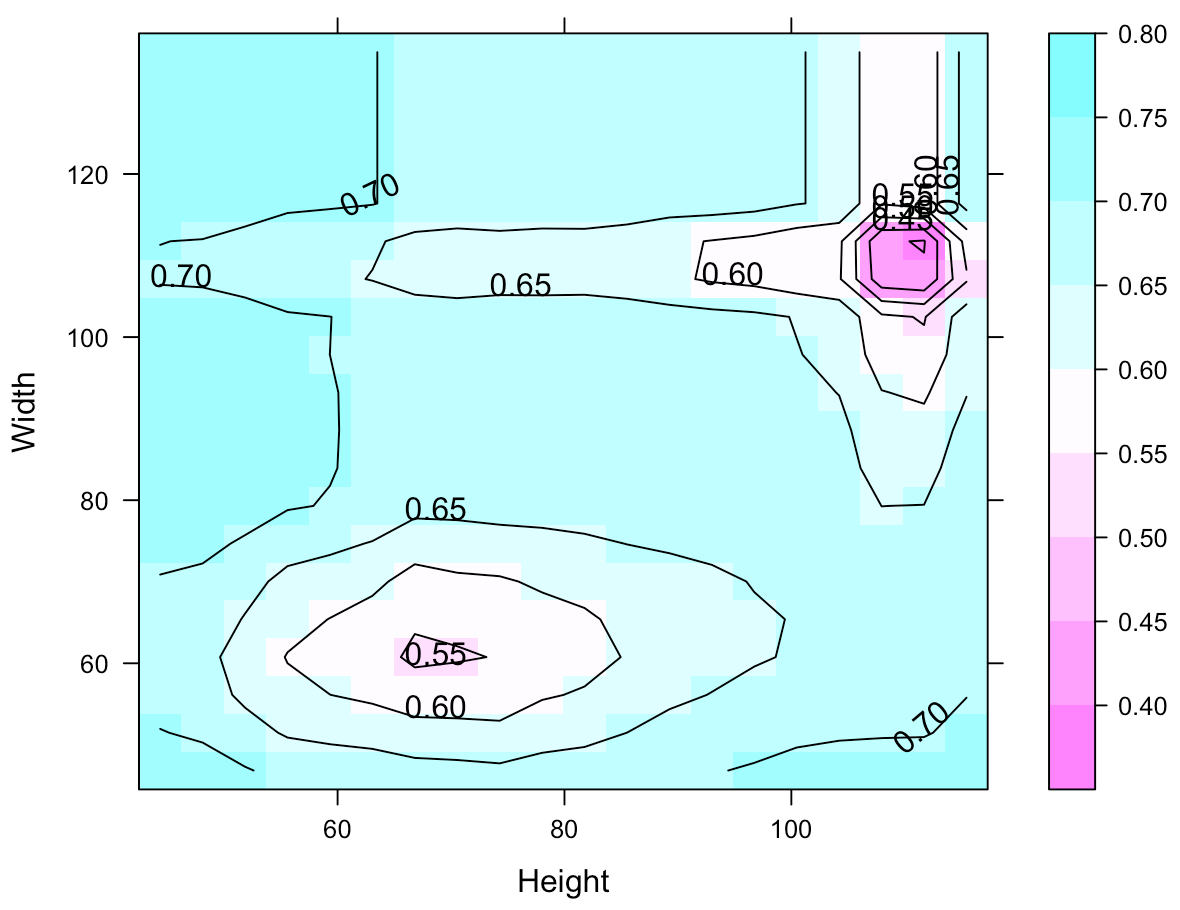
Vytvořte vrstevnicový graf!

library(lattice)
contourplot(score ~ Height + Width, data = furniture_grid, 
            region = TRUE)
Úvod do detekce anomálií v R

Pojďme si procvičit!

Úvod do detekce anomálií v R

Preparing Video For Download...