Úvod do detekce anomálií v R
Alastair Rushworth
Data Scientist
head(msales)
sales month
1 6.068 1
2 5.966 2
3 6.133 3
4 6.230 4
5 6.407 5
6 6.433 6
Grubbsův test zde není vhodný
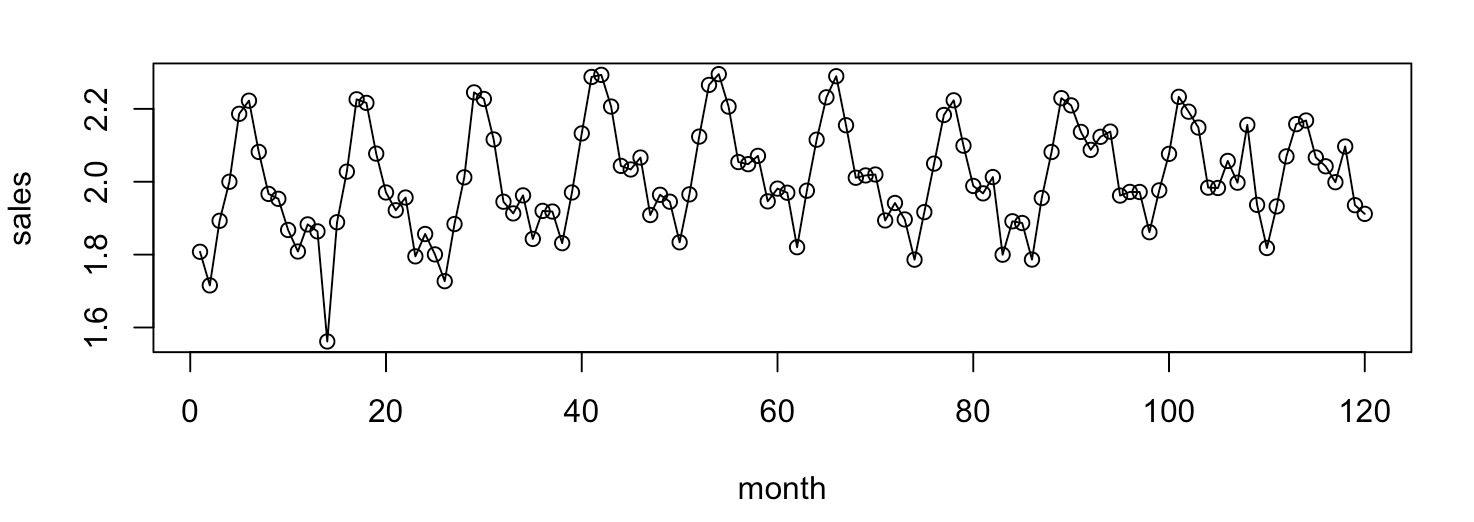
plot(sales ~ month, data = msales, type = 'o')
library(AnomalyDetection)
sales_ad <- AnomalyDetectionVec(x = msales$sales, period = 12,
direction = 'both')
Argumenty
x: vektor hodnotperiod: perioda opakujícího se vzorudirection: hledá anomálie malé ('neg'), velké ('pos') nebo obojí ('both')Stažení balíčku z https://github.com/twitter/AnomalyDetection
sales_ad <- AnomalyDetectionVec(x = msales$sales, period = 12,
direction = 'both')
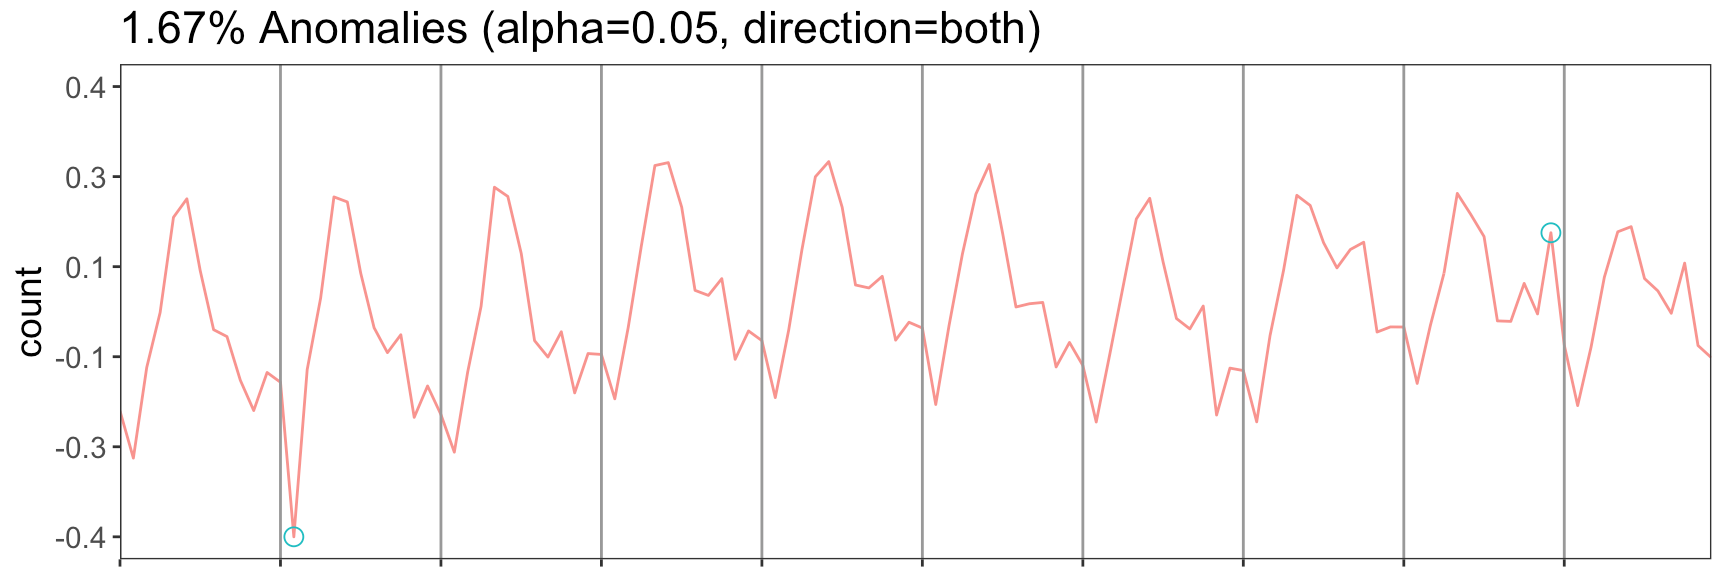
sales_ad$anoms
index anoms
1 14 1.561
2 108 2.156
AnomalyDetectionVec(x = msales$sales, period = 12,
direction = 'both', plot = T)
Úvod do detekce anomálií v R