Komunikace pomocí textu

Interaktivní vizualizace dat s Bokeh

George Boorman

Core Curriculum Manager, DataCamp

Náš graf
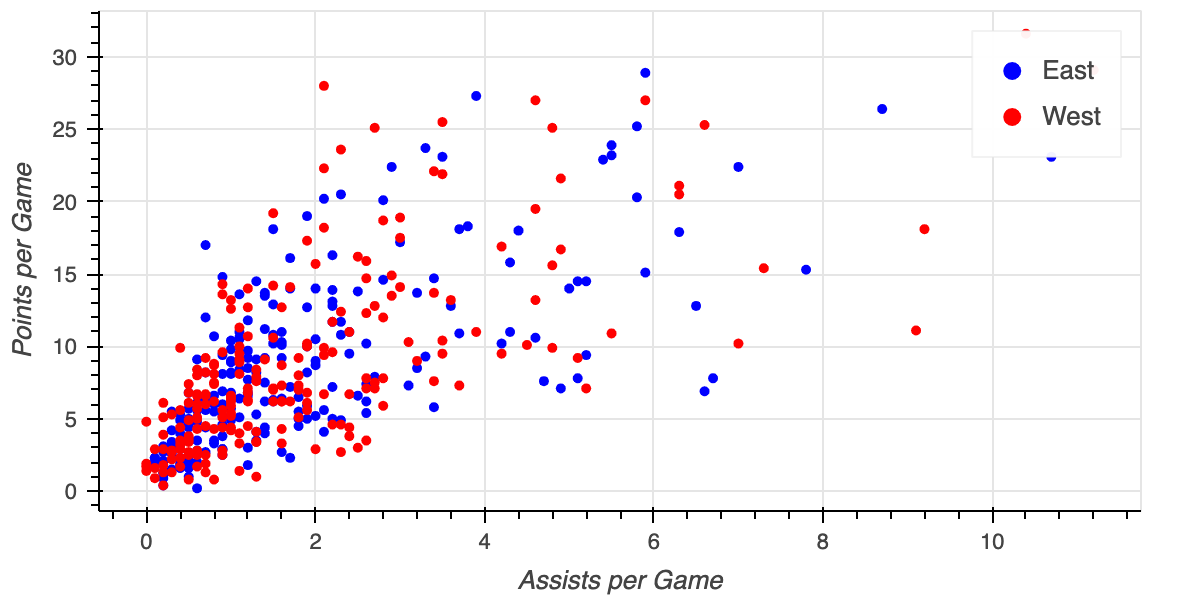
graf bez názvu

Interaktivní vizualizace dat s Bokeh

Přidání názvu

fig = figure(x_axis_label='Assists per Game', y_axis_label='Points per Game',

title="Points vs. Assists by Conference")
fig.circle(x='assists', y='points', source=east, color='blue', legend_label='East') fig.circle(x='assists', y='points', source=west, color='red', legend_label='West') output_file(filename="points_vs_assists_by_conference.html") show(fig)
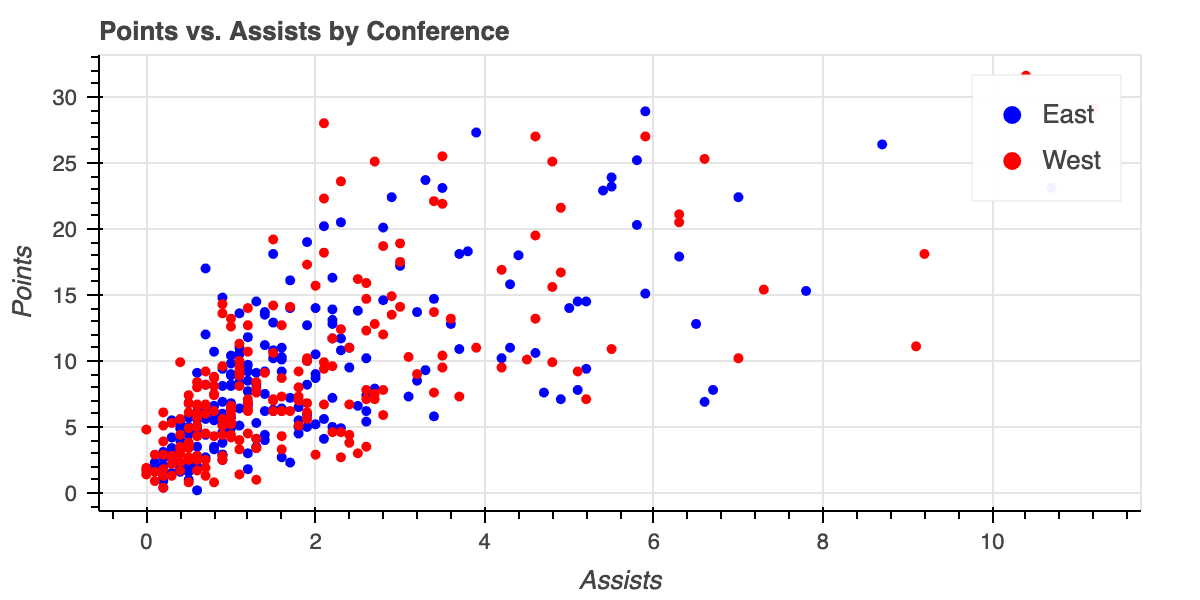
graf s názvem

Interaktivní vizualizace dat s Bokeh

Úprava názvu

fig.title.text_font_size = "30px"

fig.title.align = "center"
output_file(filename="modified_title.html") show(fig)
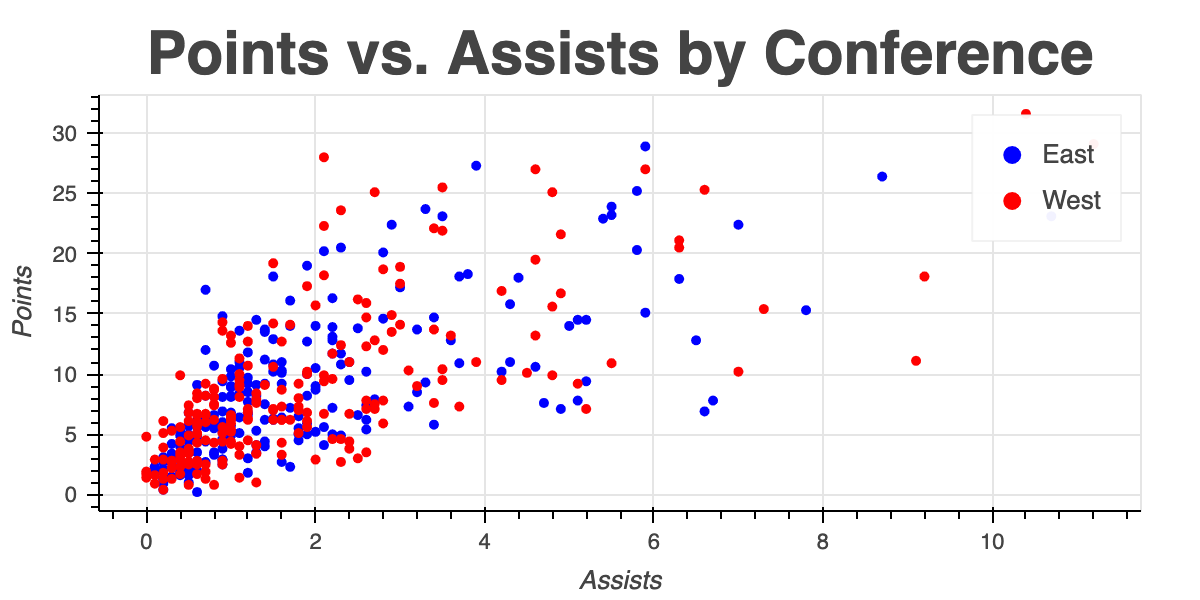
upravený název

Interaktivní vizualizace dat s Bokeh

Úprava legendy

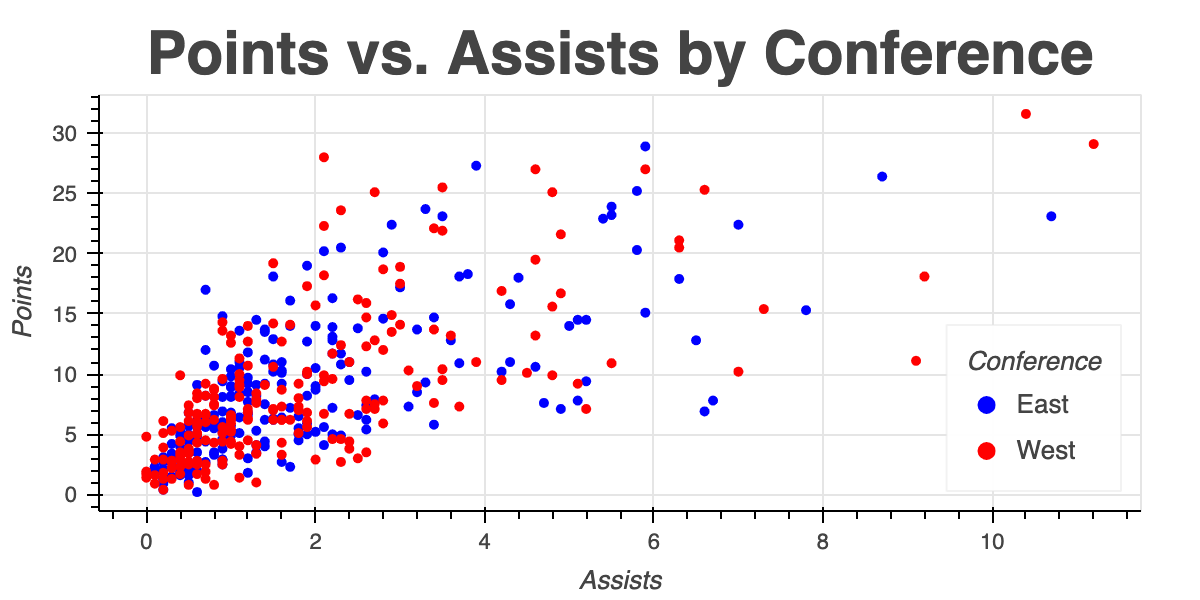
fig.legend.title = "Conference"

fig.legend.location = "bottom_right"
show(fig)
legend.location
"top_left"
"top_right"
"bottom_left"
"bottom_right"

název legendy kurzívou

Interaktivní vizualizace dat s Bokeh

Styl písma názvu legendy

legend.title_text_font_style
"bold"
"normal"
"italic"
Interaktivní vizualizace dat s Bokeh

Styl písma názvu legendy

fig.legend.title_text_font_style = "normal"

output_file(filename="normal_legend_title.html") show(fig)
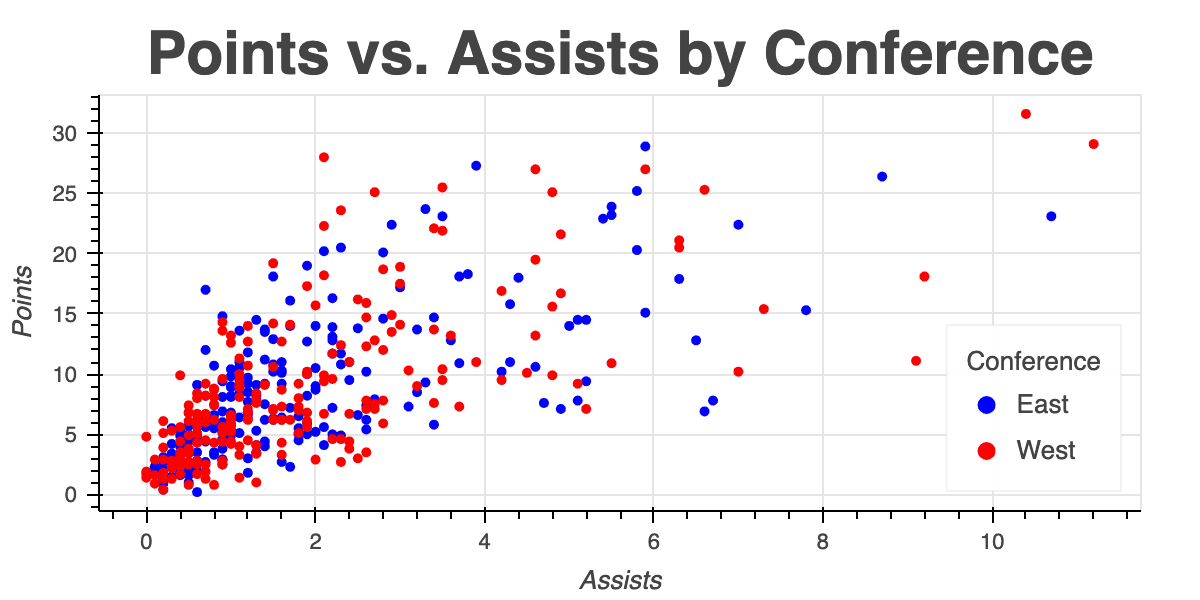
normální název legendy

Interaktivní vizualizace dat s Bokeh

Zobrazení interaktivní legendy

fig.legend.click_policy = "hide"

output_file(filename="interactive_legend.html") show(fig)
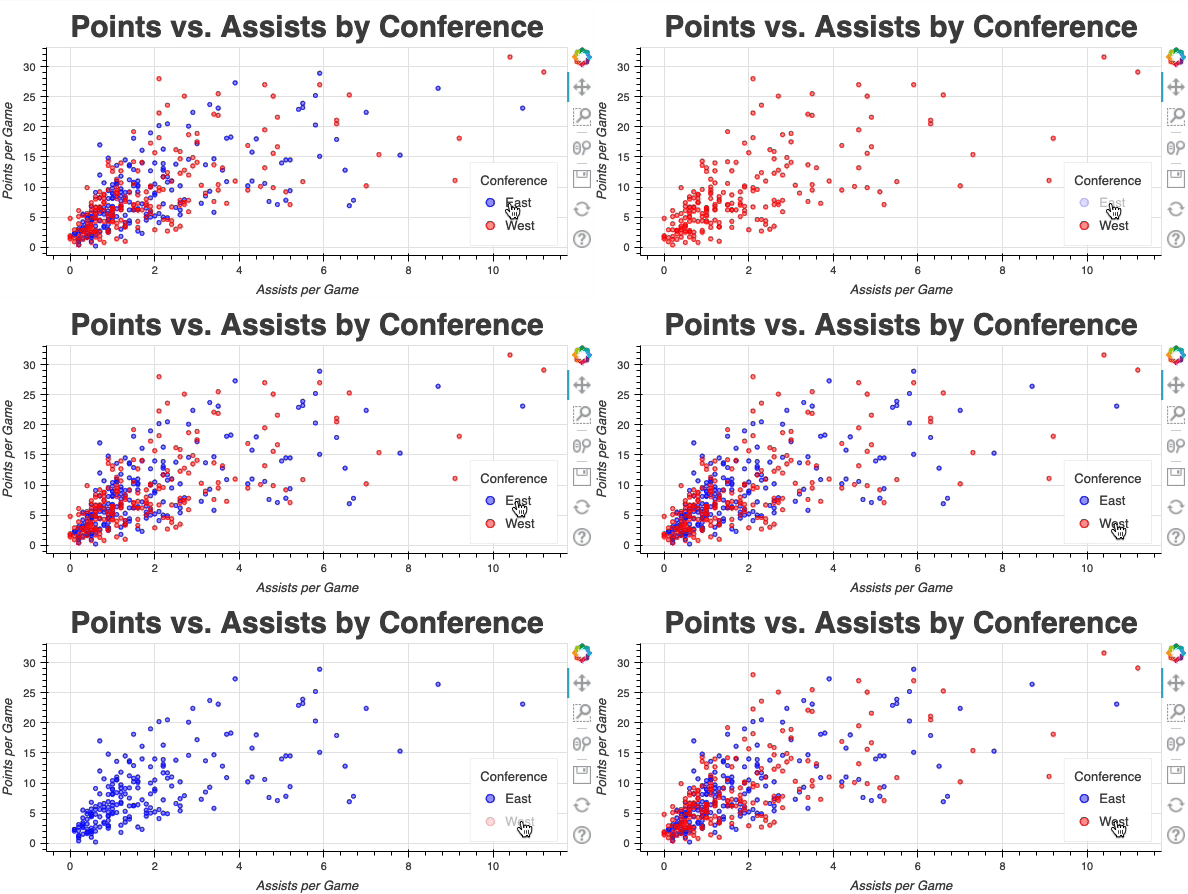
interaktivní legenda

Interaktivní vizualizace dat s Bokeh

Datová sada

print(bakery.shape)
(17486, 6)
print(bakery.columns)
Index(['transaction', 'items', 'day_time', 'day_type', 'date', 'sales'],
dtype='object')
Interaktivní vizualizace dat s Bokeh

Lass uns üben!

Interaktivní vizualizace dat s Bokeh

Preparing Video For Download...