Intermediate Interactive Data Visualization with plotly in R
Adam Loy
Statistician, Carleton College
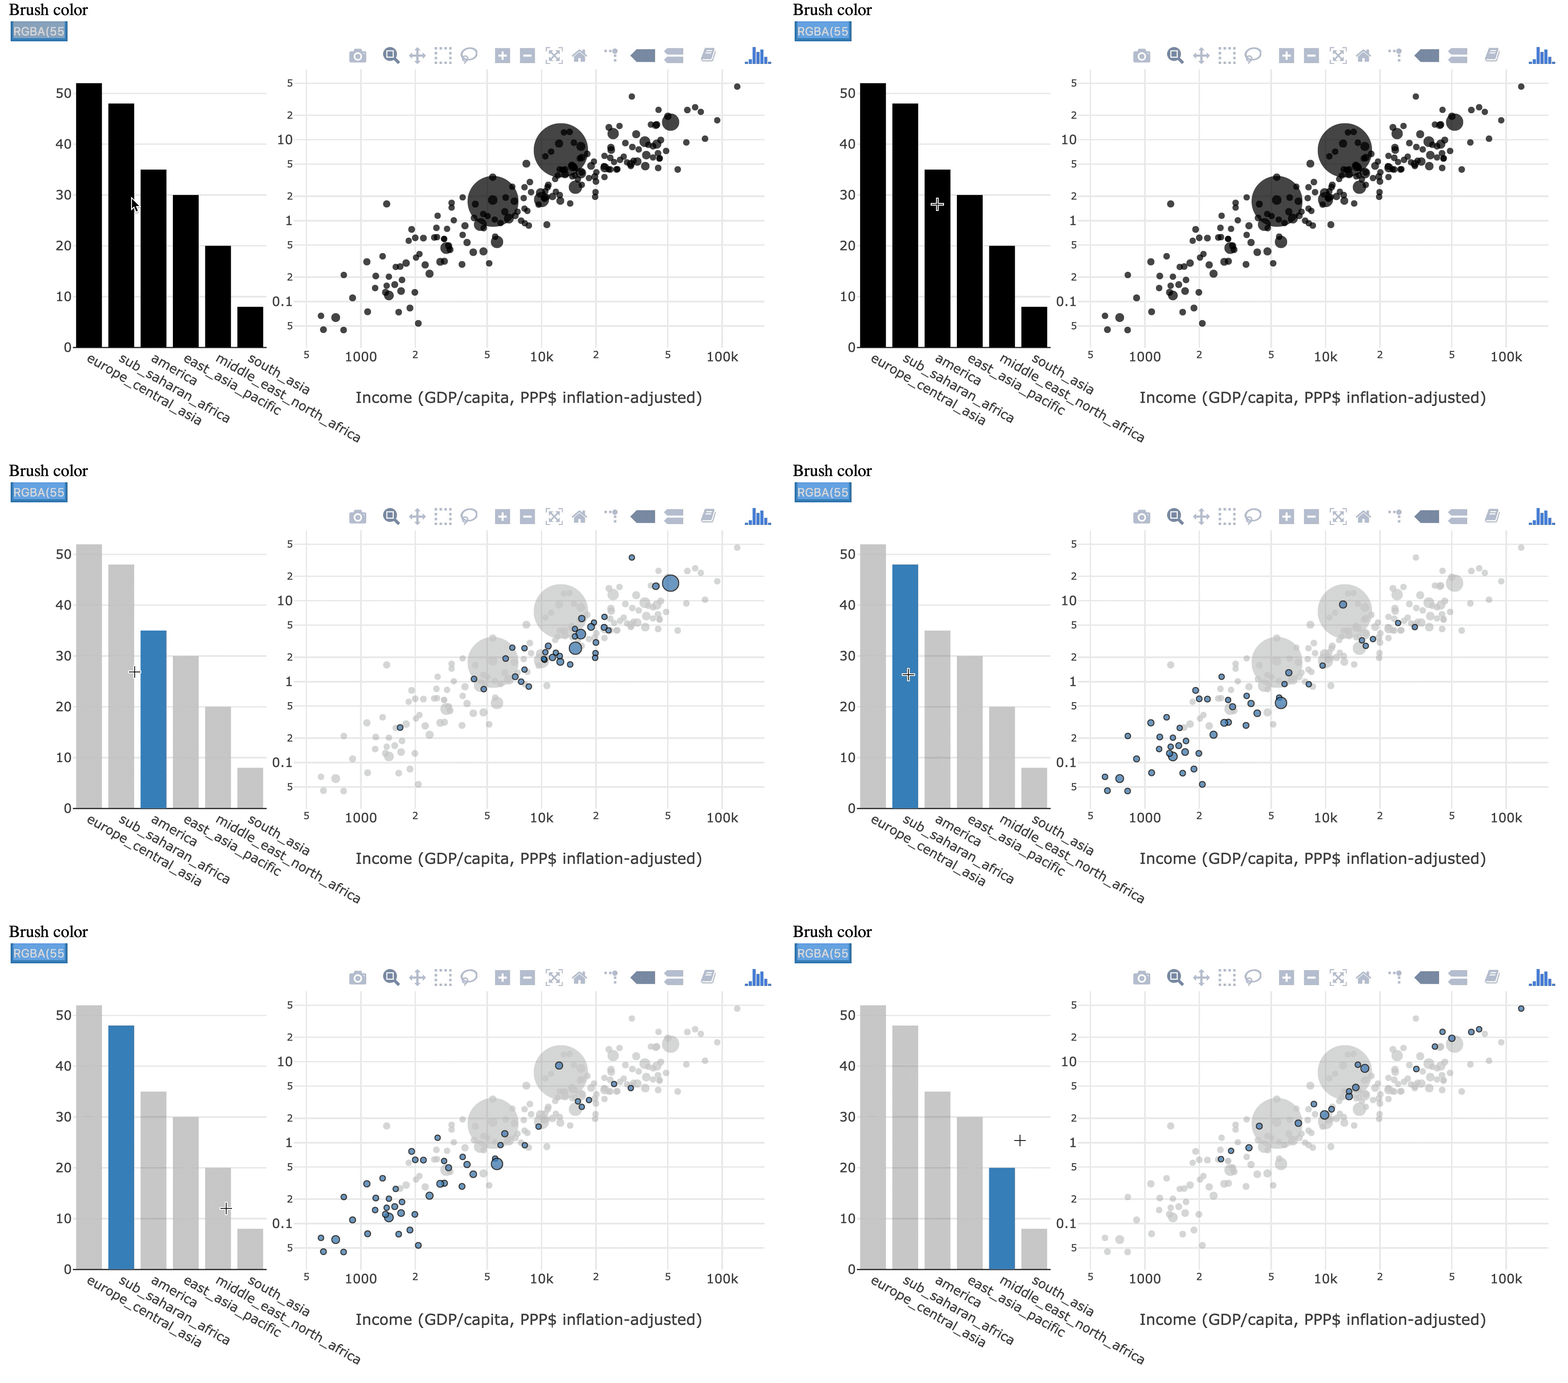
Přechodný výběr
dříve vybrané záznamy jsou zapomenuty

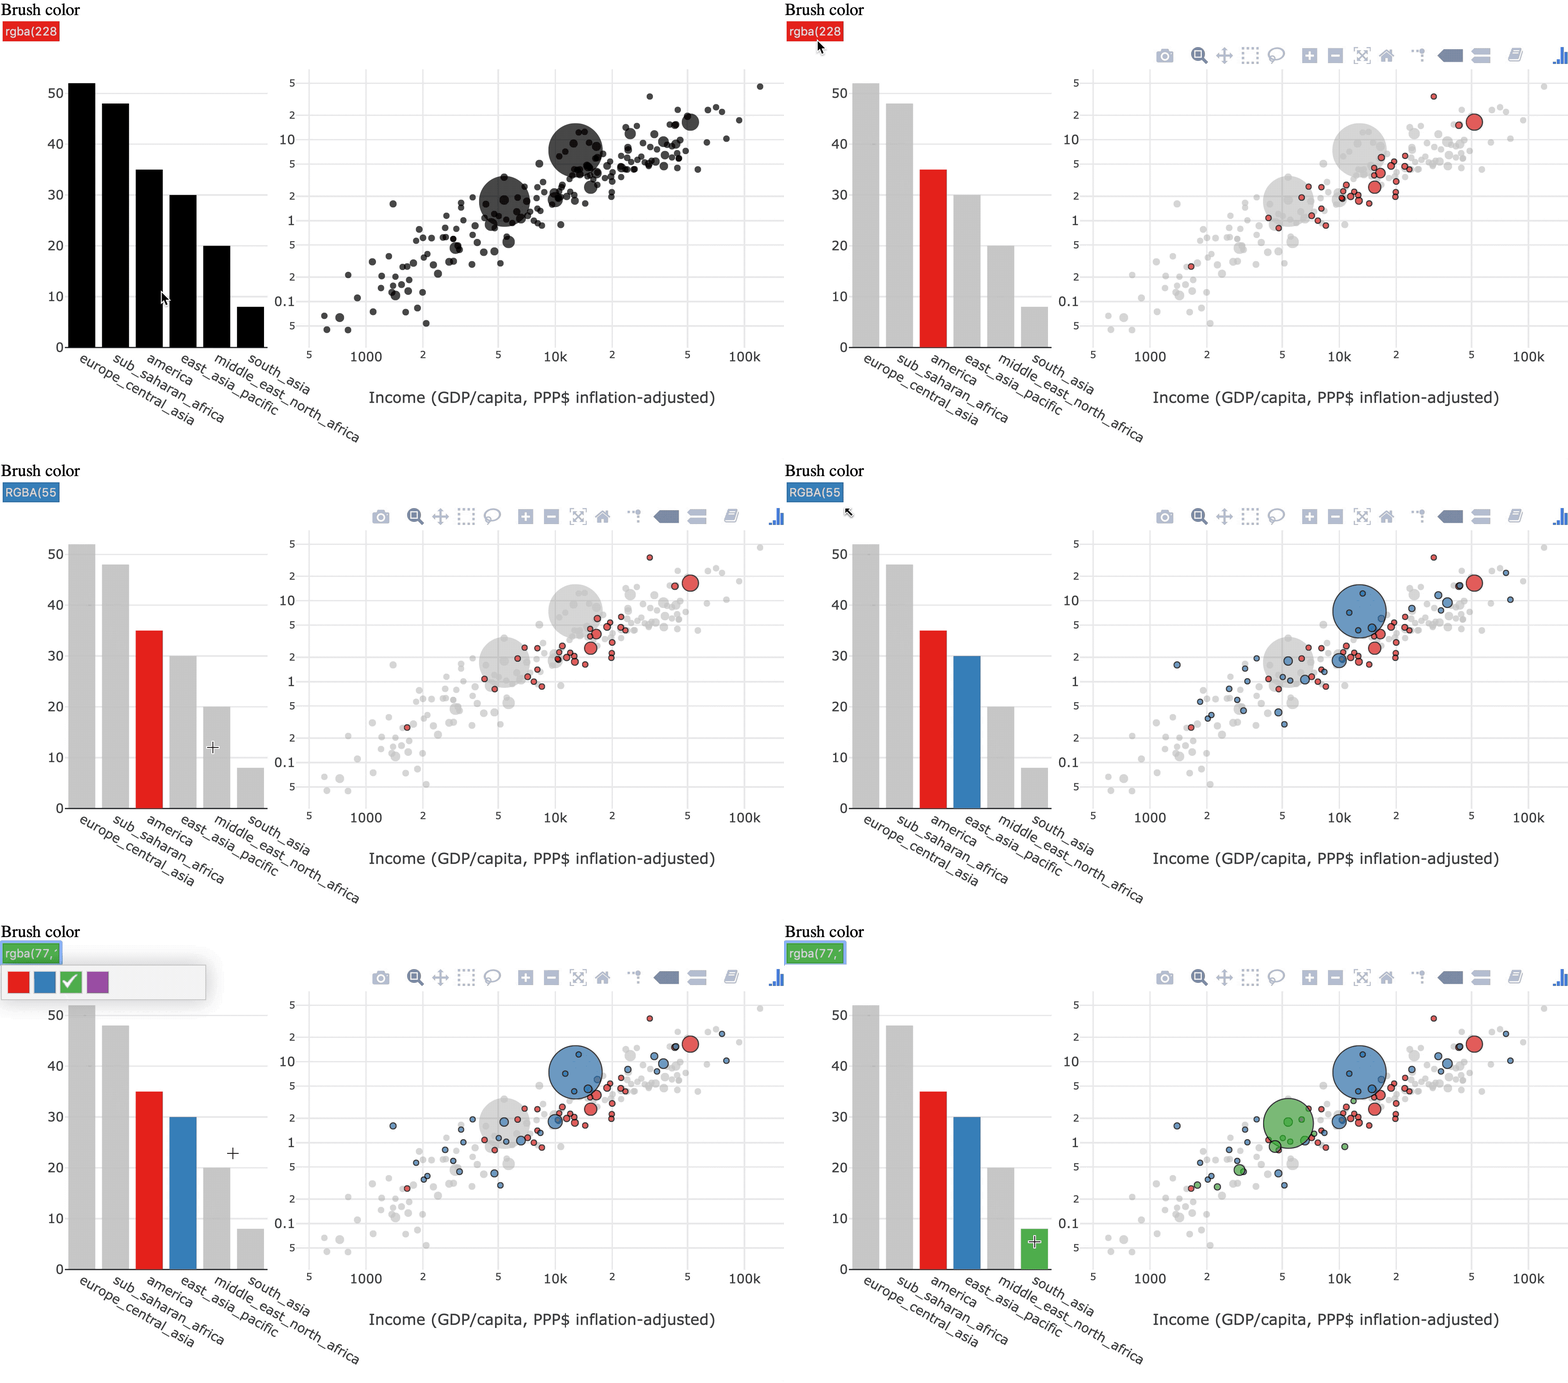
Trvalý výběr
vybrané záznamy se kumulují


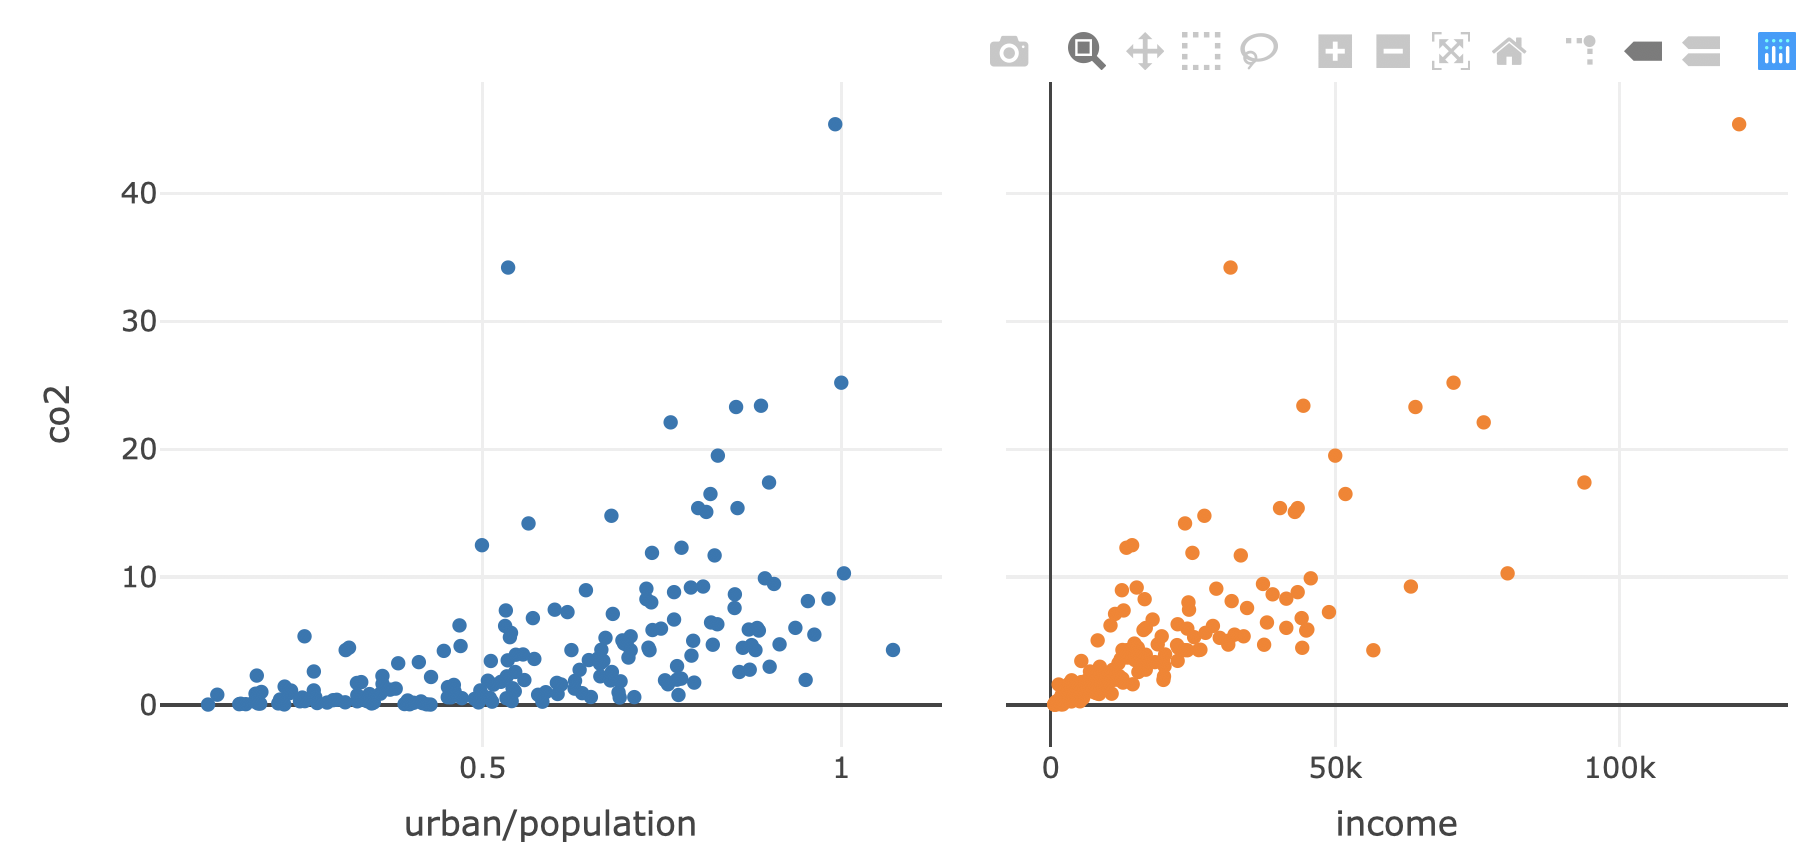
shared_data <- world2014 %>% SharedData$new()
p1 <- shared_data %>%
plot_ly(x=~urban/population, y = ~co2, text = ~country) %>%
add_markers()
p2 <- shared_data %>%
plot_ly(x=~income, y = ~co2, text = ~country) %>%
add_markers()
subplot(p1, p2, titleX = TRUE, shareY = TRUE) %>%
hide_legend()
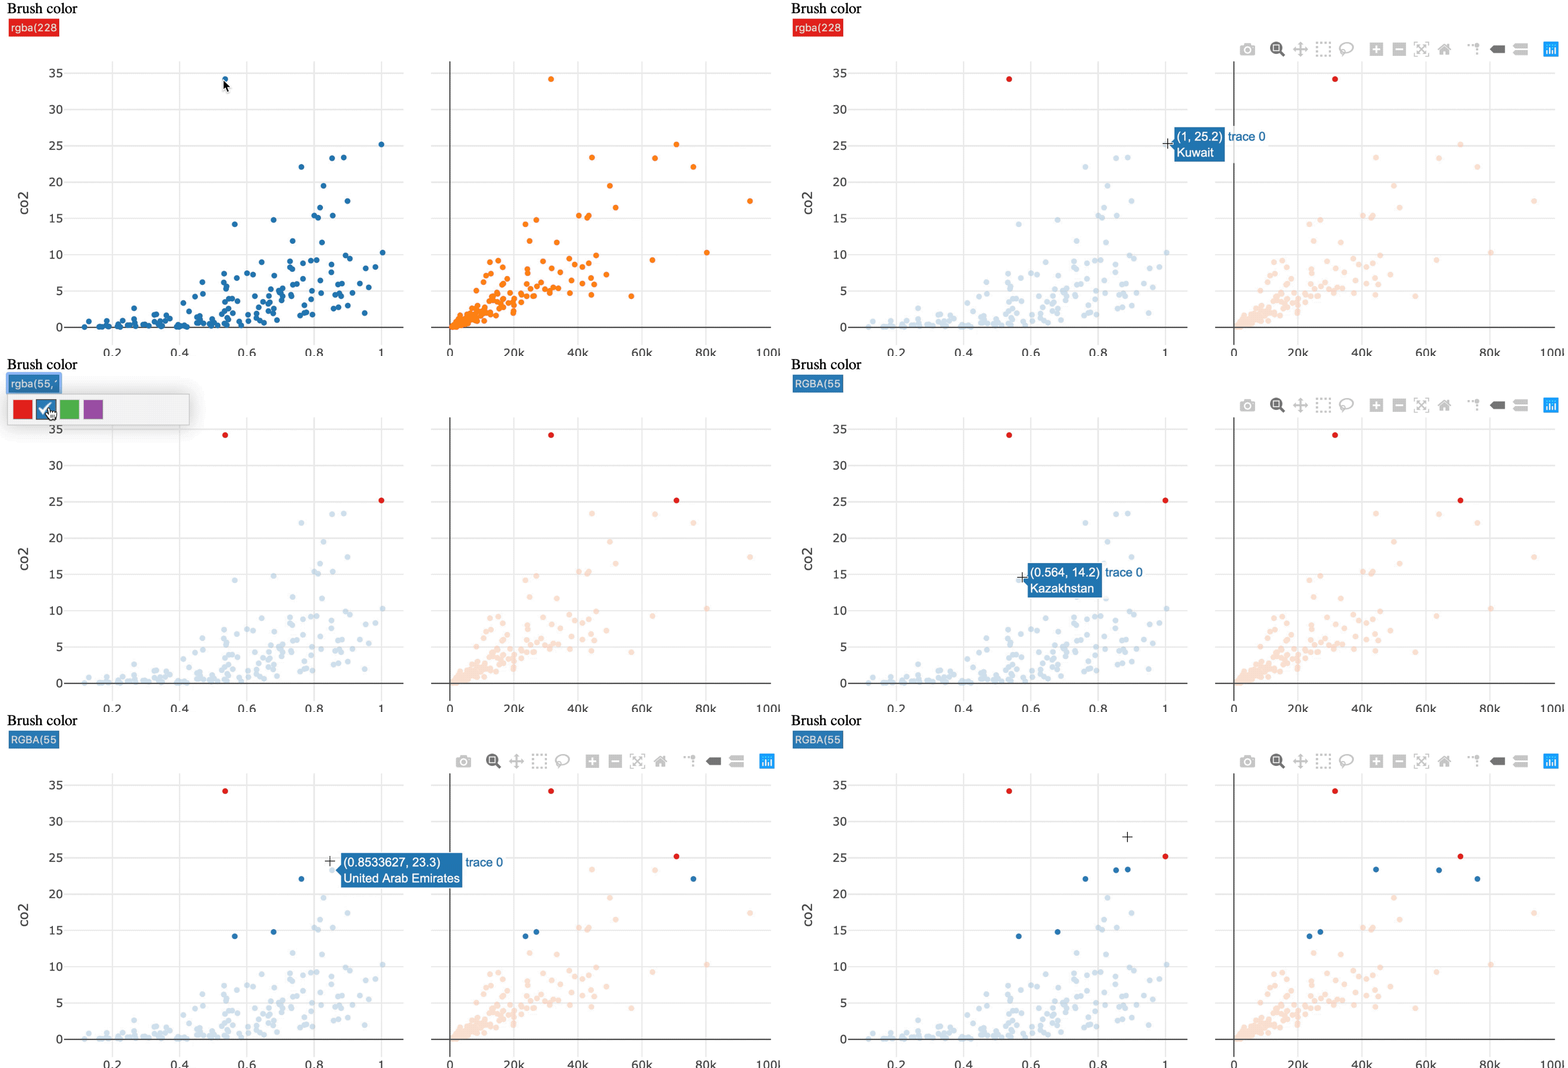
Aktivujte trvalý výběr pomocí highlight()
subplot(p1, p2, titleX = TRUE, shareY = TRUE) %>%
hide_legend() %>%
highlight(persistent = TRUE)
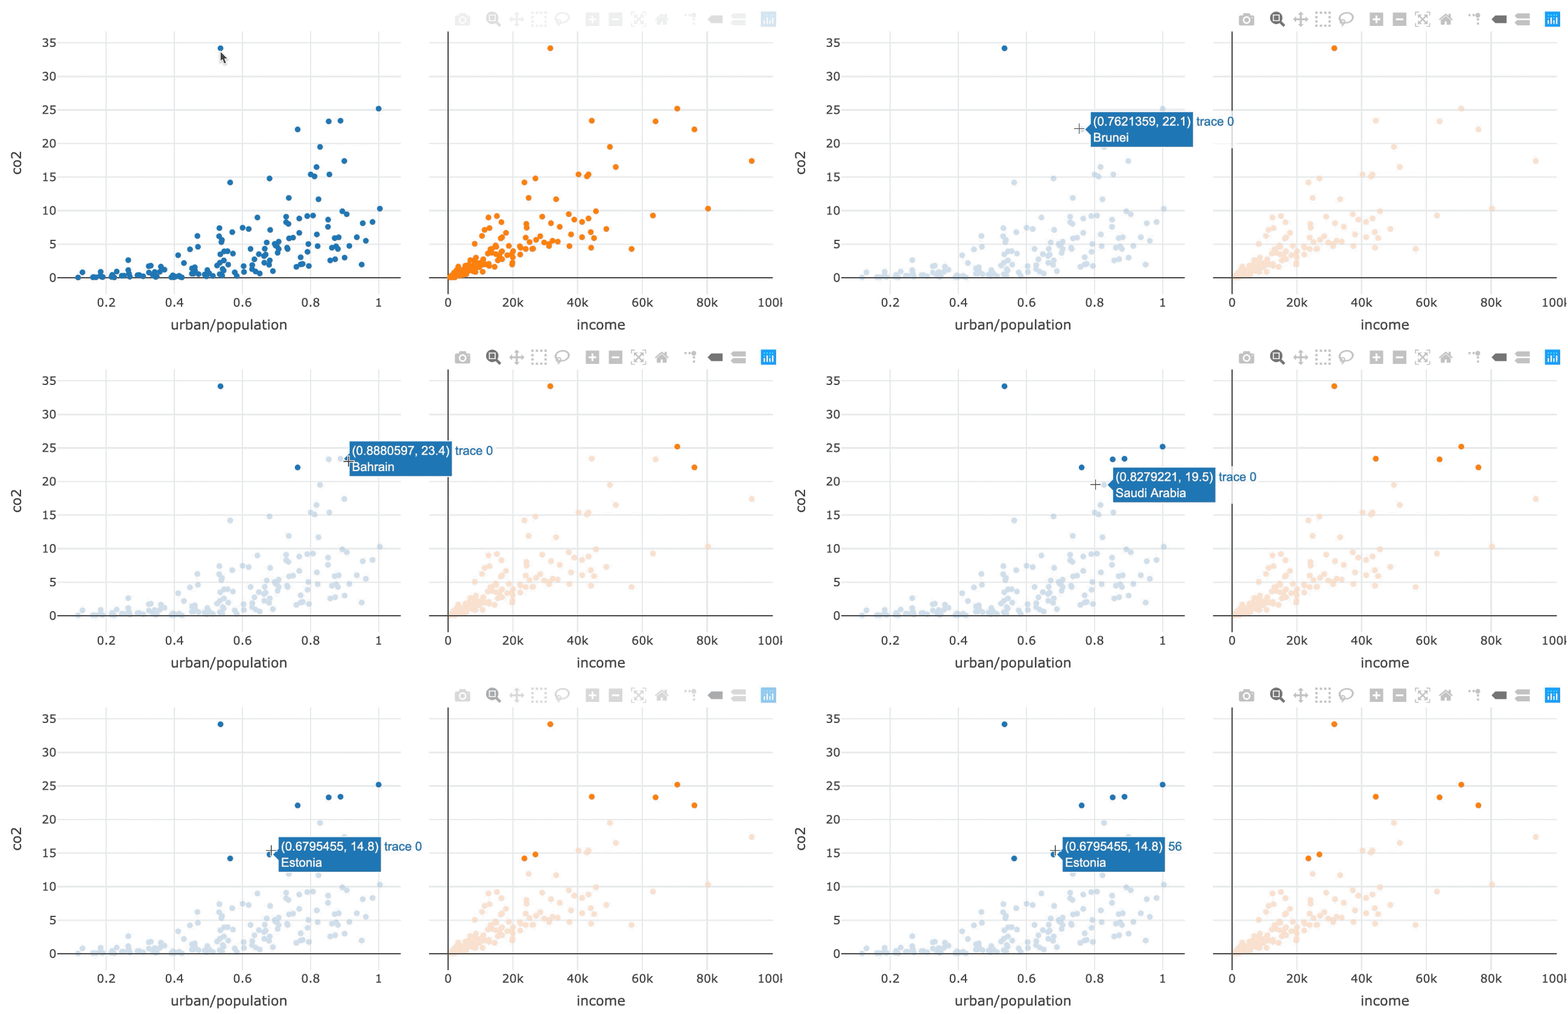

Přidejte dynamic = TRUE pro aktivaci výběru barvy
subplot(p1, p2, titleX = TRUE, shareY = TRUE) %>%
hide_legend() %>%
highlight(persistent = TRUE, dynamic = TRUE)
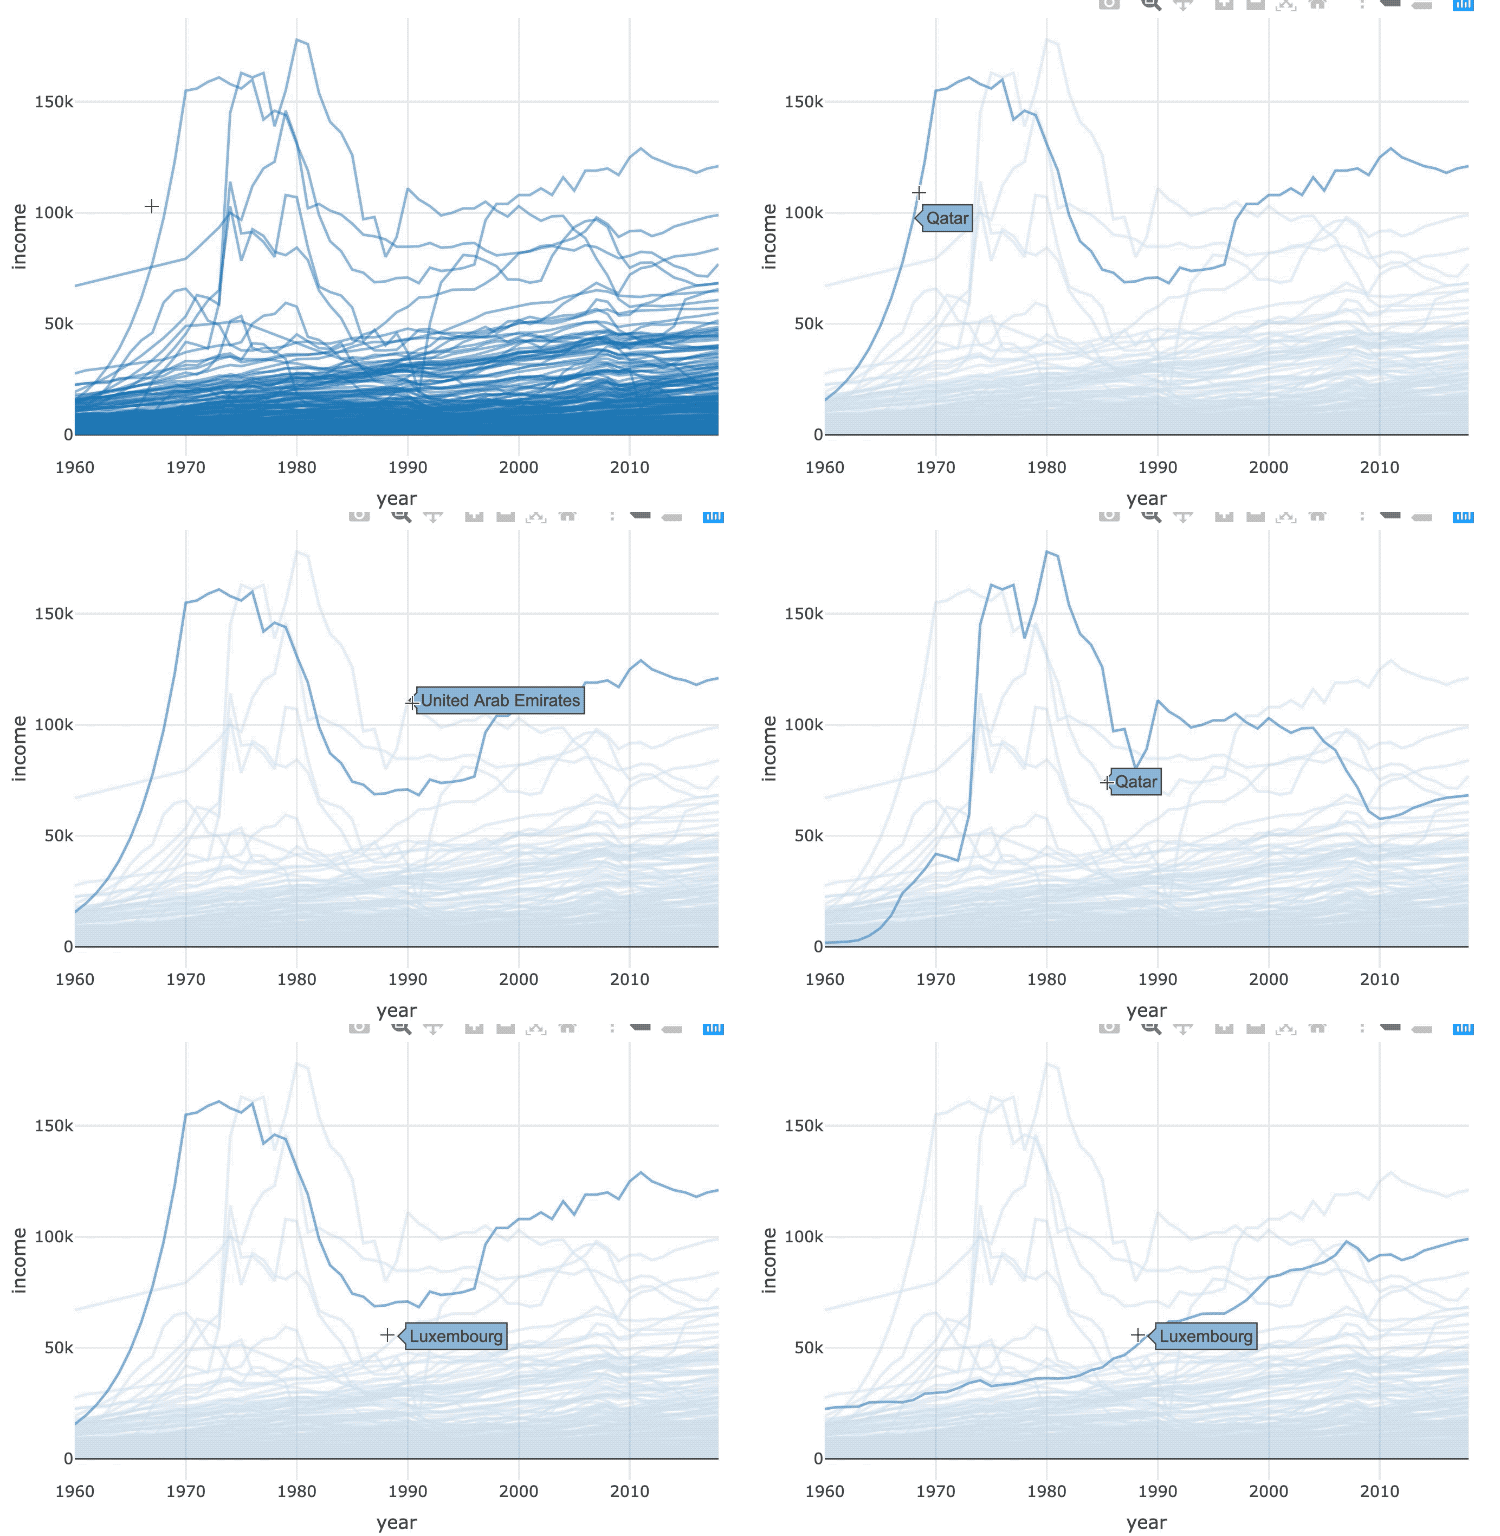
Přímá manipulace
výběr prováděný interakcí s grafickými prvky

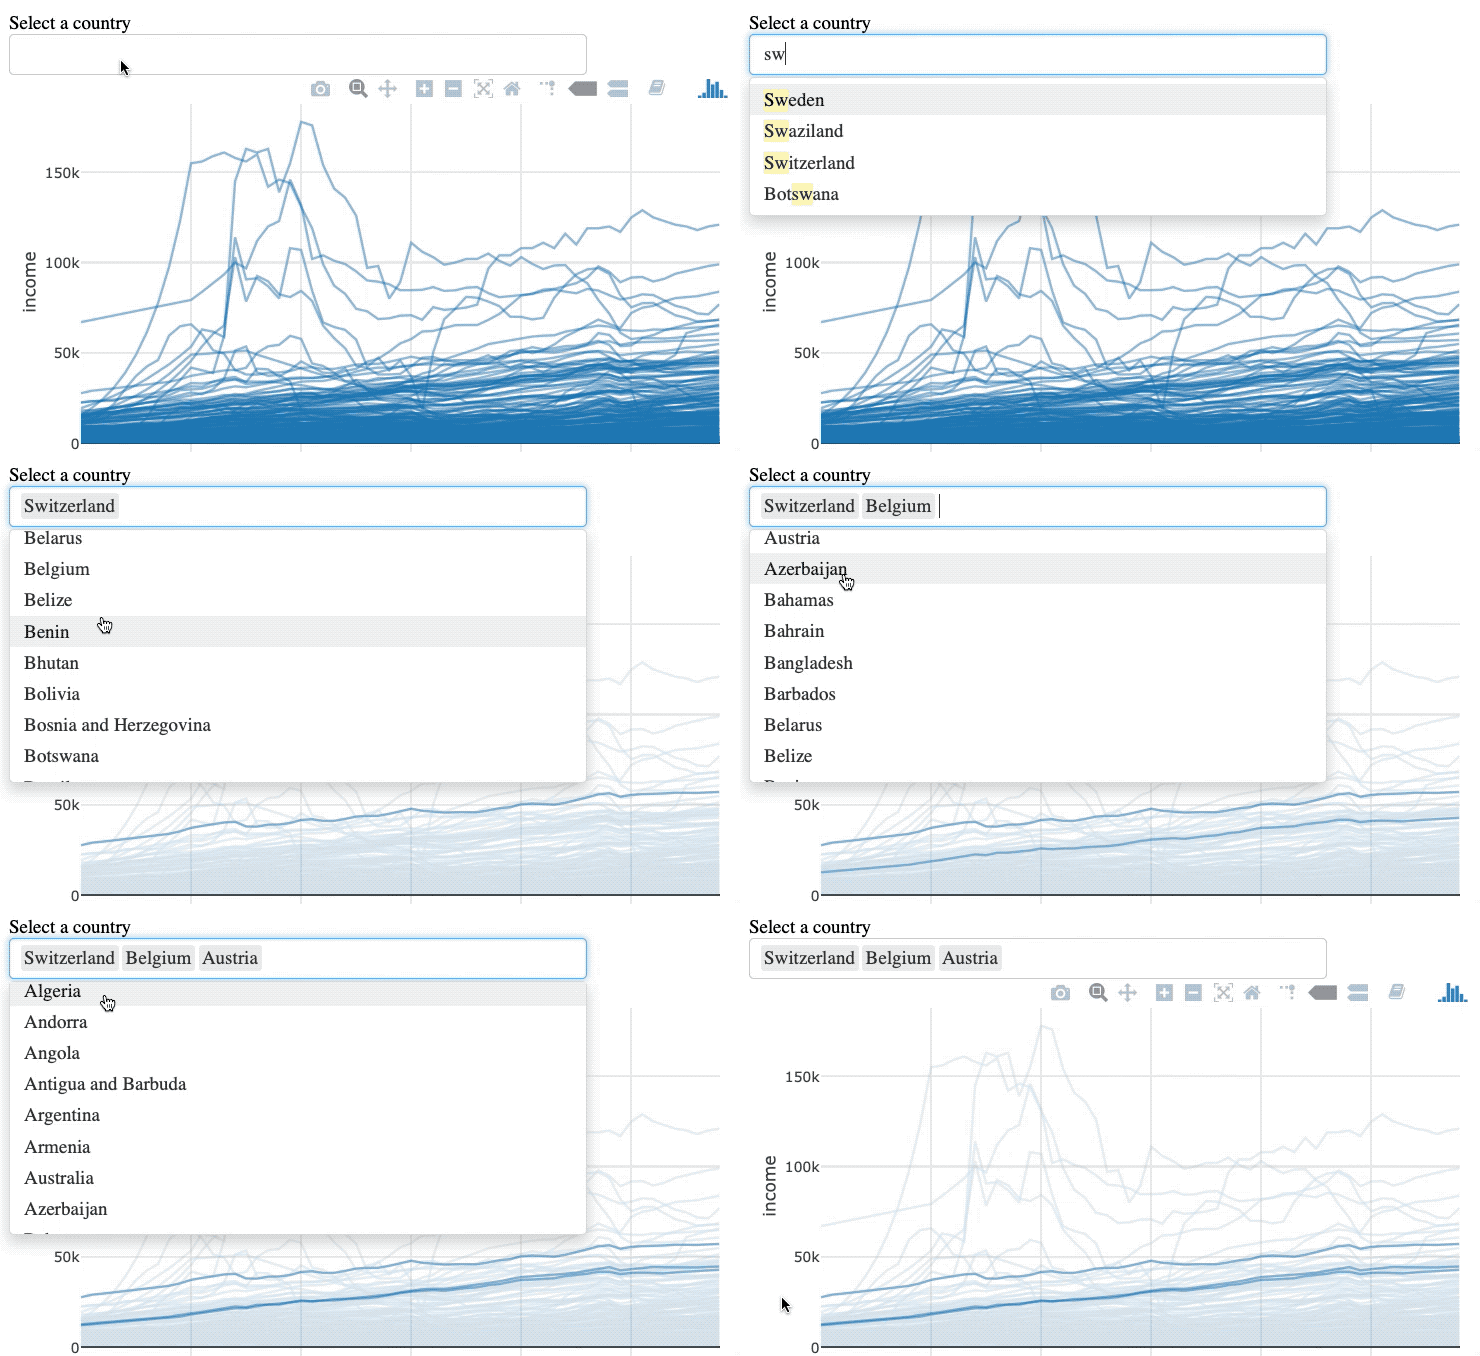
Nepřímá manipulace
výběr prováděný dotazem mimo graf


world_indicators %>%
SharedData$new(key = ~country) %>%
plot_ly(x = ~year, y = ~income, alpha = 0.5) %>%
group_by(country) %>%
add_lines()
world_indicators %>%
SharedData$new(key = ~country, group = "Select a country") %>%
plot_ly(x = ~year, y = ~income, alpha = 0.5) %>%
group_by(country) %>%
add_lines() %>%
highlight(selectize = TRUE)

Intermediate Interactive Data Visualization with plotly in R