Úvod do dat o kosmických startech

Intermediate Interactive Data Visualization with plotly in R

Adam Loy

Statistician, Carleton College

Datová sada startů

Intermediate Interactive Data Visualization with plotly in R

Datová sada startů

dplyr::glimpse(launches)
Rows: 5,726
Columns: 11
$ tag         <chr> "1967-065", "1967-080", "1967-096", "1968-042", …
$ JD          <dbl> 2439671, 2439726, 2439775, 2440000, 2440153, 244…
$ launch_date <date> 1967-06-29, 1967-08-23, 1967-10-11, 1968-05-23,…
$ launch_year <dbl> 1967, 1967, 1967, 1968, 1968, 1969, 1970, 1970, …
$ type        <chr> "Thor Burner 2", "Thor Burner 2", "Thor Burner 2"…
$ variant     <chr> NA, NA, NA, NA, NA, NA, NA, NA, NA, NA, NA, NA, …
$ mission     <chr> "Secor Type II S/N 10", "DAPP 3419", "DAPP 4417"…
$ agency      <chr> "US", "US", "US", "US", "US", "US", "US", "US", …
$ state_code  <chr> "US", "US", "US", "US", "US", "US", "US", "US", …
$ category    <chr> "O", "O", "O", "O", "O", "O", "O", "O", "O", "O"…
$ agency_type <chr> "state", "state", "state", "state", "state", "state"…
Intermediate Interactive Data Visualization with plotly in R

Proměnné

proměnná definice
launch_year rok startu
agency agentura provádějící start
state_code stát agentury
category úspěch (O) nebo selhání (F)
agency_type typ agentury
proměnná definice
tag Harvardský nebo COSPAR identifikátor startu
JD Juliánské datum startu
launch_date datum startu
type typ nosné rakety
variant varianta nosné rakety
mission název mise
Intermediate Interactive Data Visualization with plotly in R

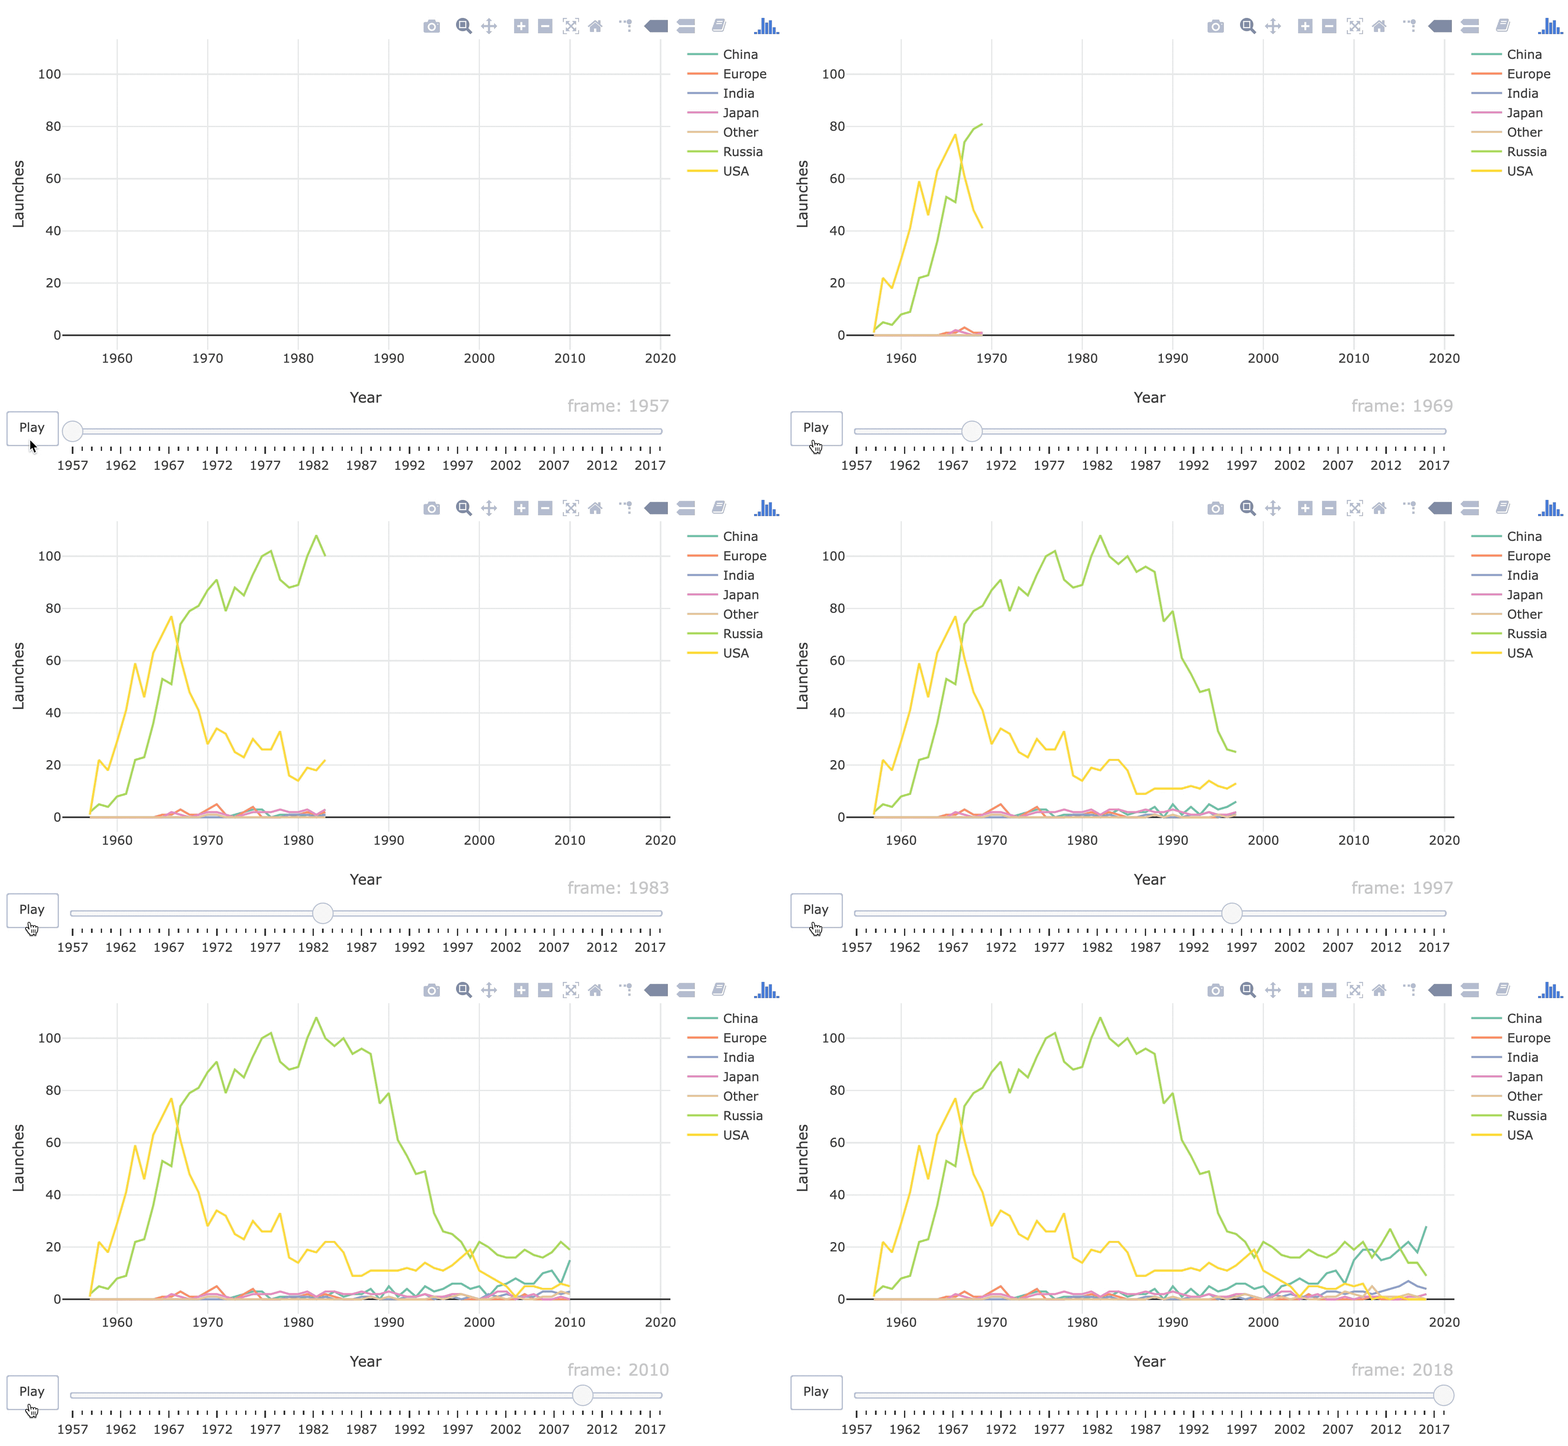
Průzkum vesmírného závodu

space_race_states.gif

Intermediate Interactive Data Visualization with plotly in R

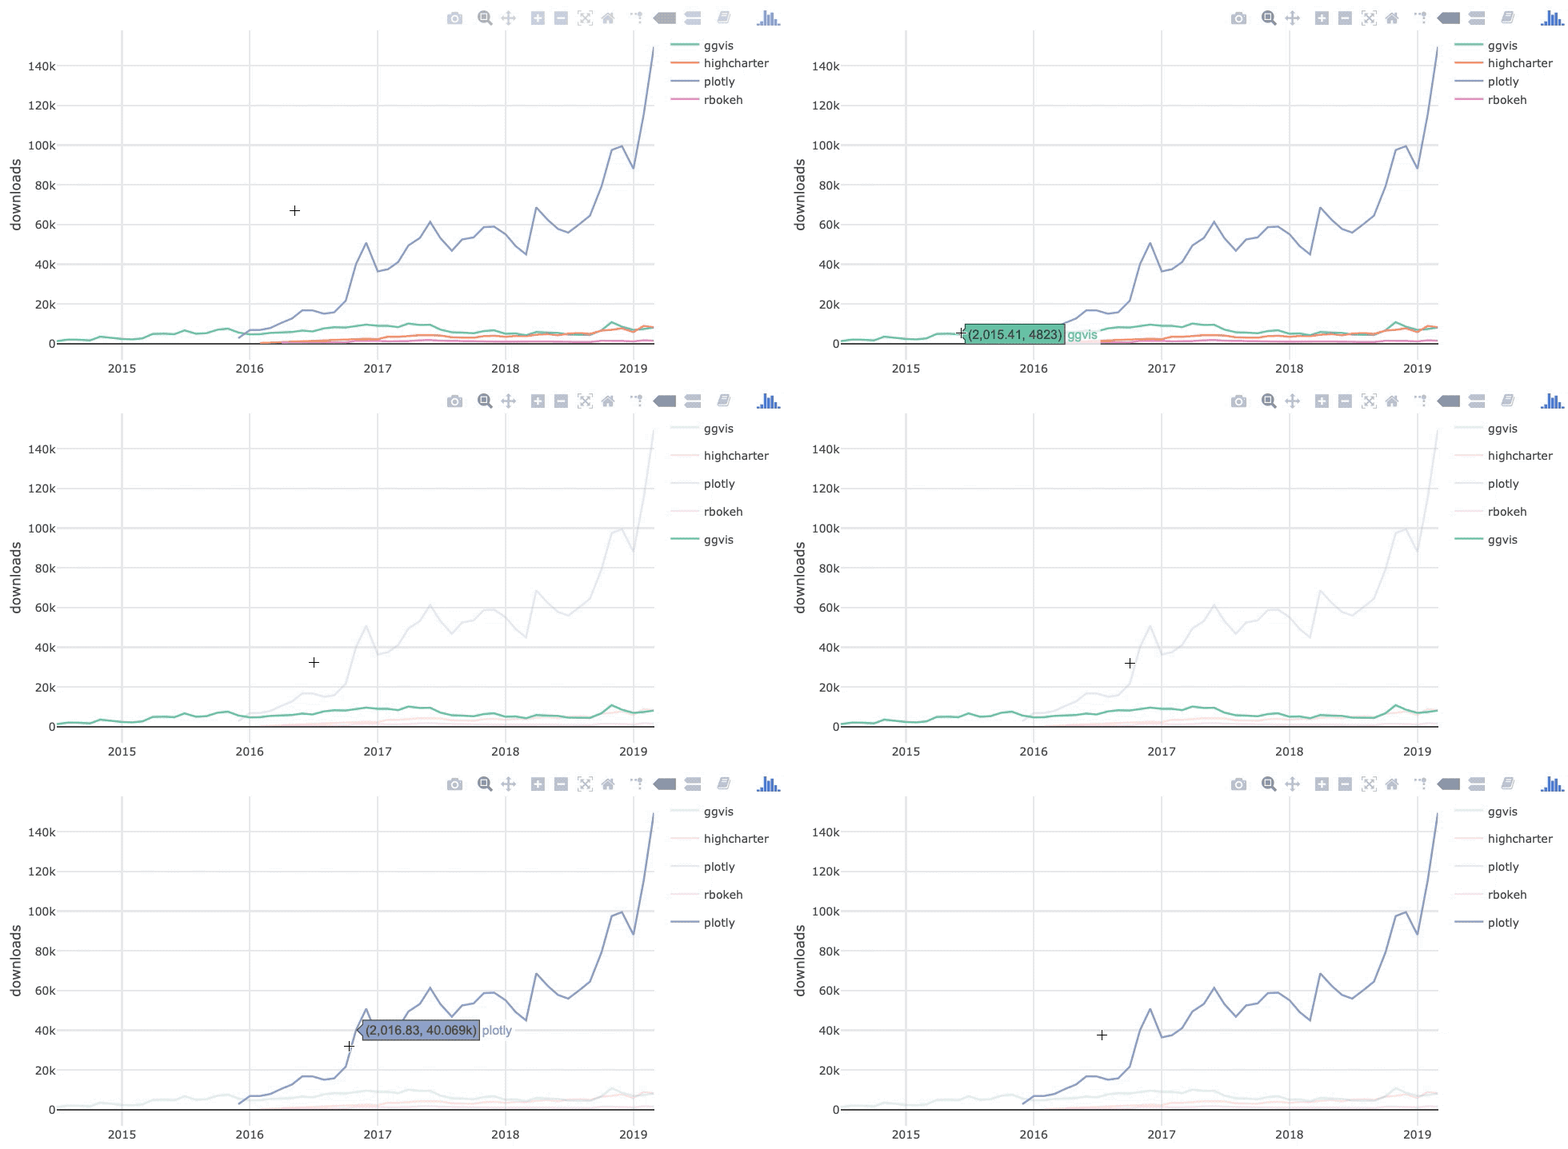
Stahování R balíčků

ch4_1_shareddata_review.gif

Intermediate Interactive Data Visualization with plotly in R

Logy stahování z CRAN

dplyr::glimpse(monthly_logs)
Rows: 171
Columns: 4
$ package   <chr> "ggvis", "ggvis", "ggvis", "ggvis", "ggvis", "ggvis",…
$ date      <date> 2014-06-30, 2014-07-31, 2014-08-31, 2014-09-30, 2014…
$ dec_date  <dbl> 2014.49, 2014.58, 2014.66, 2014.75, 2014.83, 2014.91,…
$ downloads <dbl> 1344, 2120, 2035, 1702, 3590, 2899, 2427, 2227, 2708,…
Intermediate Interactive Data Visualization with plotly in R

Skupinové štětkování

shared_logs <- monthly_logs %>% SharedData$new(key = ~package)

shared_logs %>% plot_ly(x = ~dec_date, y = ~downloads, color = ~package) %>% add_lines() %>% highlight()
Intermediate Interactive Data Visualization with plotly in R

Pojďme si procvičit!

Intermediate Interactive Data Visualization with plotly in R

Preparing Video For Download...