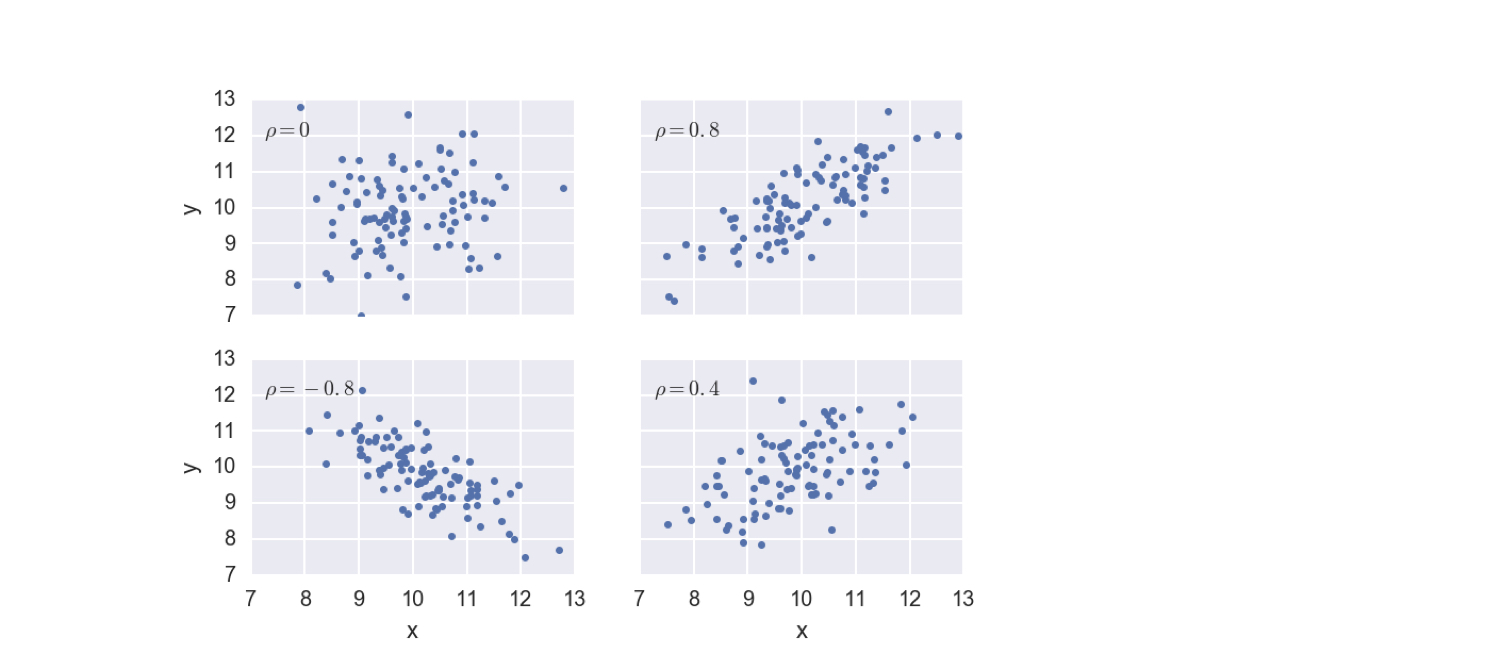
Kovariance a Pearsonův korelační koeficient
Statistical Thinking in Python (Part 1)

Justin Bois
Teaching Professor at the California Institute of Technology
Výsledky voleb 2008 v kolísavých státech USA
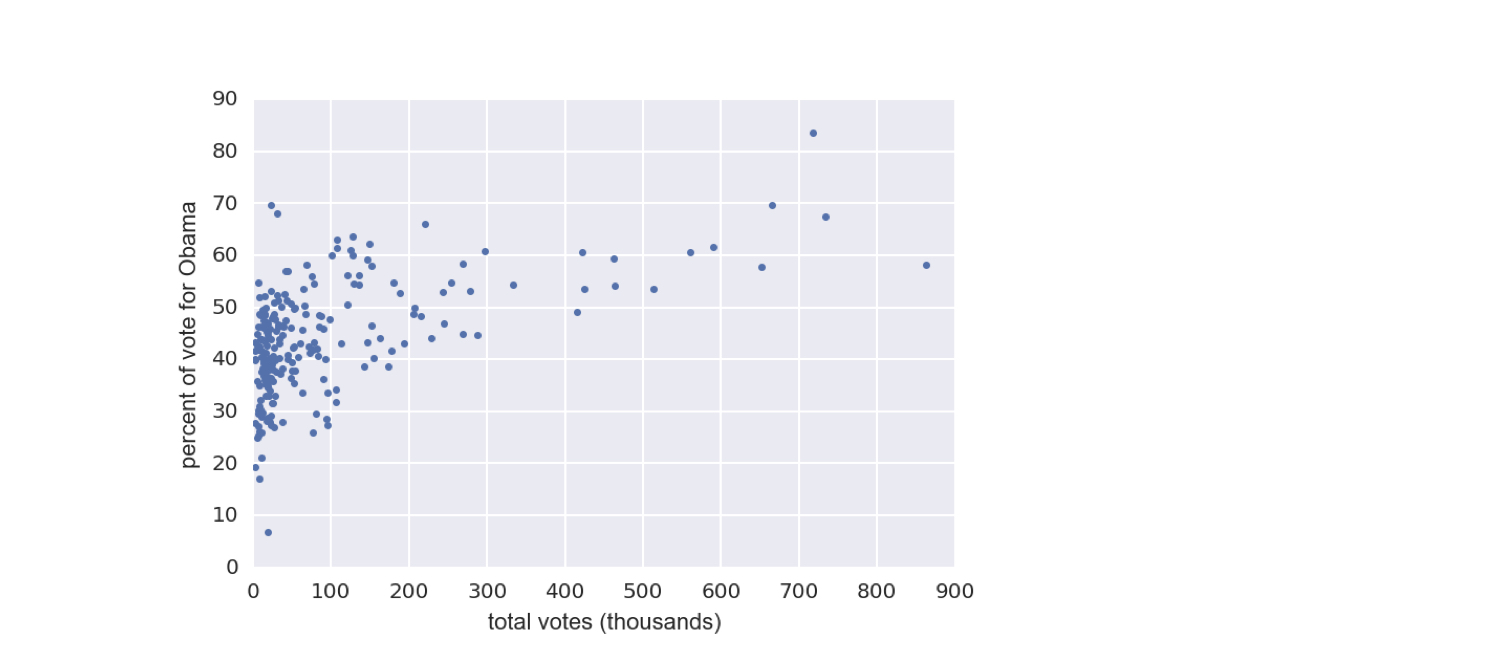
1 Data retrieved from Data.gov (https://www.data.gov/)
Výsledky voleb 2008 v kolísavých státech USA
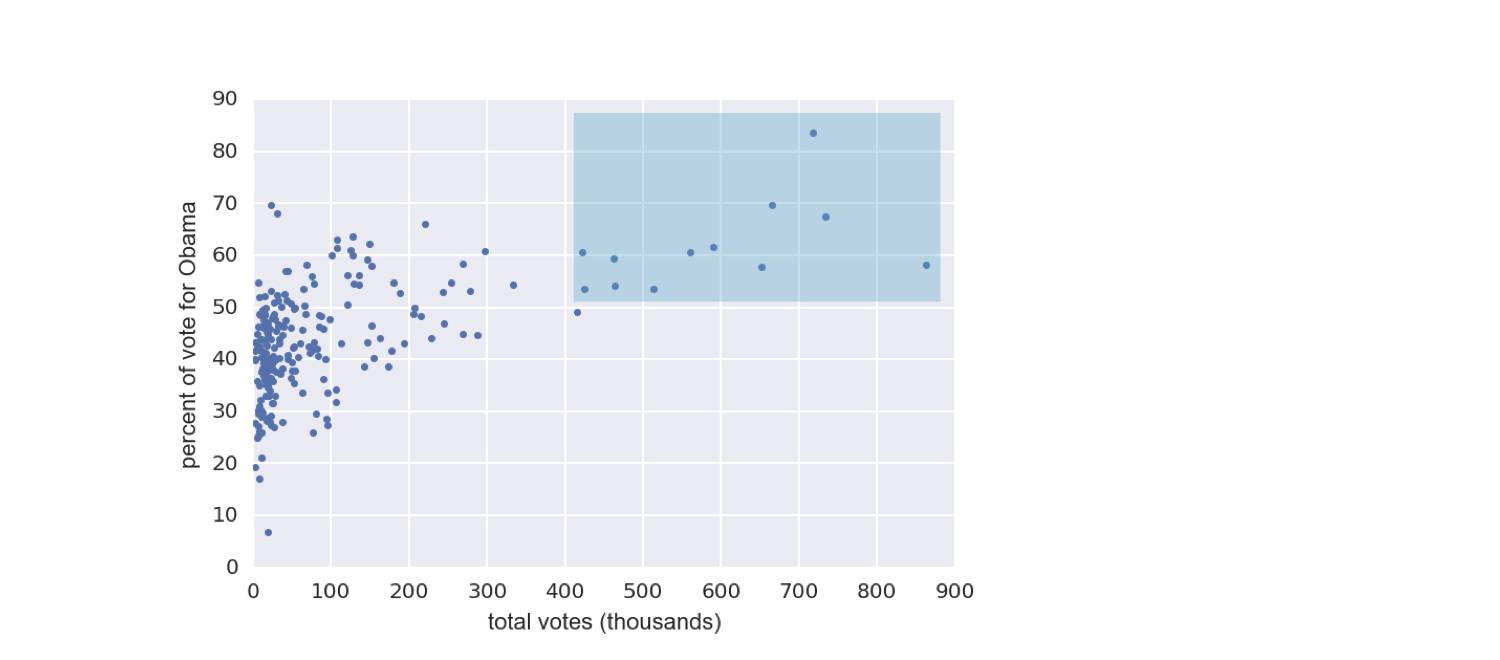
1 Data retrieved from Data.gov (https://www.data.gov/)
Výsledky voleb 2008 v kolísavých státech USA
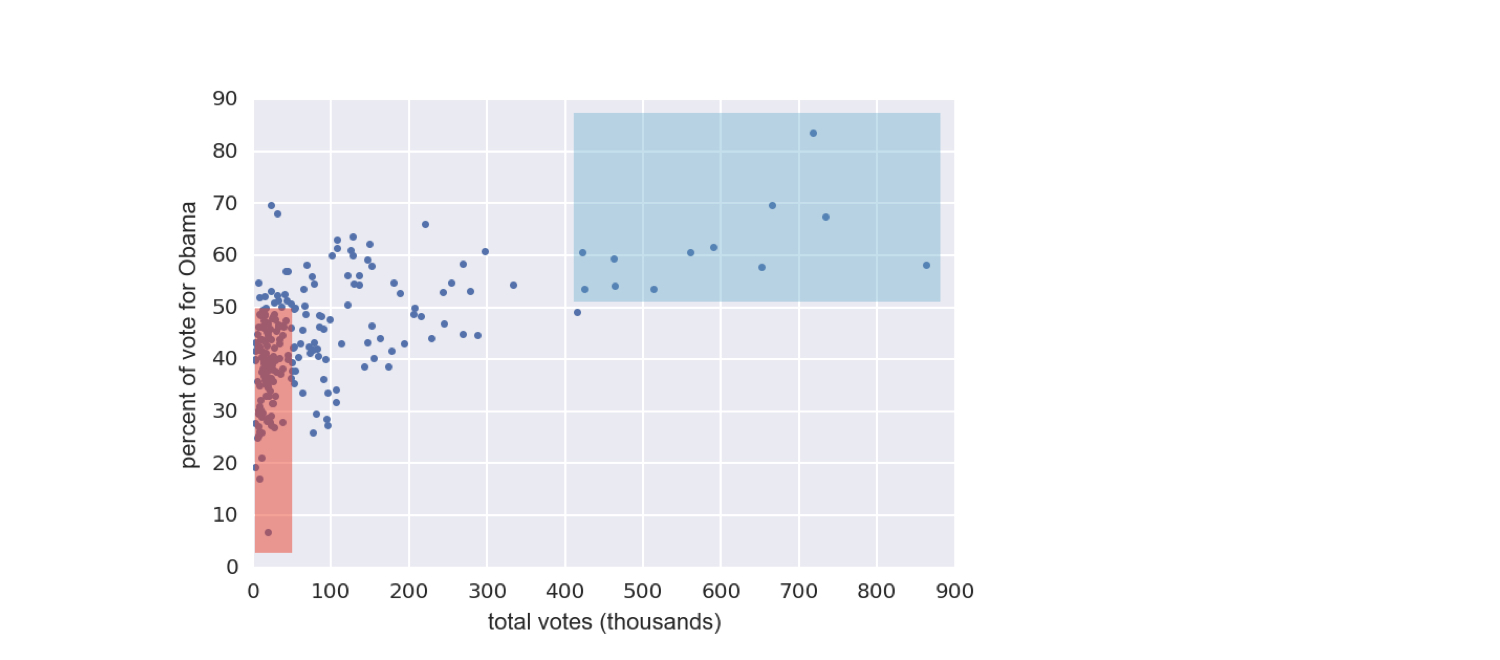
1 Data retrieved from Data.gov (https://www.data.gov/)
Výpočet kovariance
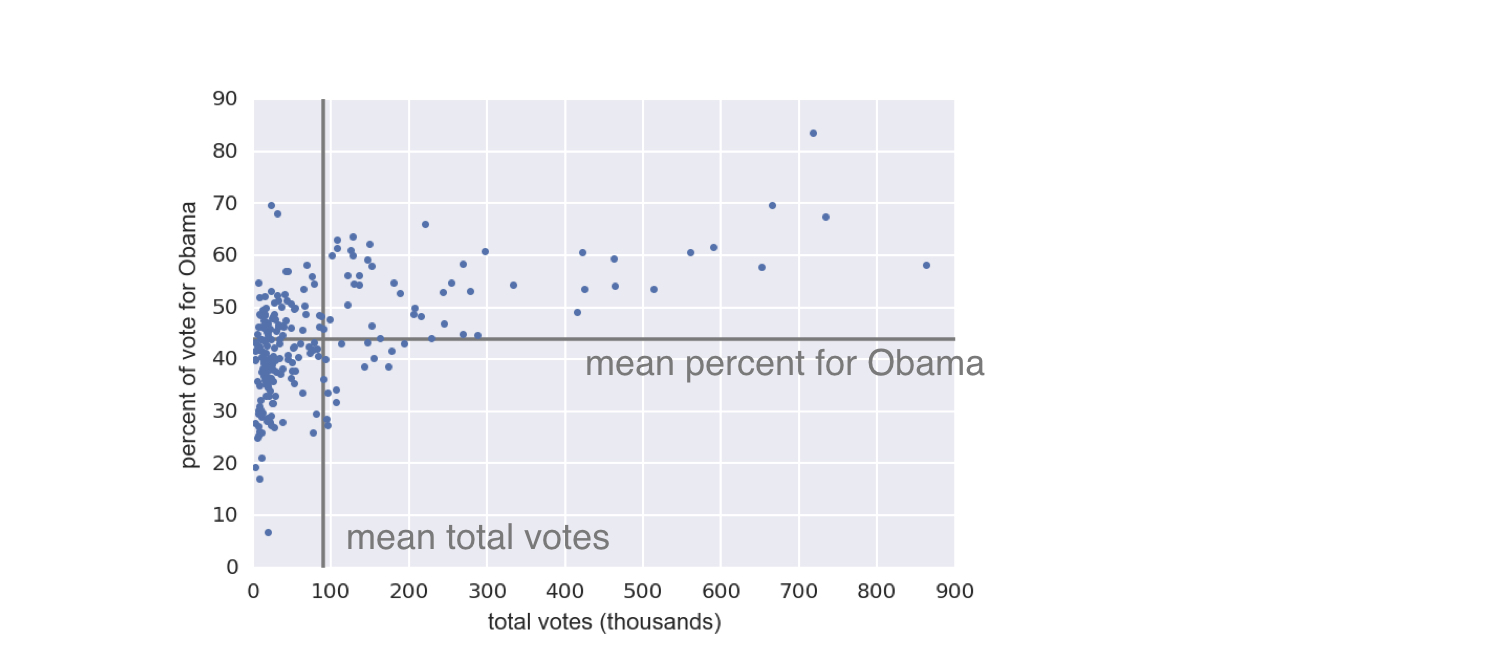
1 Data retrieved from Data.gov (https://www.data.gov/)
Výpočet kovariance
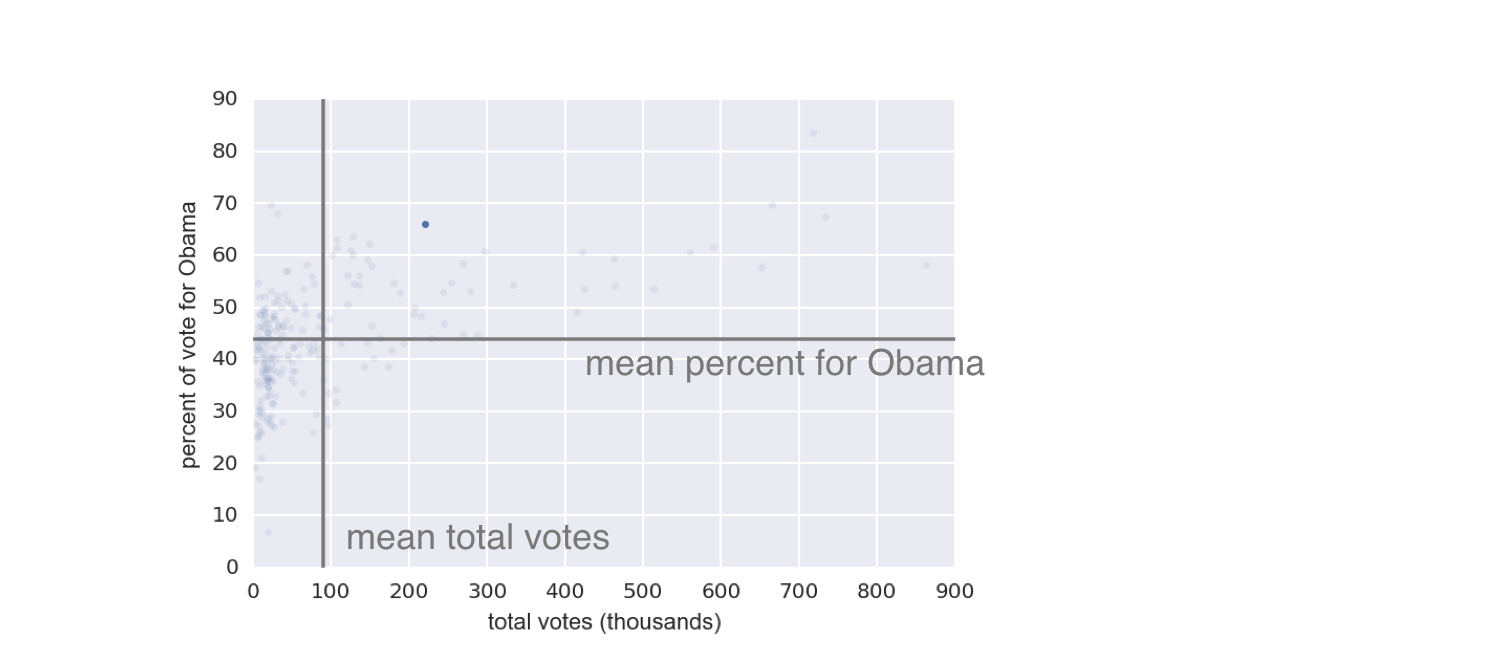
1 Data retrieved from Data.gov (https://www.data.gov/)
Výpočet kovariance
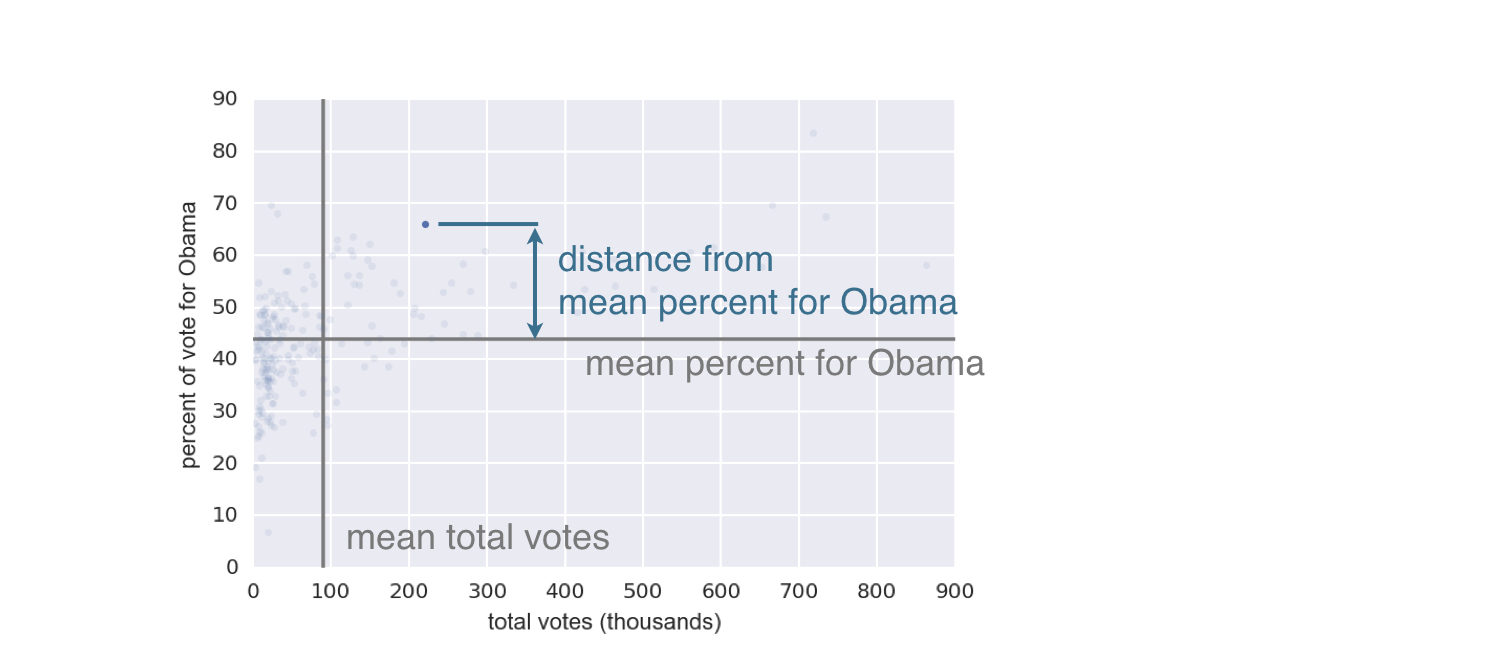
1 Data retrieved from Data.gov (https://www.data.gov/)
Výpočet kovariance
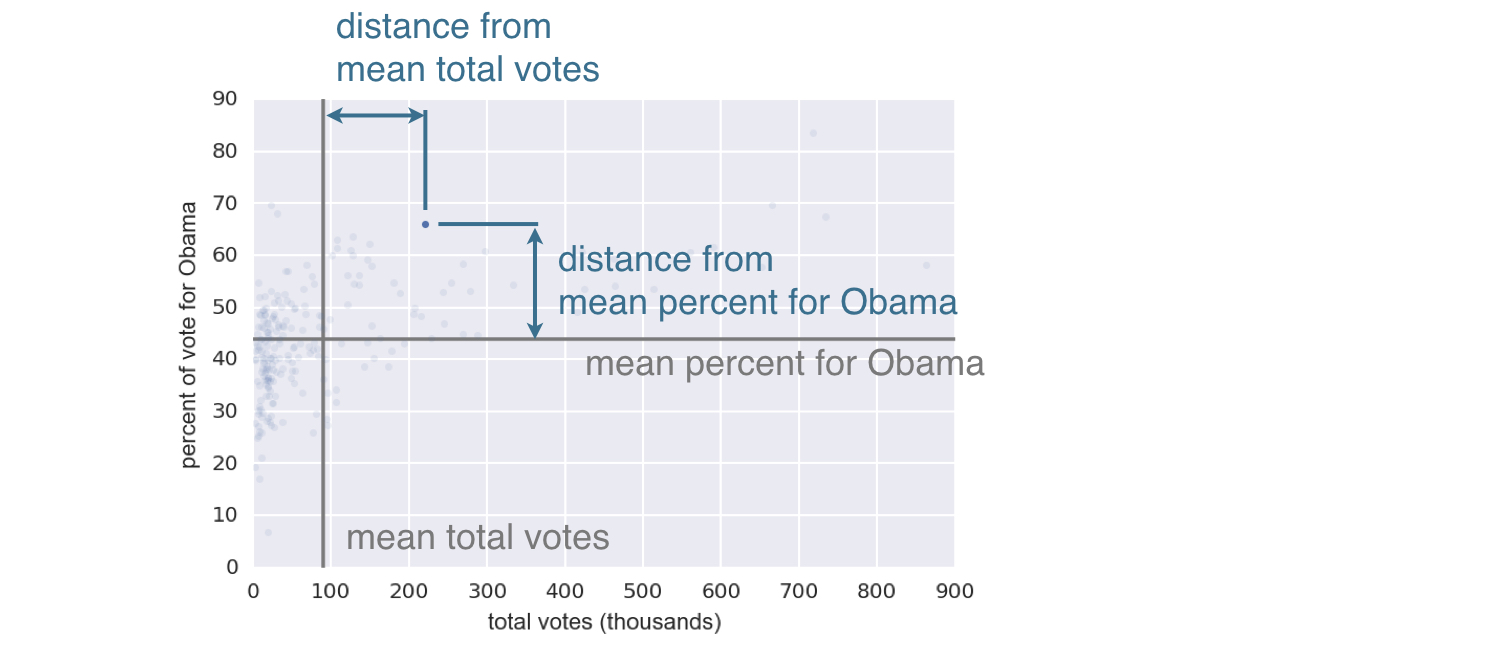
$$covariance = \frac{1}{n}\sum_{i=1}^{n}(x_i - \bar{x})(y_i - \bar{y})$$
1 Data retrieved from Data.gov (https://www.data.gov/)
Příklady Pearsonova korelačního koeficientu