Úprava estetiky

Úvod do vizualizace dat s ggplot2

Rick Scavetta

Founder, Scavetta Academy

Pozice

Úprava překrývání

  • identity
  • dodge
  • stack
  • fill
  • jitter
  • jitterdodge
  • nudge
Úvod do vizualizace dat s ggplot2

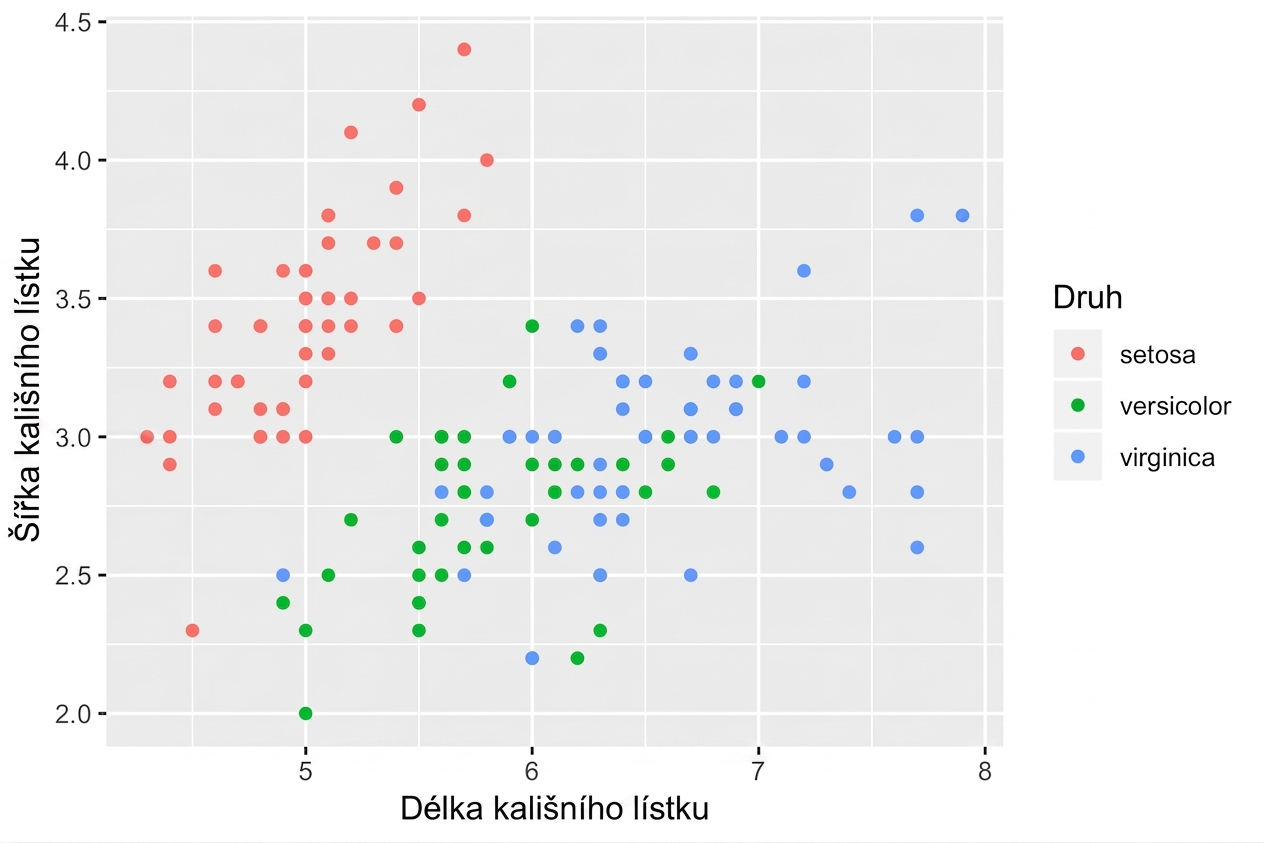
position = "identity" (výchozí)

ggplot(iris, aes(x = Sepal.Length, 
                 y = Sepal.Width, 
                 color = Species)) + 
  geom_point()

Úvod do vizualizace dat s ggplot2

position = "identity" (výchozí)

ggplot(iris, aes(x = Sepal.Length, 
                 y = Sepal.Width, 
                 color = Species)) + 
  geom_point(position = "identity")

Úvod do vizualizace dat s ggplot2

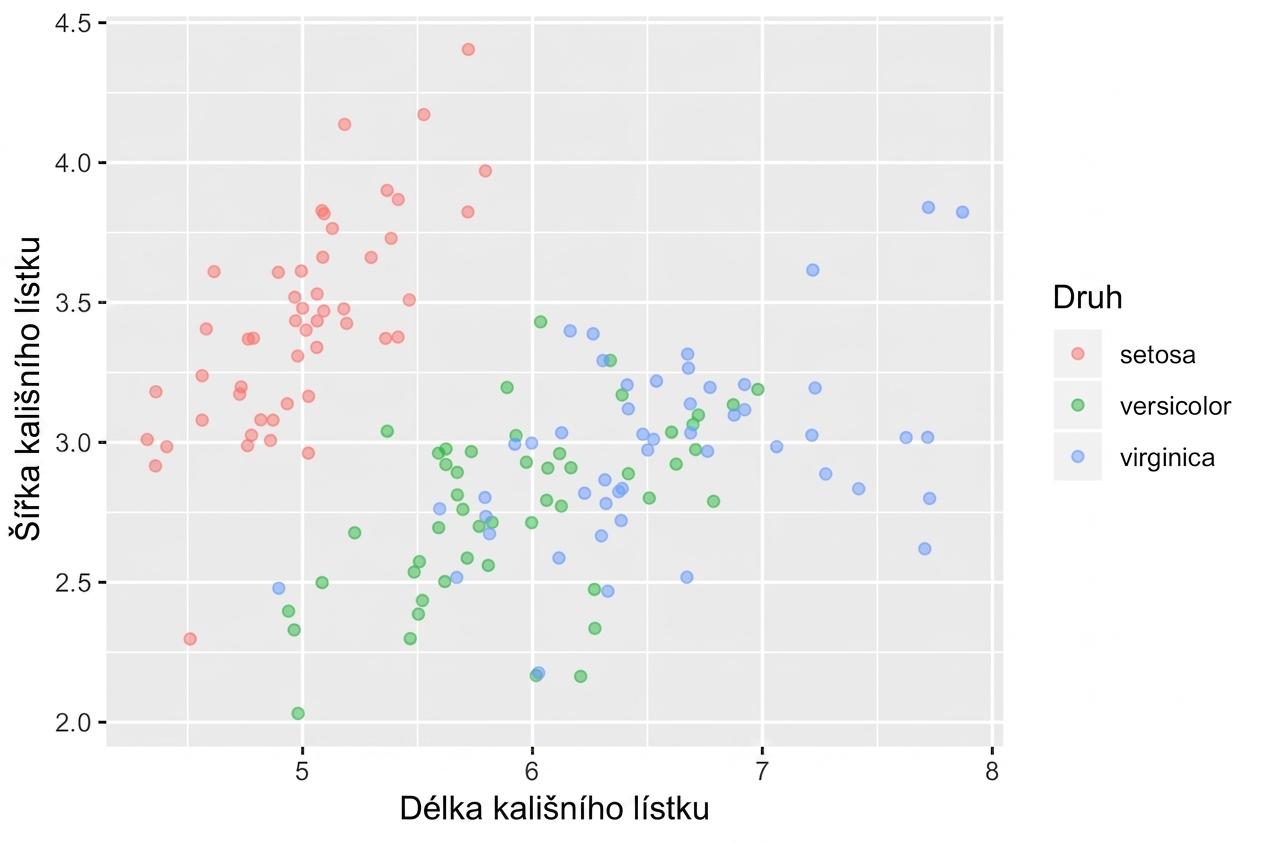
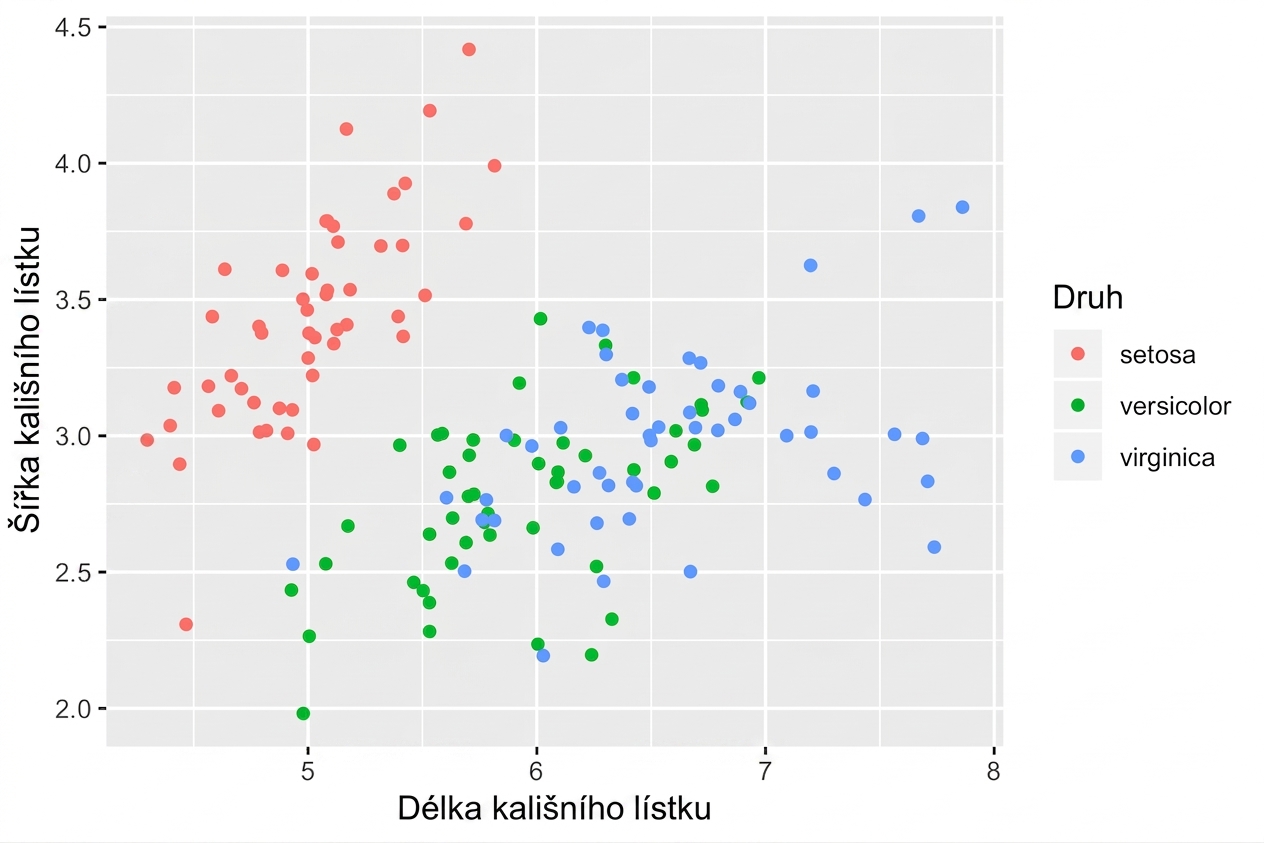
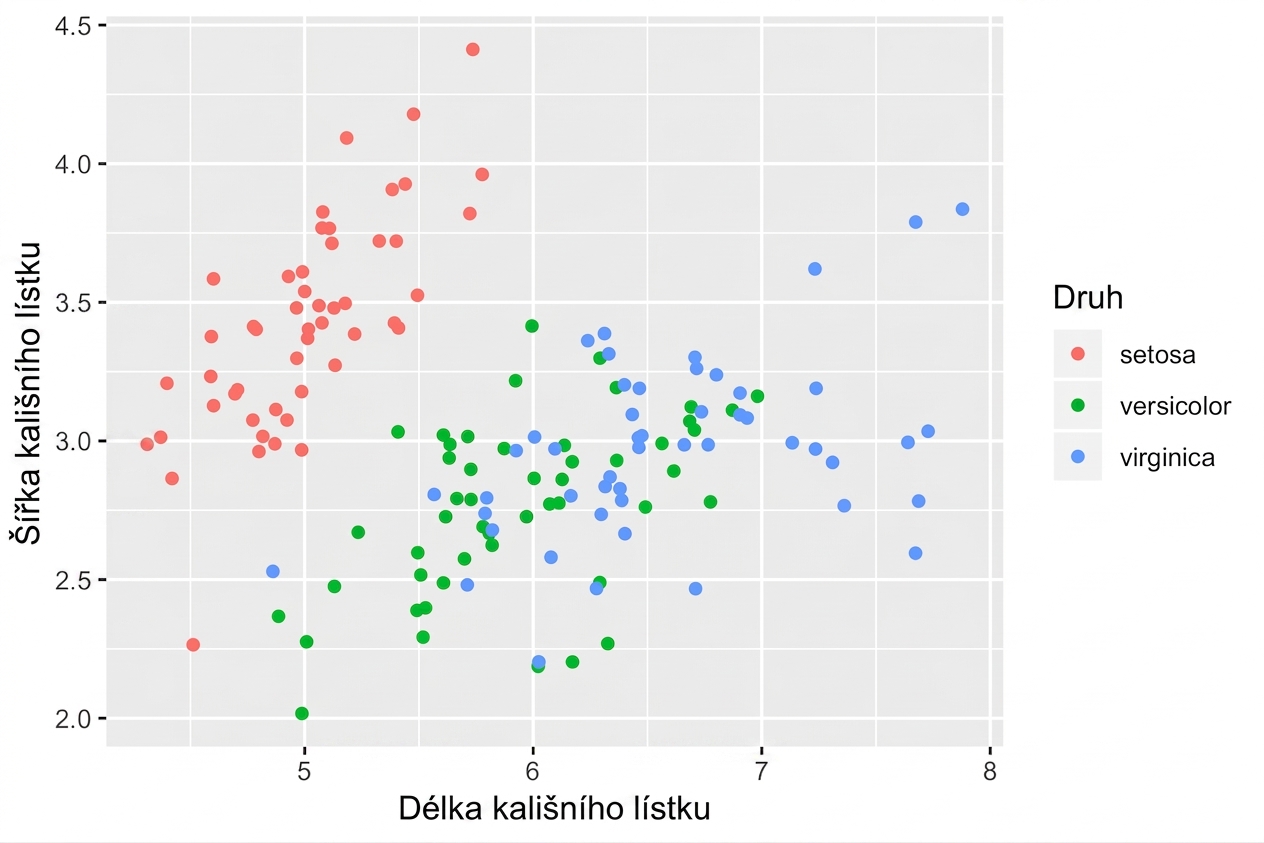
position = "jitter"

ggplot(iris, aes(x = Sepal.Length, 
                 y = Sepal.Width, 
                 color = Species)) + 
  geom_point(position = "jitter")

Úvod do vizualizace dat s ggplot2

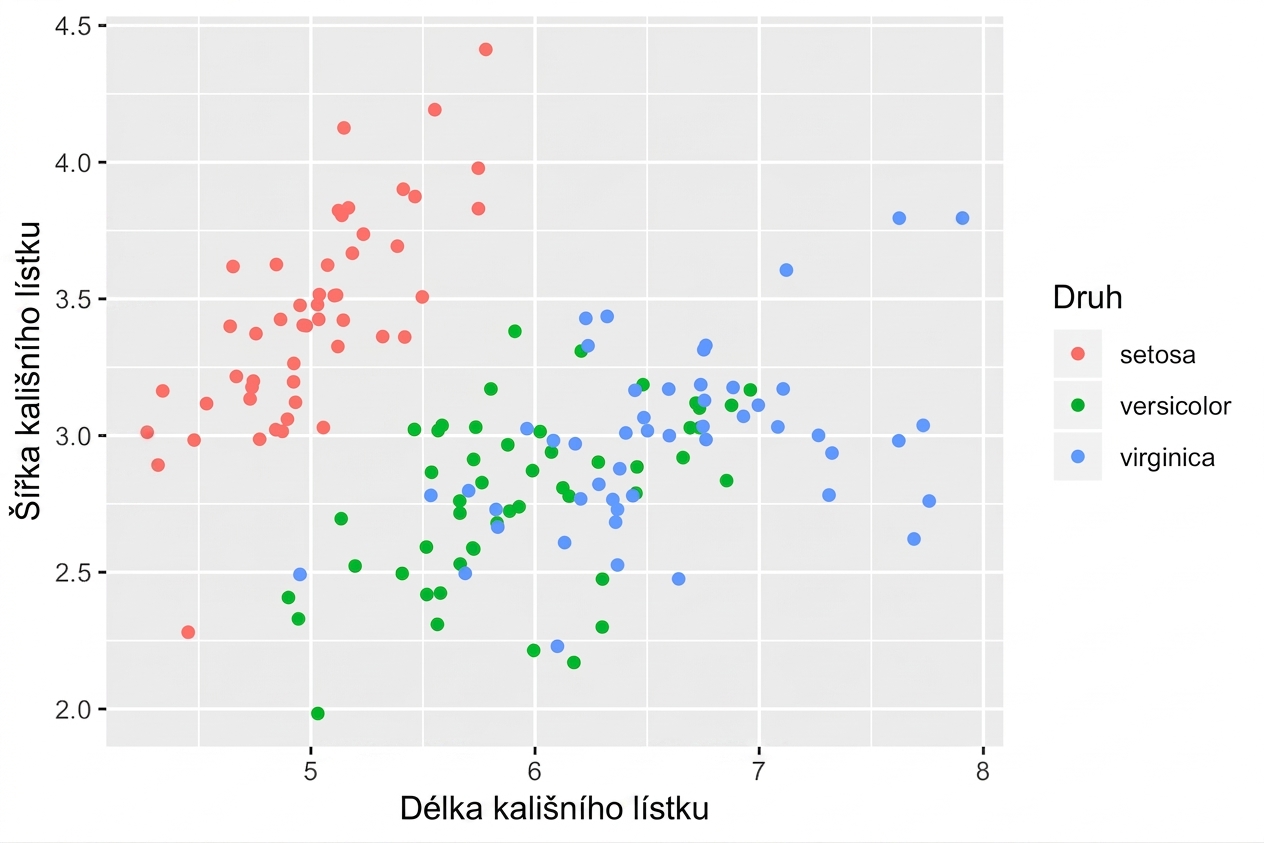
position_jitter()

posn_j <- position_jitter(0.1)

ggplot(iris, aes(x = Sepal.Length, 
                 y = Sepal.Width, 
                 col = Species)) +
  geom_point(position = posn_j)

Úvod do vizualizace dat s ggplot2

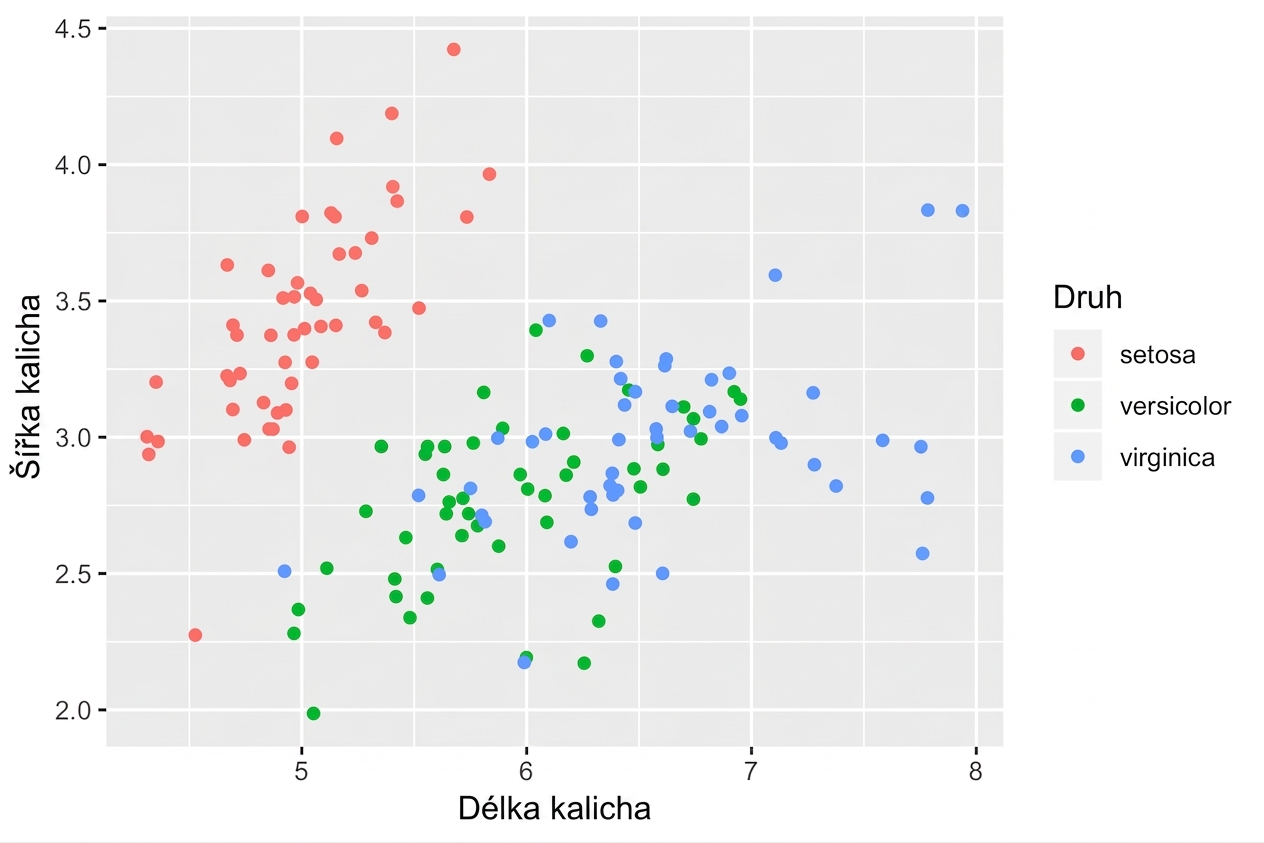
position_jitter()

posn_j <- position_jitter(0.1, 
                          seed = 136)

ggplot(iris, aes(x = Sepal.Length, 
                 y = Sepal.Width, 
                 color = Species)) + 
  geom_point(position = posn_j)
  • Nastavení argumentů pozice
  • Konzistence napříč grafy a vrstvami

Úvod do vizualizace dat s ggplot2

Funkce škálování

  • scale_x_*()
  • scale_y_*()
  • scale_color_*()
    • Také scale_colour_*()
  • scale_fill_*()
  • scale_shape_*()
  • scale_linetype_*()
  • scale_size_*()
Úvod do vizualizace dat s ggplot2

Funkce škálování

  • scale_x_continuous()
  • scale_y_*()
  • scale_color_discrete()
    • Alternativně scale_colour_*()
  • scale_fill_*()
  • scale_shape_*()
  • scale_linetype_*()
  • scale_size_*()
Úvod do vizualizace dat s ggplot2

scale_*_*()

ggplot(iris, aes(x = Sepal.Length, 
                 y = Sepal.Width, 
                 color = Species)) + 
  geom_point(position = "jitter") +
  scale_x_continuous("Sepal Length") +
  scale_color_discrete("Species")

Úvod do vizualizace dat s ggplot2

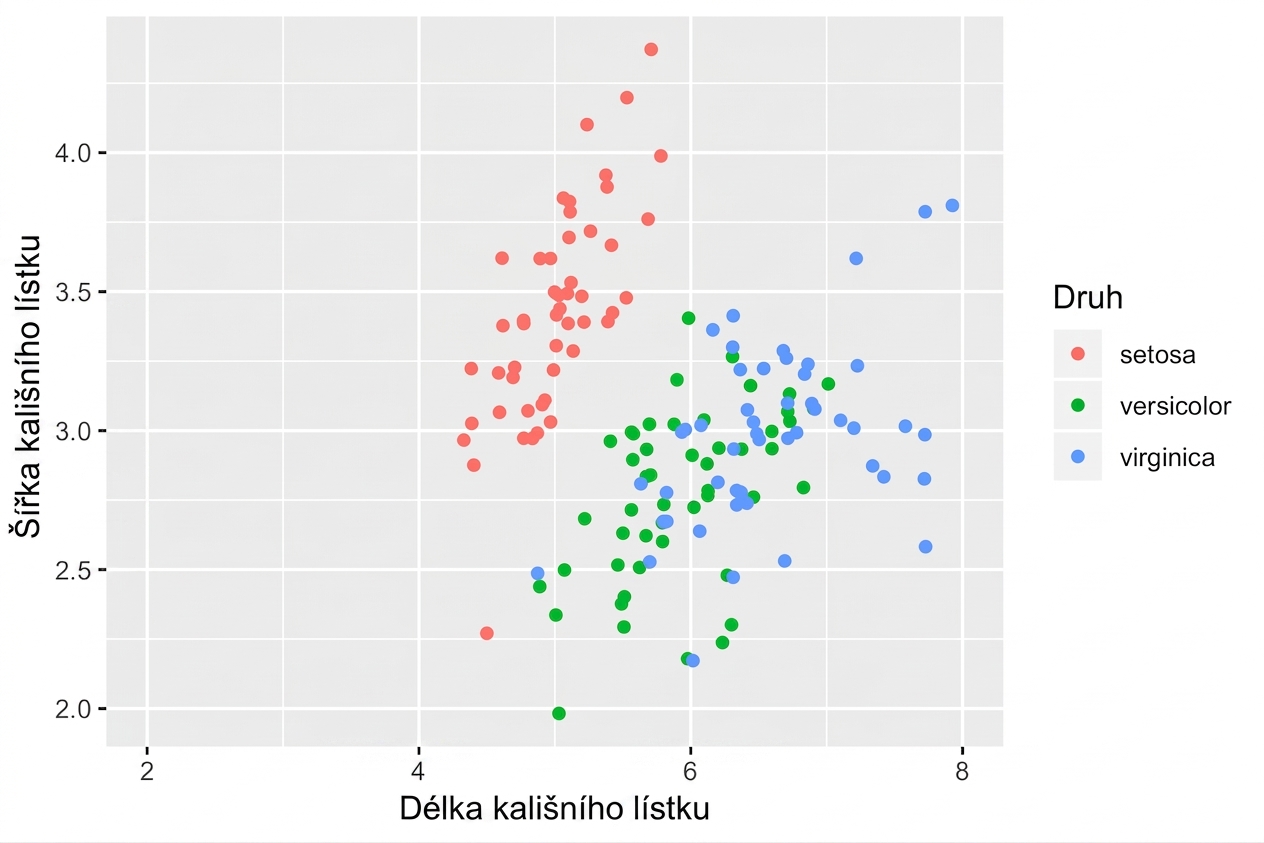
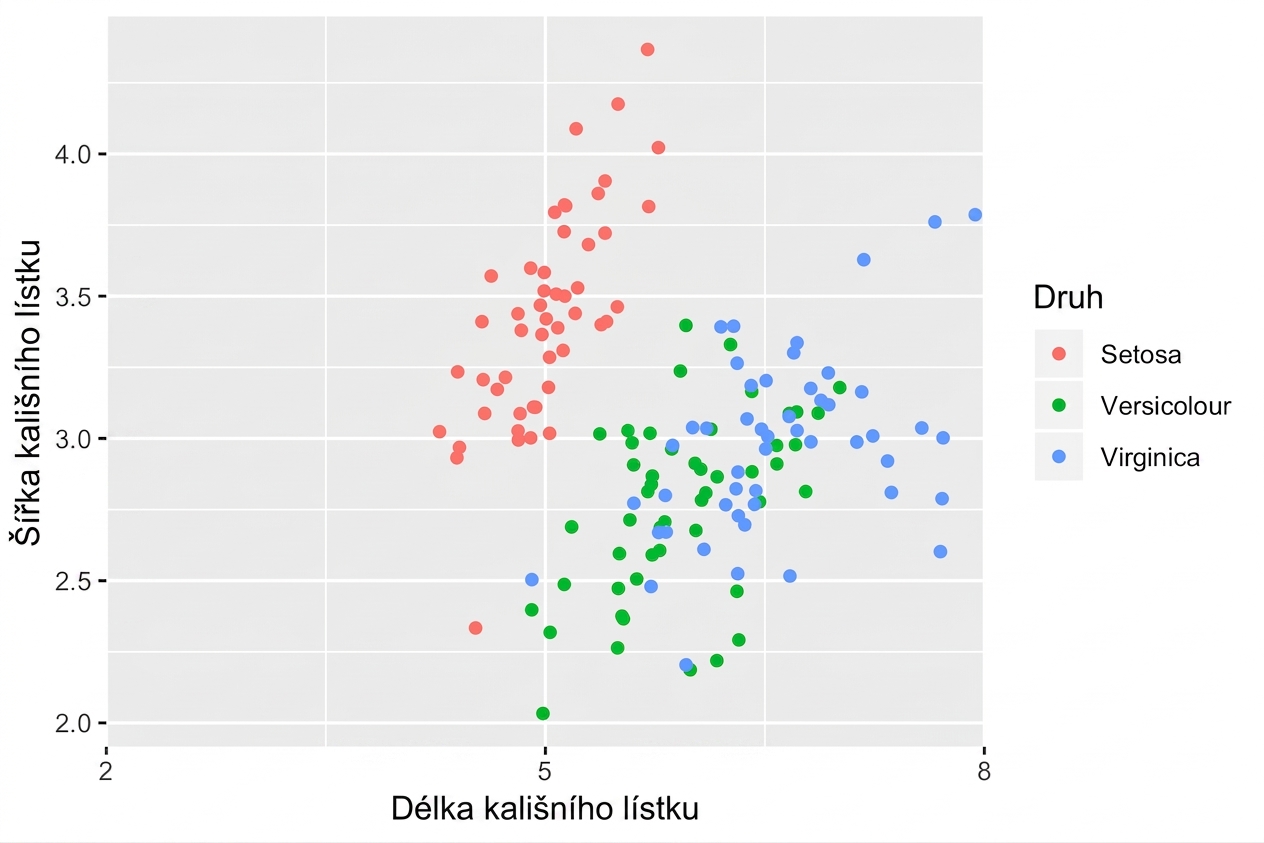
Argument limits

ggplot(iris, aes(x = Sepal.Length, 
                  y = Sepal.Width, 
                 color = Species)) + 
  geom_point(position = "jitter") +
  scale_x_continuous("Sepal Length", 
                     limits = c(2,8)) +
  scale_color_discrete("Species")

Úvod do vizualizace dat s ggplot2

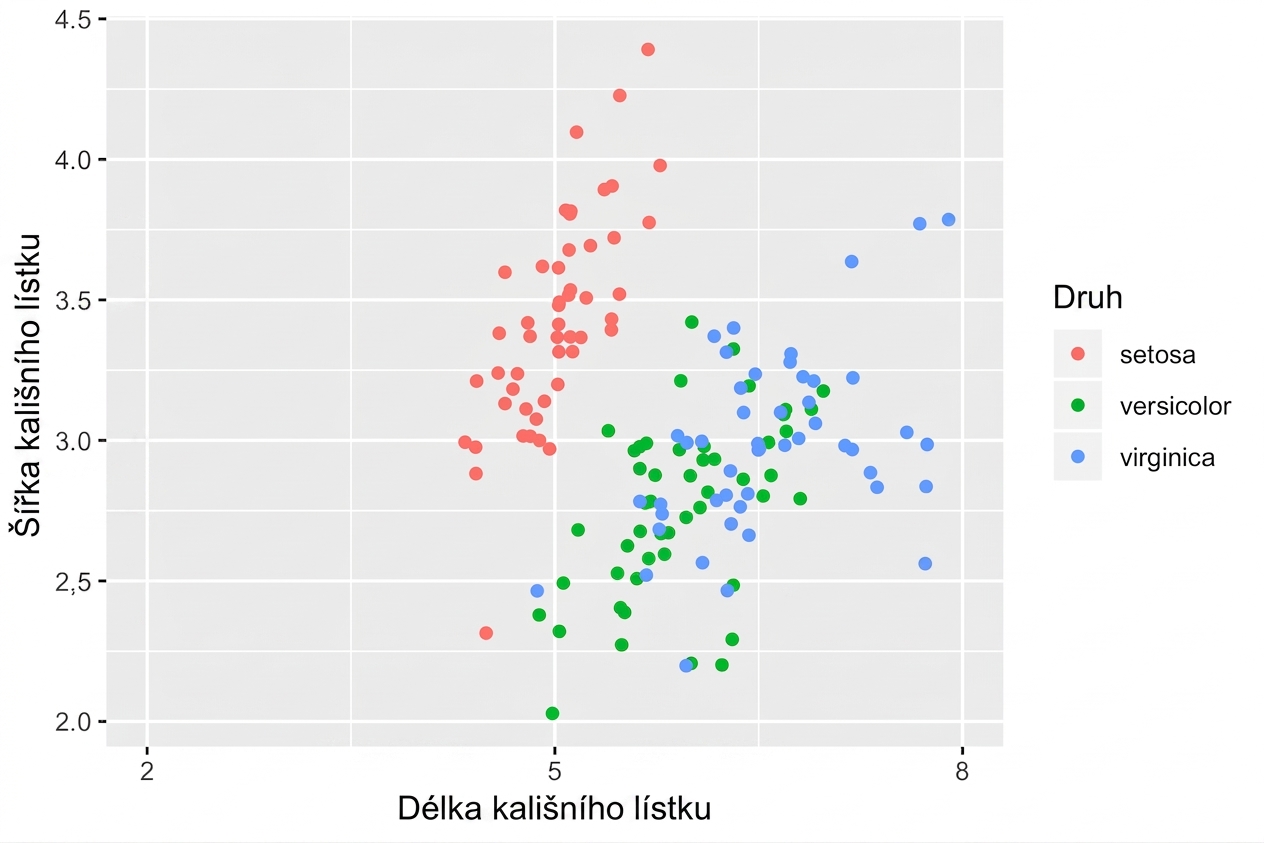
Argument breaks

ggplot(iris, aes(x = Sepal.Length, 
                  y = Sepal.Width, 
                 color = Species)) + 
  geom_point(position = "jitter") +
  scale_x_continuous("Sepal Length", 
                     limits = c(2, 8), 
                     breaks = seq(2, 8, 3)) +
  scale_color_discrete("Species")

Úvod do vizualizace dat s ggplot2

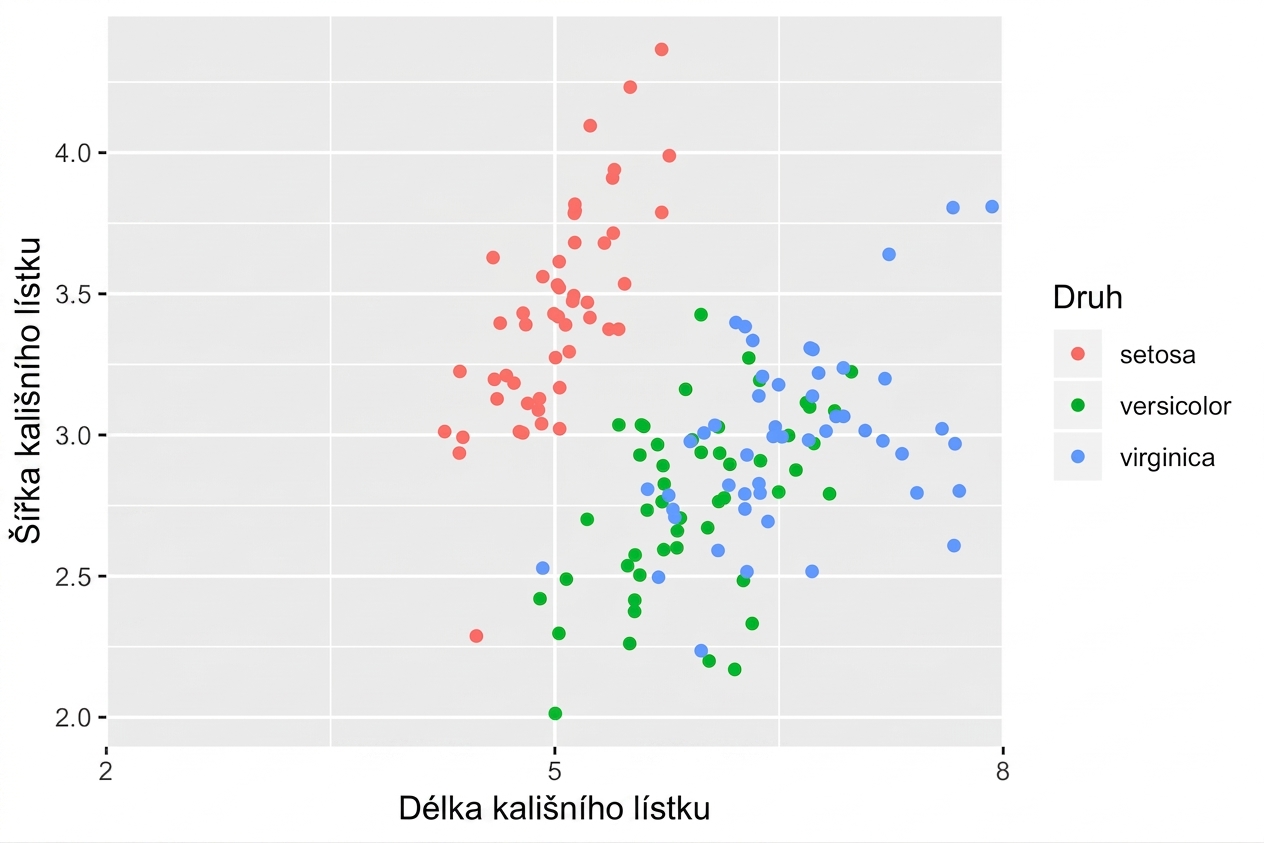
Argument expand

ggplot(iris, aes(x = Sepal.Length, 
                  y = Sepal.Width, 
                 color = Species)) + 
  geom_point(position = "jitter") +
  scale_x_continuous("Sepal Length", 
                     limits = c(2, 8), 
                     breaks = seq(2, 8, 3),
                     expand = c(0, 0)) +
  scale_color_discrete("Species")

Úvod do vizualizace dat s ggplot2

Argument labels

ggplot(iris, aes(x = Sepal.Length, 
                  y = Sepal.Width, 
                 color = Species)) + 
  geom_point(position = "jitter") +
  scale_x_continuous("Sepal Length", 
                     limits = c(2, 8), 
                     breaks = seq(2, 8, 3),
                     expand = c(0, 0), 
                     labels = c("Setosa", 
                               "Versicolor", 
                               "Virginica")) +
  scale_color_discrete("Species")

Úvod do vizualizace dat s ggplot2

labs()

ggplot(iris, aes(x = Sepal.Length, 
                 y = Sepal.Width, 
                 color = Species)) +
  geom_point(position = "jitter") +
  labs(x = "Sepal Length", 
       y = "Sepal Width", 
       color = "Species")

Úvod do vizualizace dat s ggplot2

Pojďme to vyzkoušet!

Úvod do vizualizace dat s ggplot2

Preparing Video For Download...