Úvod do vizualizace dat s ggplot2
Rick Scavetta
Founder, Scavetta Academy
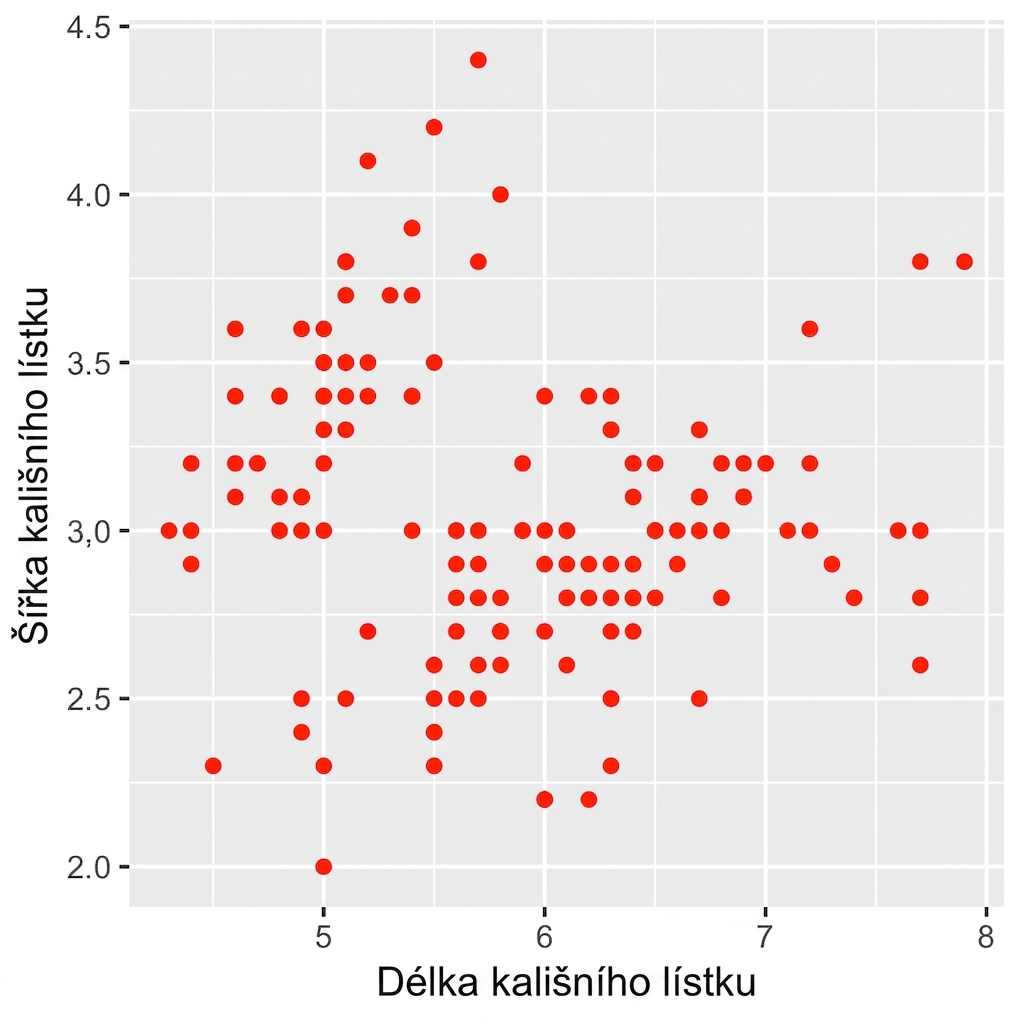
ggplot(iris, aes(x = Sepal.Length,
                 y = Sepal.Width)) +
  geom_point(color = "red")
Atributy se nastavují v geom_*().
geom_*()
Atribut barva je nastaven na "red".
ggplot(iris, aes(x = Sepal.Length,
                 y = Sepal.Width)) +
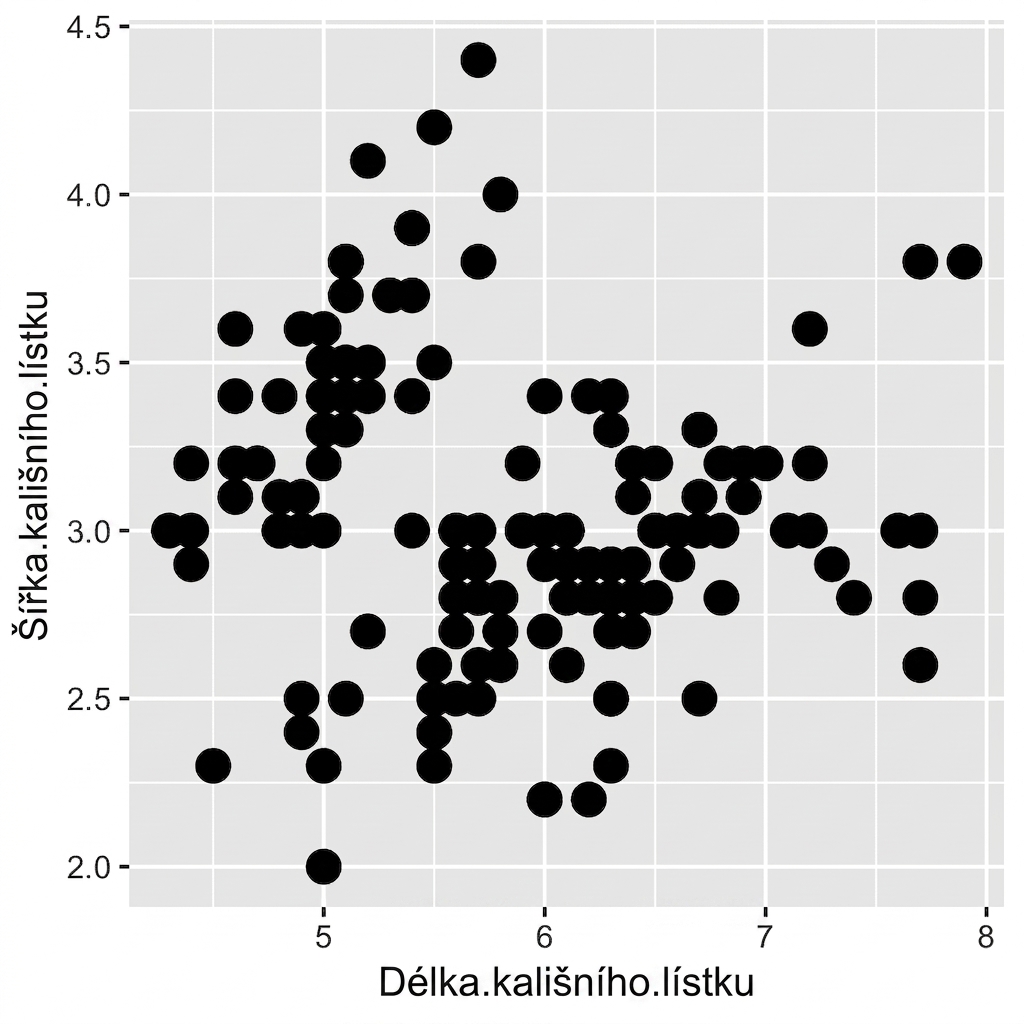
  geom_point(size = 10)
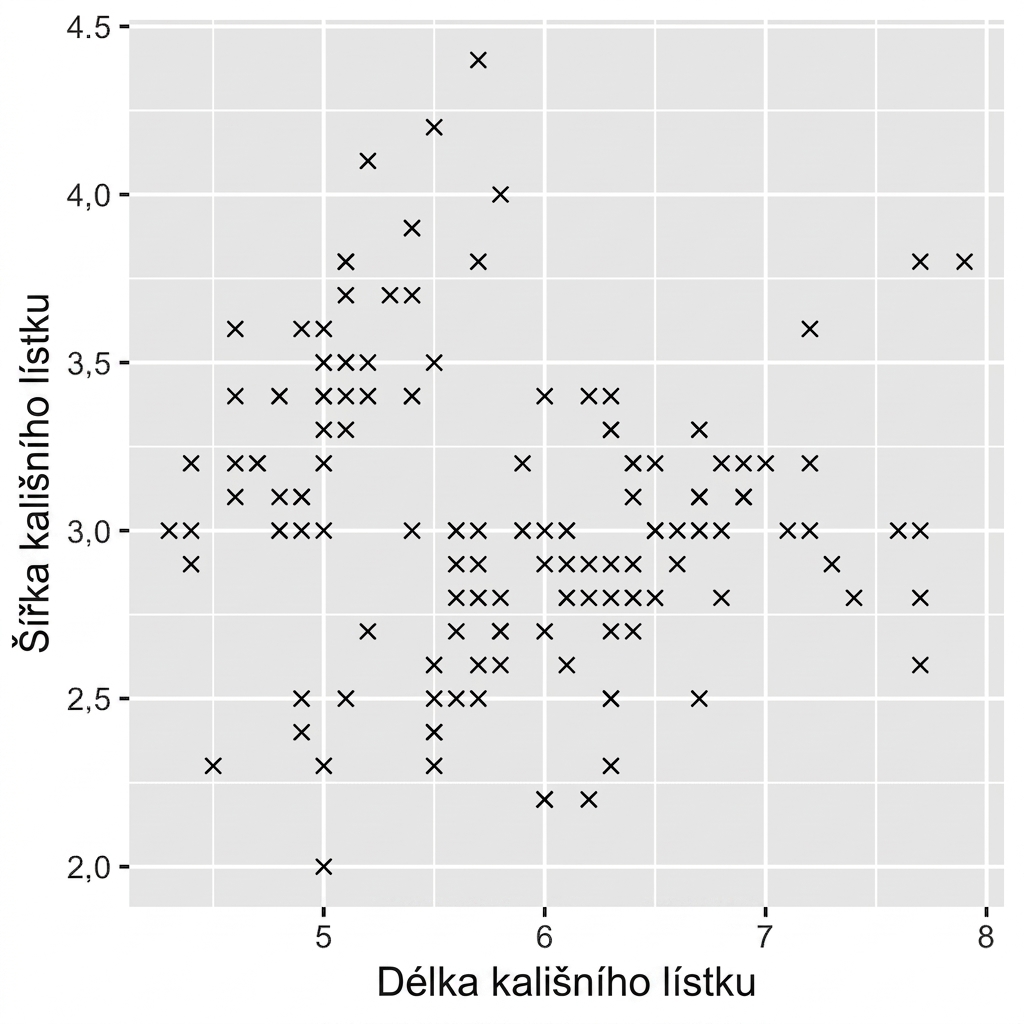
ggplot(iris, aes(x = Sepal.Length,
                 y = Sepal.Width)) +
  geom_point(shape = 4)