Query Profile, History, and Insights

Data Pipeline Automation in Snowflake

Emily Melhuish

Technical Curriculum Developer, Snowflake

Why Query Profile

operations_dashboard

  • Snowflake might be scanning data it shouldn't touch at all
Data Pipeline Automation in Snowflake

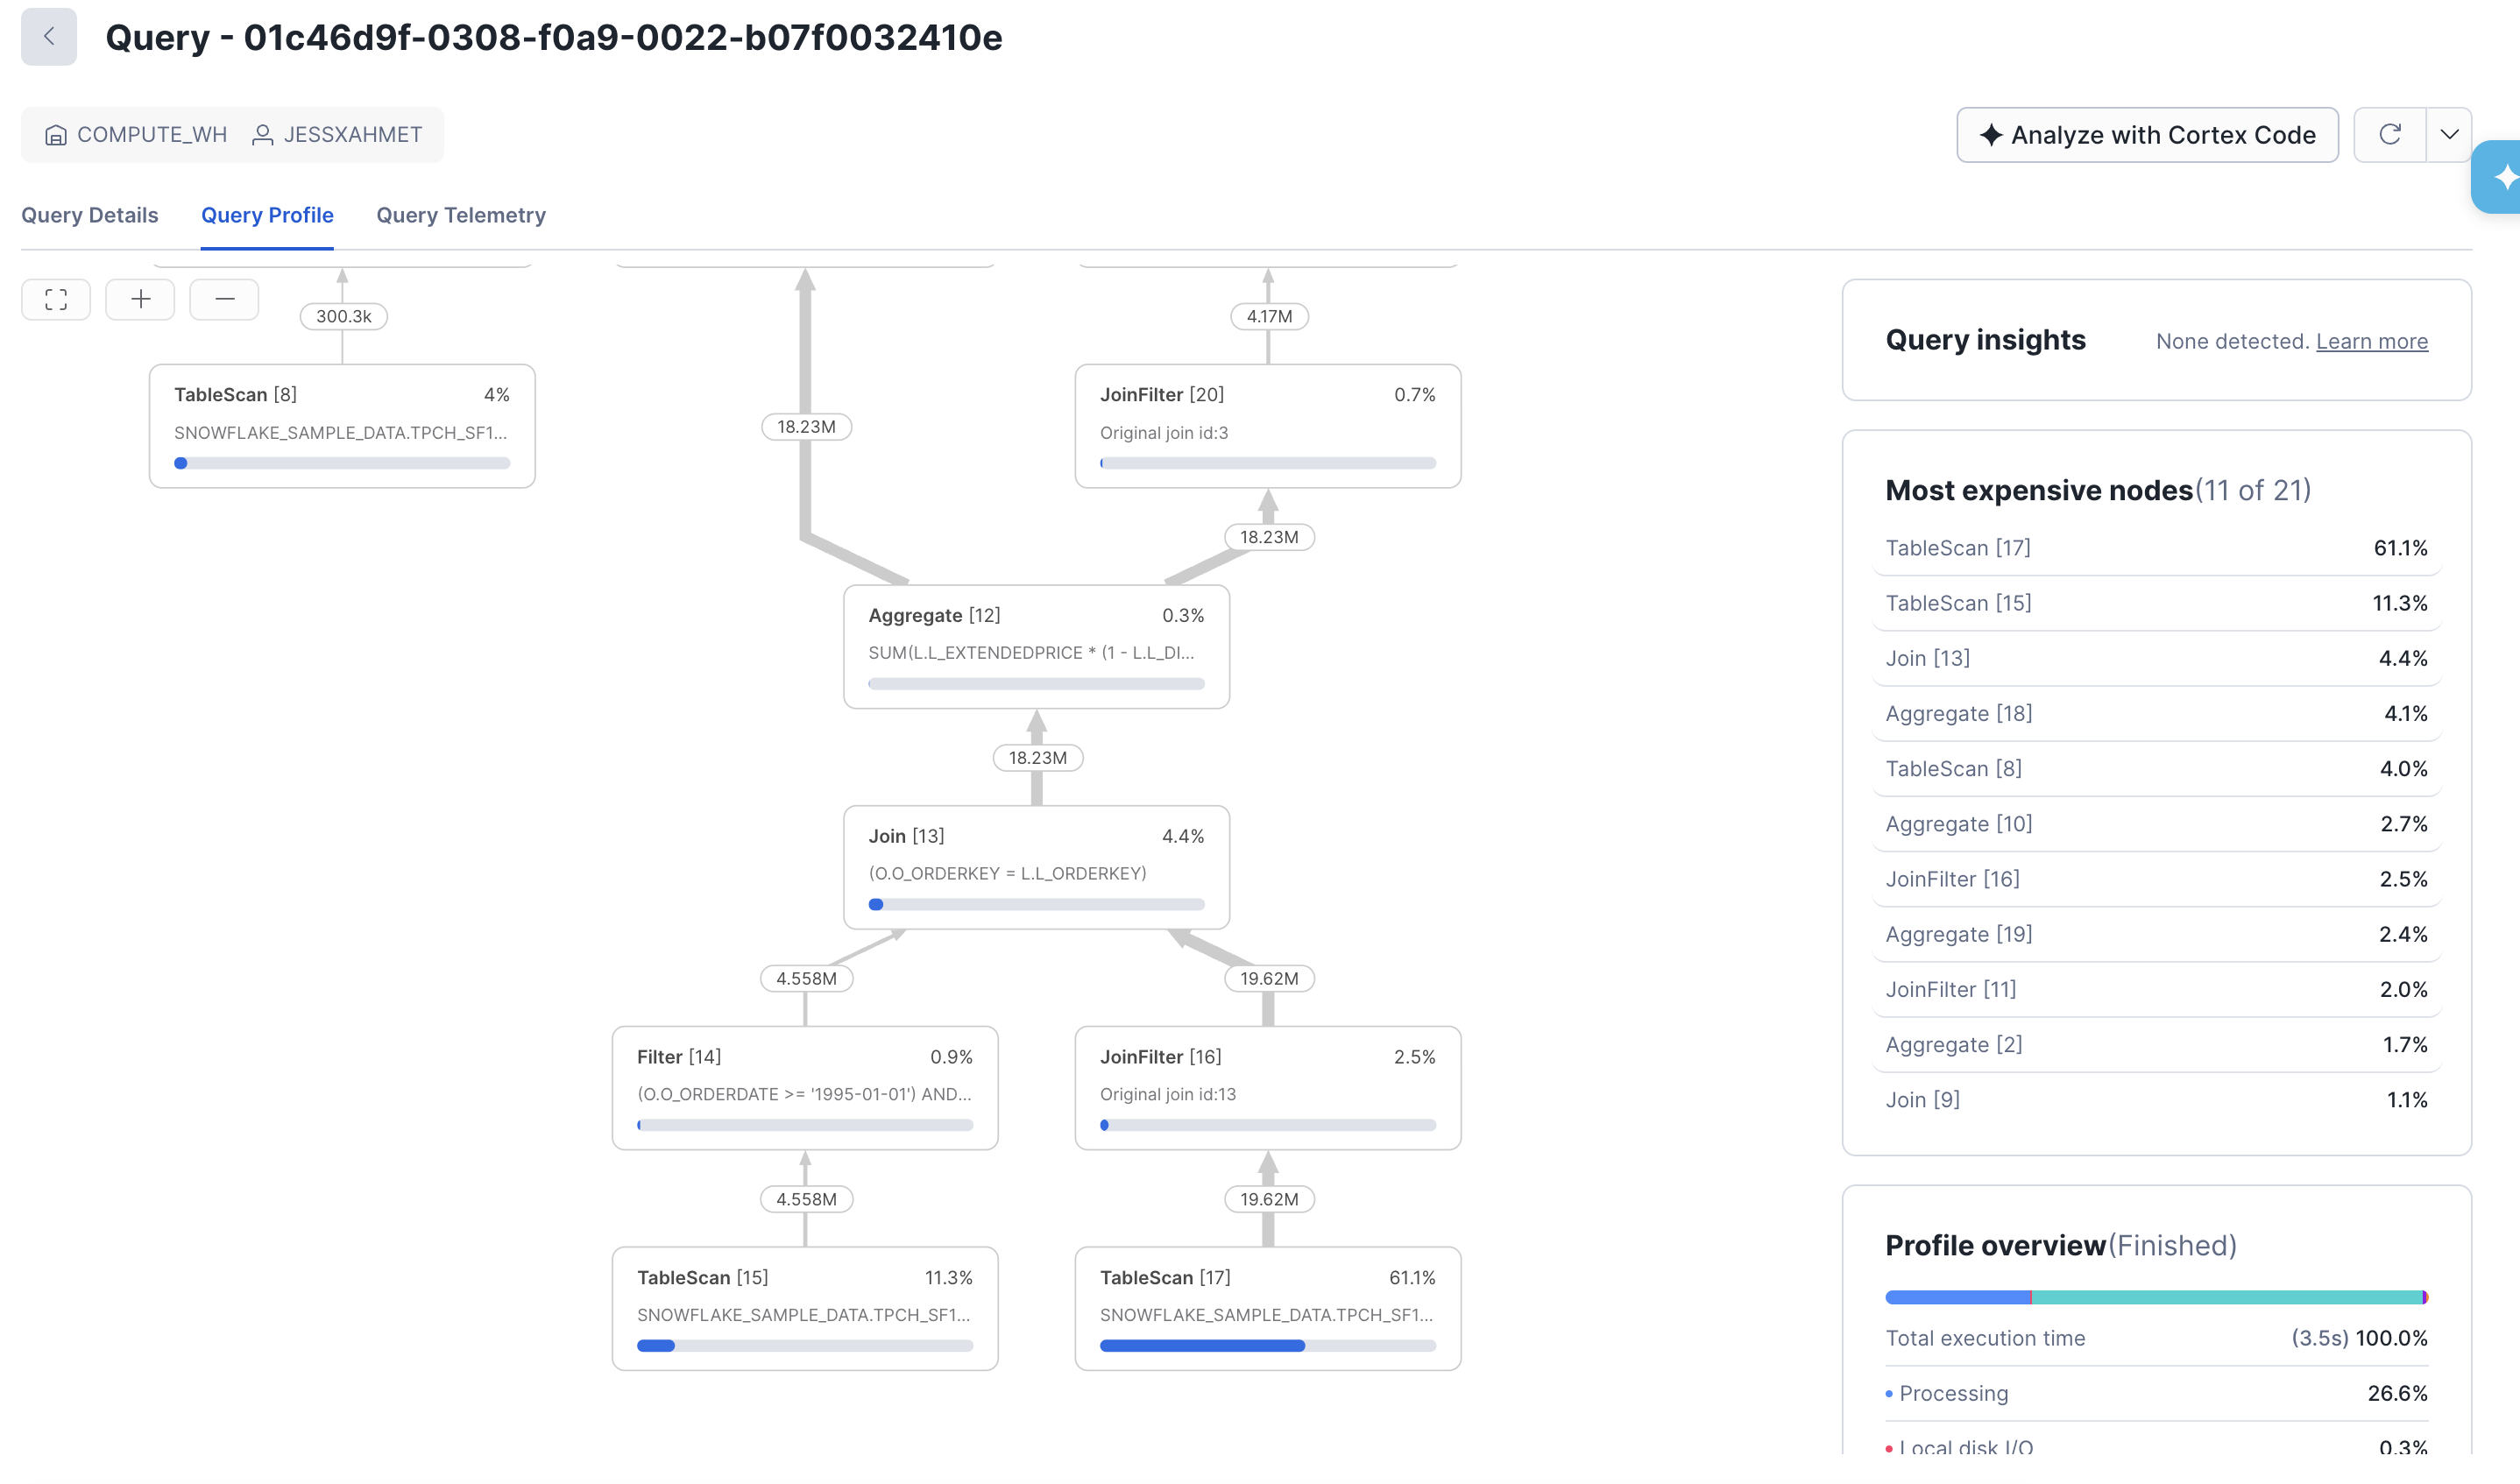
Opening the Query Profile in Snowsight

How to access query profile

Access via: Monitoring > Query History > [Select Query] > Query Profile Tab

Data Pipeline Automation in Snowflake

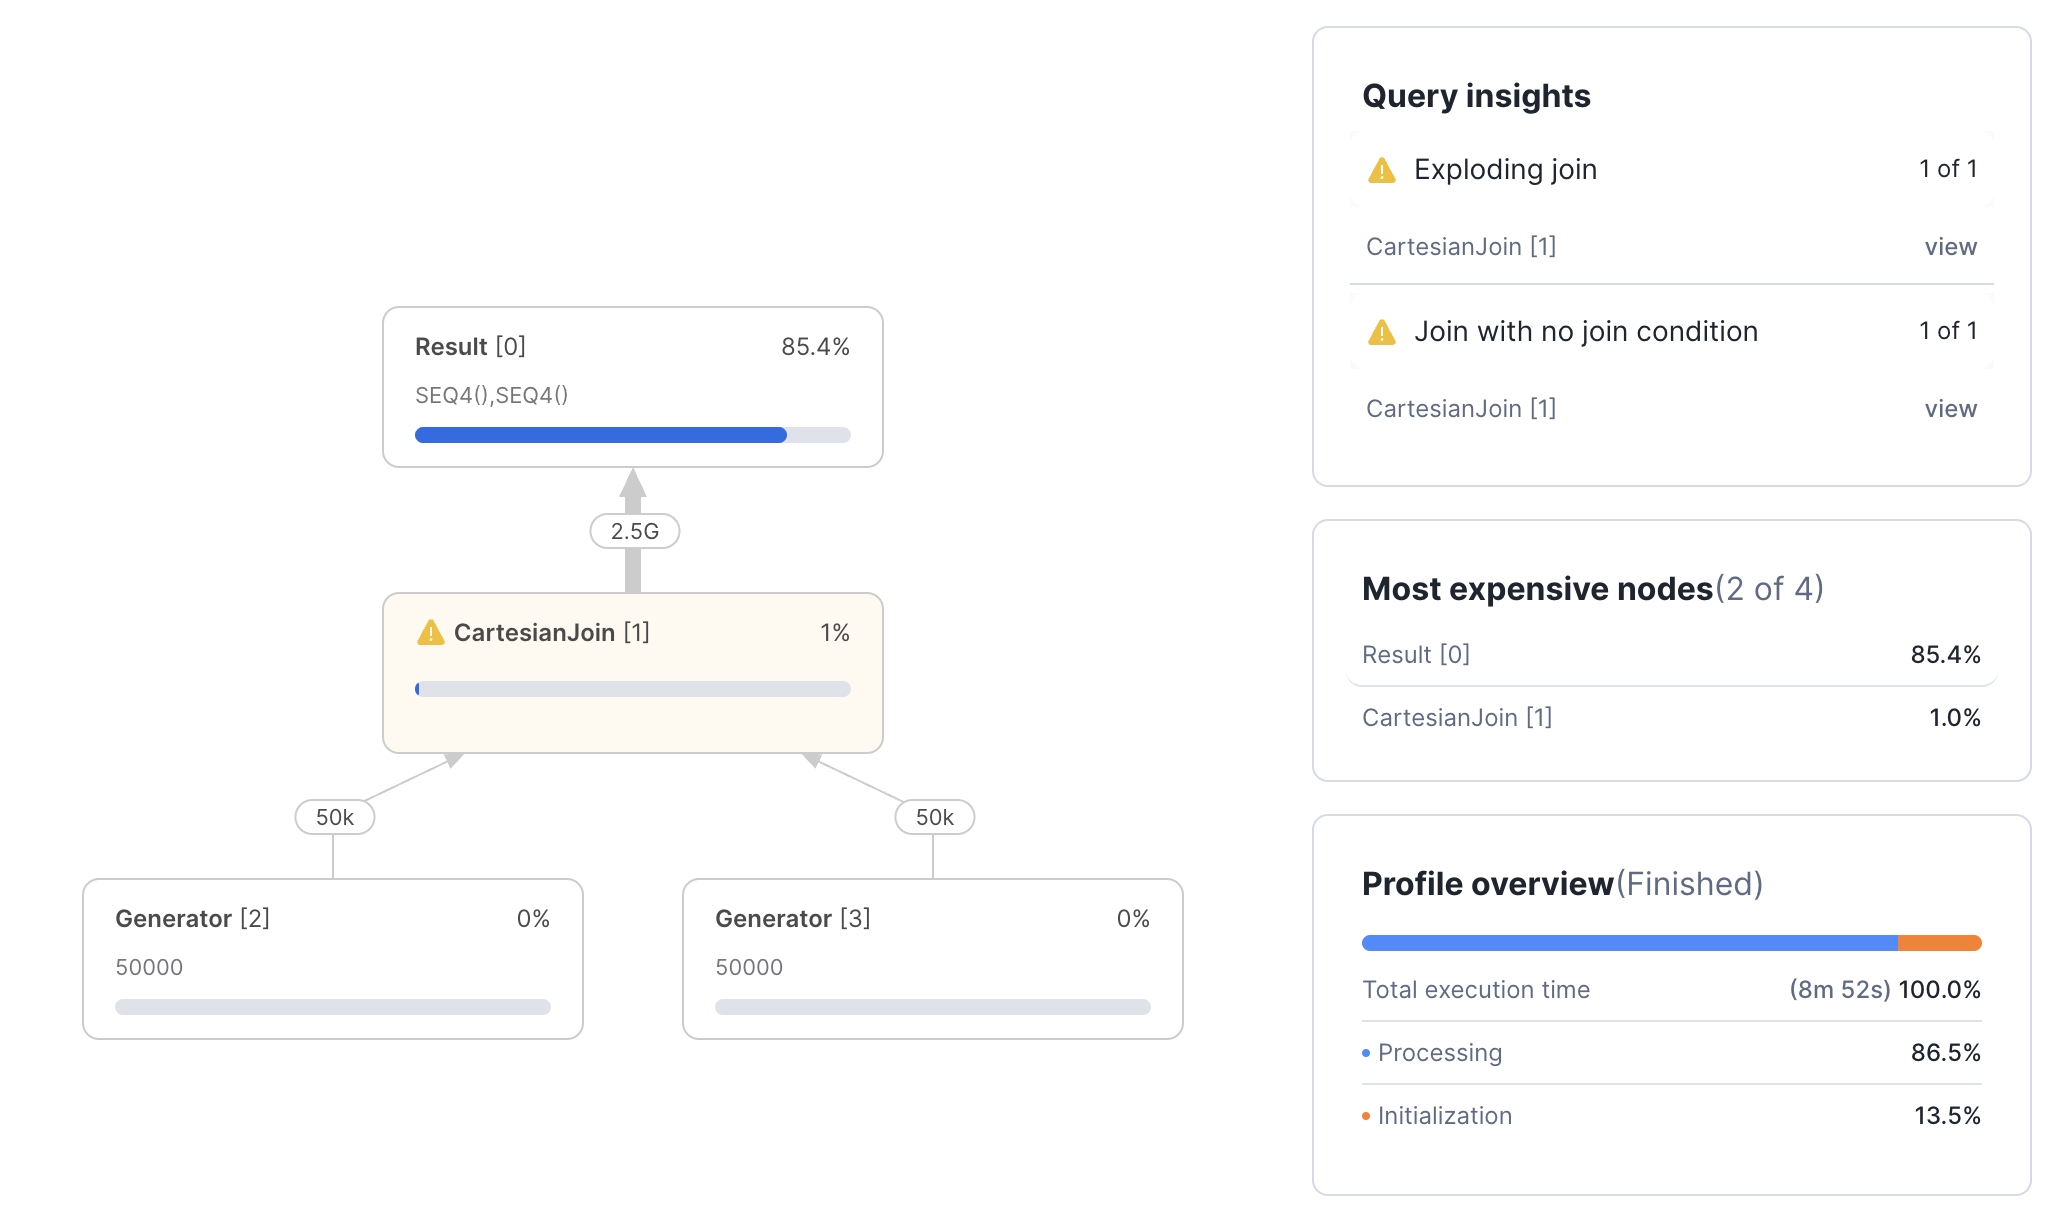
Reading the Operator Tree

Snowsight Query Profile showing operator graph with Most Expensive Nodes panel

Data Pipeline Automation in Snowflake

Four Common Problems Query Profile reveals

Exploding Joins

  • Produces more rows than it can consume

Union without All

  • Adds an Aggregate above your UNION to remove duplicates
  • Cost = added time

Spill to Disk

  • Memory-intensive operators run out of memory
  • Operators such as Aggregates, Sorts or large Joins.

Inefficient Pruning

  • Visible when partitions scanned close to partition total
  • Filters aren't working effectively
Data Pipeline Automation in Snowflake

Spill to Disk: Local vs Remote

  • Local spill → warehouse SSD - slower than memory, but manageable
  • Remote spill → cloud storage - much slower; must be addressed

Diagnostic Query

SELECT 
query_id,
bytes_spilled_to_local_storage,
bytes_spilled_to_remote_storage
FROM SNOWFLAKE.ACCOUNT_USAGE.QUERY_HISTORY
WHERE bytes_spilled_to_remote_storage > 0
ORDER BY bytes_spilled_to_remote_storage DESC
LIMIT 10;
Data Pipeline Automation in Snowflake

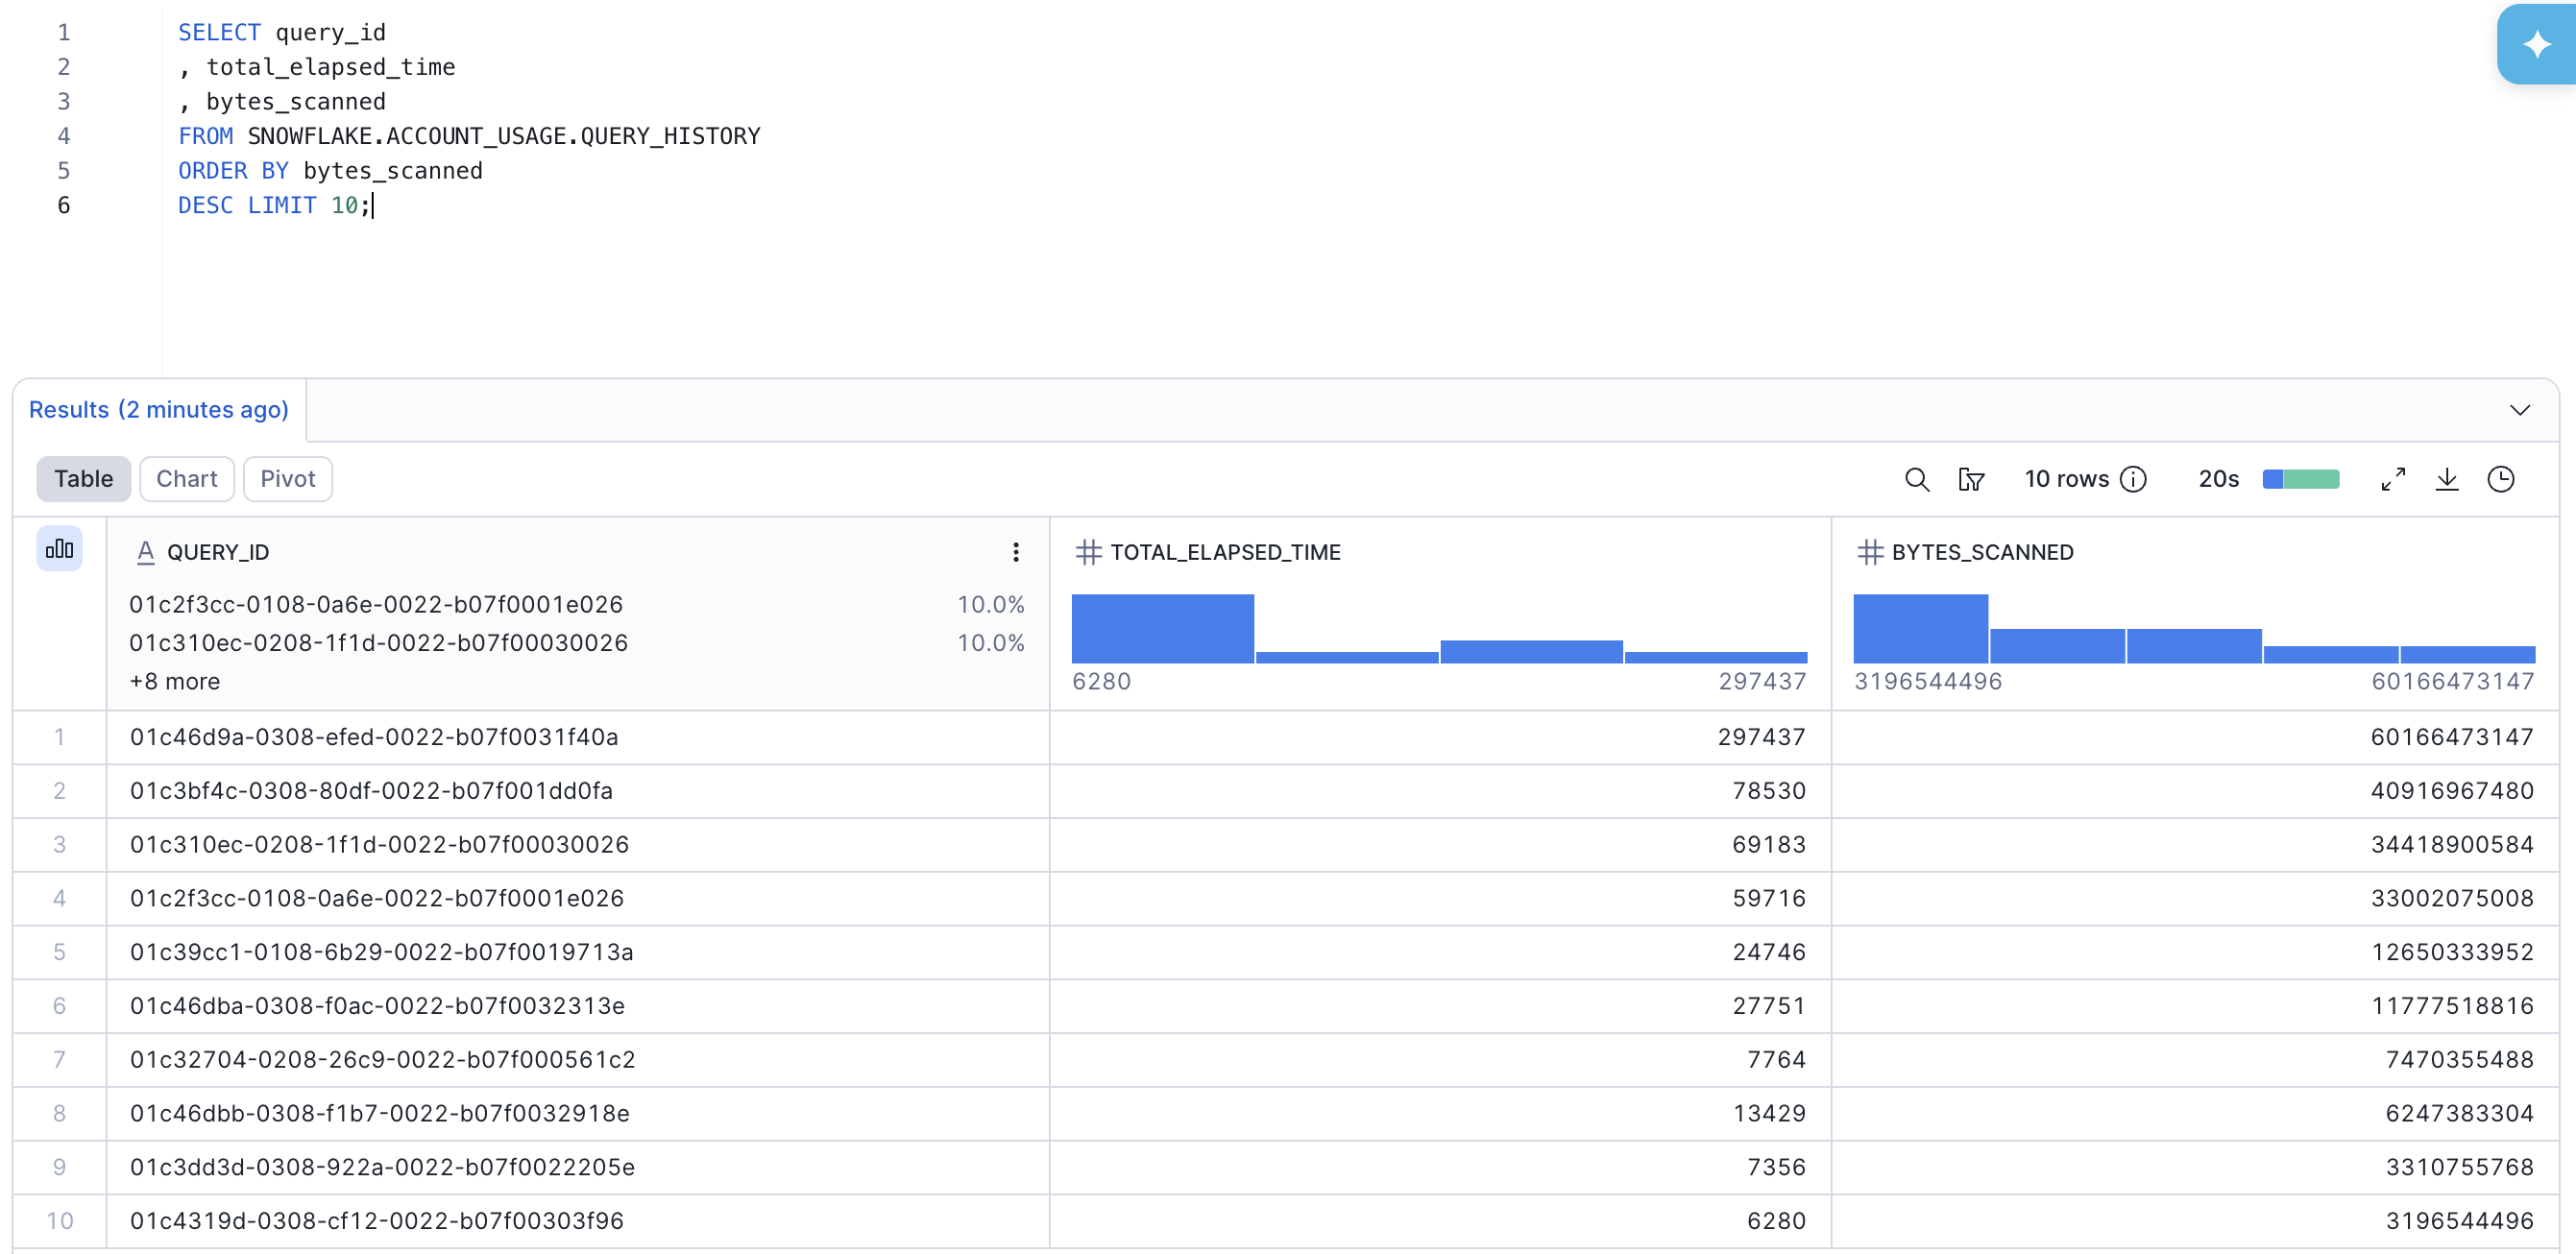
QUERY_HISTORY: Account-wide Visibility

  • ACCOUNT_USAGE.QUERY_HISTORY - view with 365 day retention
  • INFORMATION_SCHEMA.QUERY_HISTORY() table function with 7 day retention

Screenshot of query history being ran

Data Pipeline Automation in Snowflake

Query Insights: Automated Recommendations

query insights recommendation

Data Pipeline Automation in Snowflake

Let's practice!

Data Pipeline Automation in Snowflake

Preparing Video For Download...