Kvantitativní srovnání: sloupcové grafy

Introduction to Data Visualization with Matplotlib

Ariel Rokem

Data Scientist

Olympijské medaile

,Gold, Silver, Bronze
United States, 137, 52, 67
Germany, 47, 43, 67
Great Britain, 64, 55, 26
Russia, 50, 28, 35
China, 44, 30, 35
France, 20, 55, 21
Australia, 23, 34, 25
Italy, 8, 38, 24
Canada, 4, 4, 61
Japan, 17, 13, 34
Introduction to Data Visualization with Matplotlib

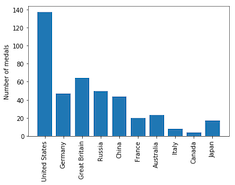
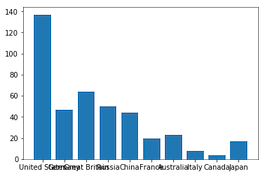
Olympijské medaile: vizualizace dat

medals = pd.read_csv('medals_by_country_2016.csv', index_col=0)

fig, ax = plt.subplots()
ax.bar(medals.index, medals["Gold"]) plt.show()
Introduction to Data Visualization with Matplotlib

Rotace popisků osy

fig, ax = plt.subplots()
ax.bar(medals.index, medals["Gold"])

ax.set_xticklabels(medals.index, rotation=90) ax.set_ylabel("Number of medals")
plt.show()
Introduction to Data Visualization with Matplotlib

Olympijské medaile: vizualizace dalších medailí

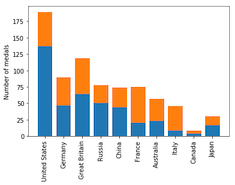
fig, ax = plt.subplots
ax.bar(medals.index, medals["Gold"])

ax.bar(medals.index, medals["Silver"], bottom=medals["Gold"])
ax.set_xticklabels(medals.index, rotation=90) ax.set_ylabel("Number of medals") plt.show()

Introduction to Data Visualization with Matplotlib

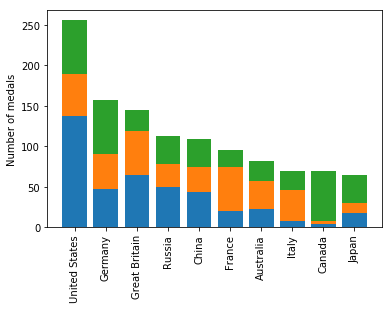
Olympijské medaile: vizualizace všech tří

fig, ax = plt.subplots
ax.bar(medals.index, medals["Gold"])

ax.bar(medals.index, medals["Silver"], bottom=medals["Gold"])

ax.bar(medals.index, medals["Bronze"], bottom=medals["Gold"] + medals["Silver"])
ax.set_xticklabels(medals.index, rotation=90) ax.set_ylabel("Number of medals") plt.show()
Introduction to Data Visualization with Matplotlib

Skládaný sloupcový graf

Introduction to Data Visualization with Matplotlib

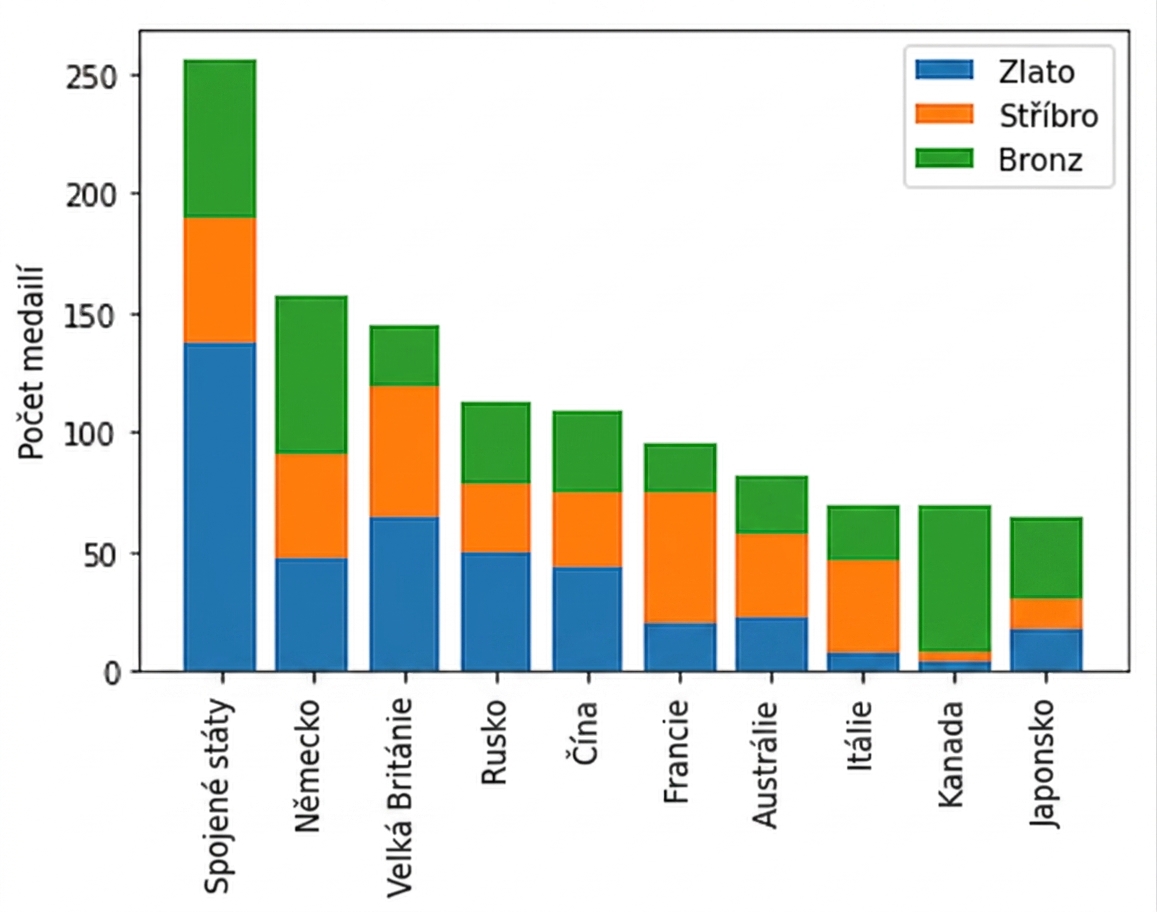
Přidání legendy

fig, ax = plt.subplots
ax.bar(medals.index, medals["Gold"])
ax.bar(medals.index, medals["Silver"], bottom=medals["Gold"])
ax.bar(medals.index, medals["Bronze"],
       bottom=medals["Gold"] + medals["Silver"])

ax.set_xticklabels(medals.index, rotation=90)
ax.set_ylabel("Number of medals")
Introduction to Data Visualization with Matplotlib

Přidání legendy

fig, ax = plt.subplots
ax.bar(medals.index, medals["Gold"], label="Gold")
ax.bar(medals.index, medals["Silver"], bottom=medals["Gold"], 
       label="Silver")
ax.bar(medals.index, medals["Bronze"],
       bottom=medals["Gold"] + medals["Silver"], 
       label="Bronze")

ax.set_xticklabels(medals.index, rotation=90)
ax.set_ylabel("Number of medals")

ax.legend() plt.show()
Introduction to Data Visualization with Matplotlib

Skládaný sloupcový graf s legendou

Introduction to Data Visualization with Matplotlib

Vytvořte sloupcový graf!

Introduction to Data Visualization with Matplotlib

Preparing Video For Download...