Úvod do regrese v R
Richie Cotton
Data Evangelist at DataCamp
library(dplyr)
swedish_motor_insurance %>%
  summarize_all(mean)
# A tibble: 1 x 2
  n_claims total_payment_sek
     <dbl>             <dbl>
1     22.9              98.2
swedish_motor_insurance %>%
  summarize(
    correlation = cor(n_claims, total_payment_sek)
  )
# A tibble: 1 x 1
  correlation
        <dbl>
1       0.881
Proměnná, kterou chcete předpovědět.
Proměnné, které vysvětlují změny závislé proměnné.
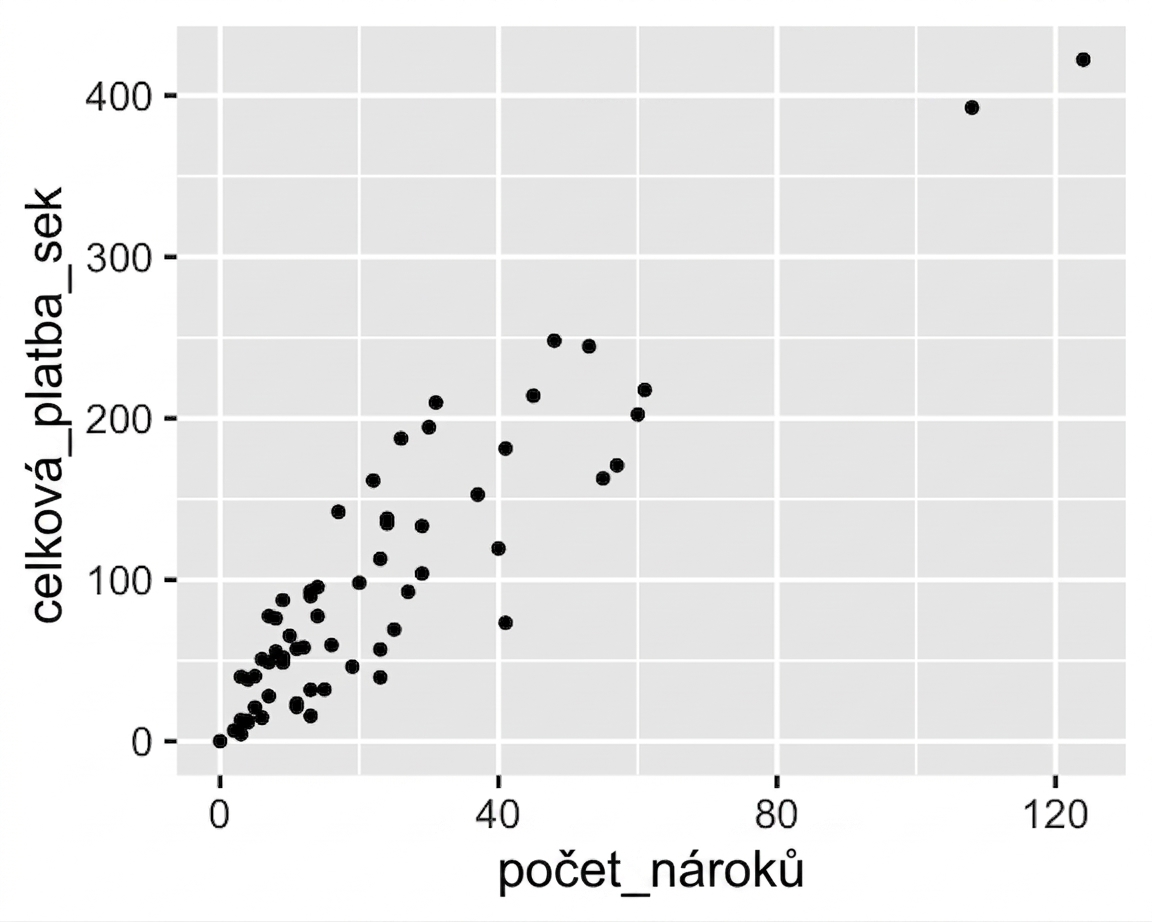
library(ggplot2)

ggplot(
  swedish_motor_insurance,
  aes(n_claims, total_payment_sek)
) +
  geom_point()
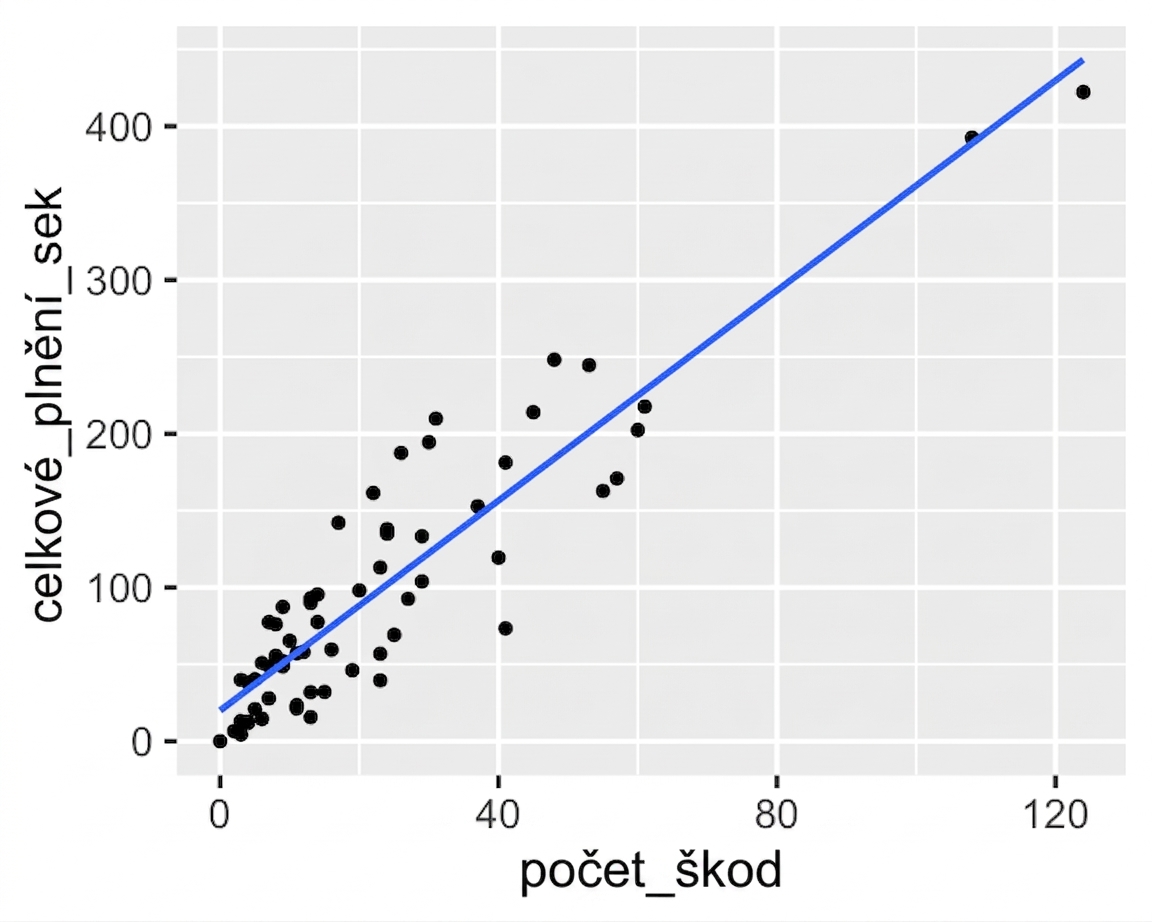
library(ggplot2)

ggplot(
  swedish_motor_insurance,
  aes(n_claims, total_payment_sek)
) +
  geom_point() +
  geom_smooth(
    method = "lm",
    se = FALSE
  )
Vizualizace a sestavení modelů lineární regrese.
Předpovědi z modelů lineární regrese a interpretace koeficientů.
Hodnocení kvality modelu lineární regrese.
Totéž, ale s modely logistické regrese.