Distributed tracing with AWS X-Ray and structured logging

Deploying Applications on AWS

Dunieski Otano

Amazon Web Services Solutions Architect

The slow request nobody could find

  • One request takes four seconds
  • Each service's logs look fine alone
  • No one can see the whole path

A magnifying glass tracing one slow request across a distributed service map with a red bottleneck node

Deploying Applications on AWS

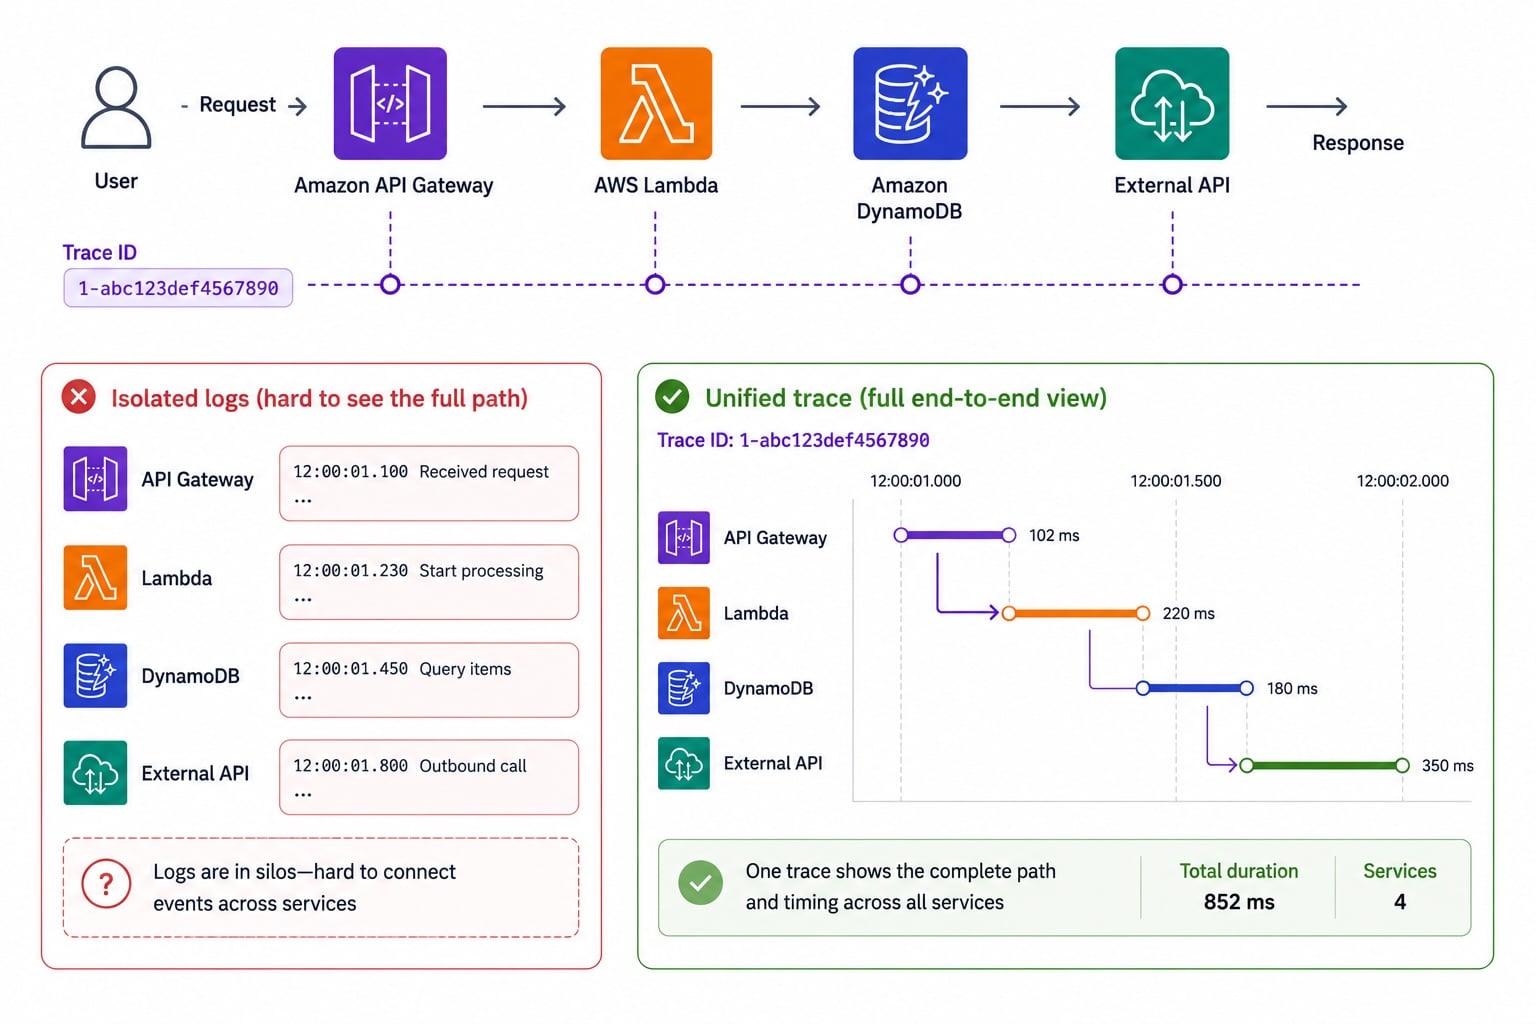
What distributed tracing solves

Isolated per-service log silos in red on the left versus a unified X-Ray Gantt trace timeline stitching the same request across API Gateway, Lambda, DynamoDB, and external API in green

  • One request touches many services
  • Logs alone can't show the end-to-end path
  • A trace stitches the whole request together
  • See exactly where the time went
Deploying Applications on AWS

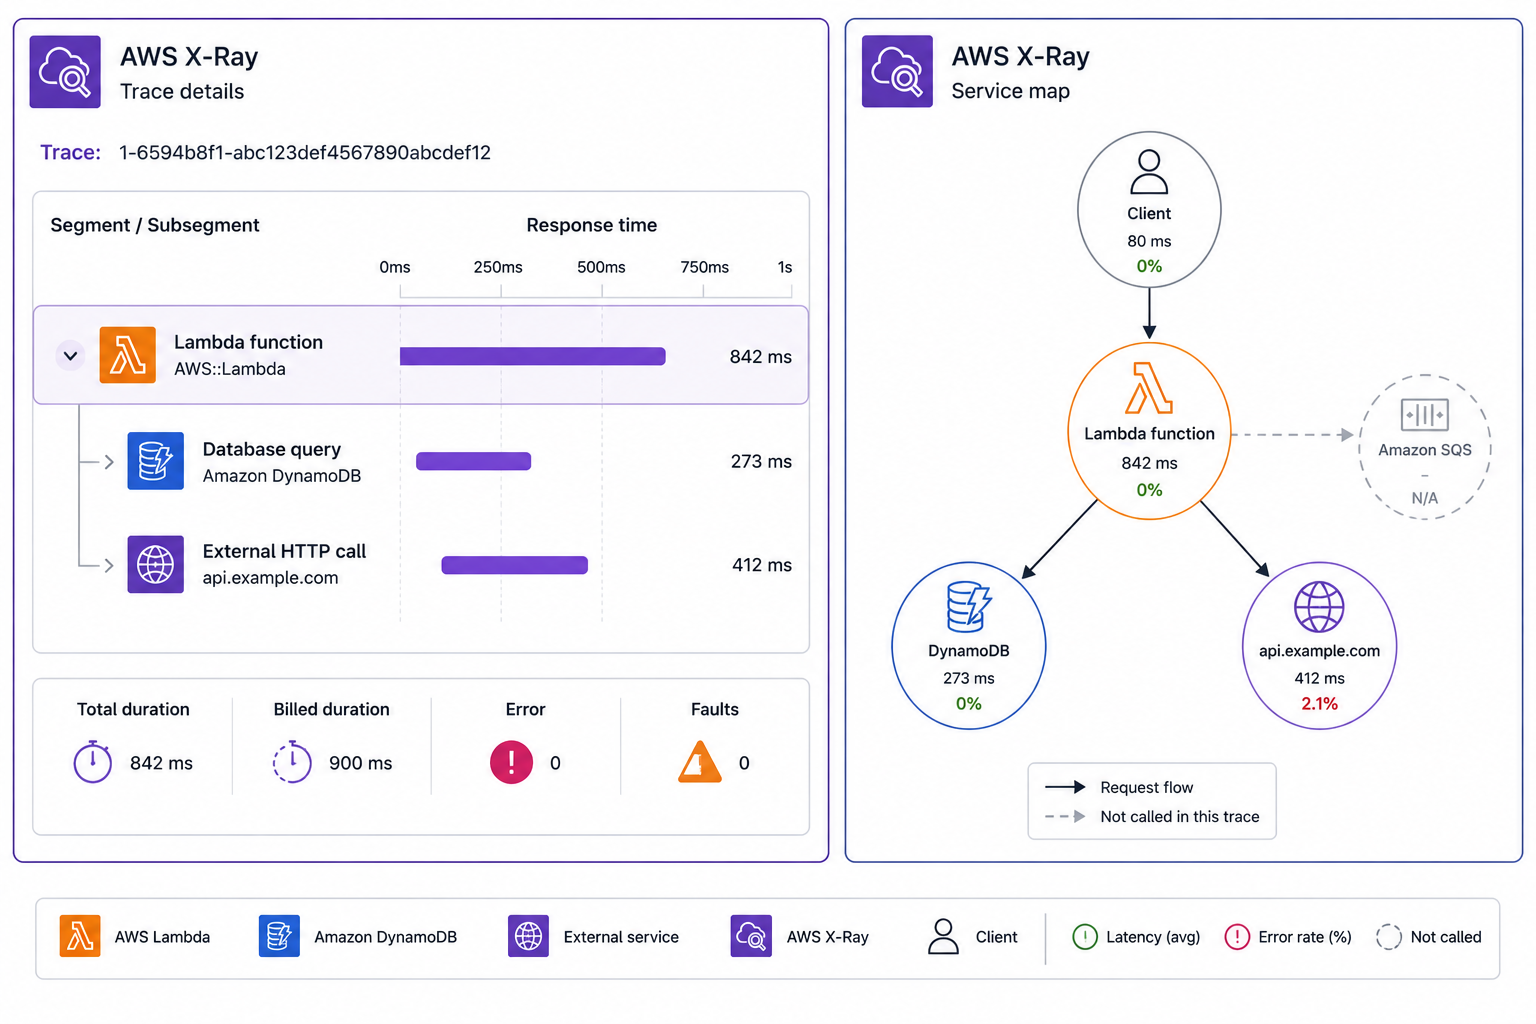
Segments, subsegments, and the service map

  • Segment: the work done by one service
  • Subsegment: a unit inside a segment, like a DB call
  • Service map: a visual graph of all segments
  • Latency and errors show on each node

X-Ray trace anatomy: segment per service with subsegments for DB calls, assembled into a service map graph showing latency and error rate on each node

Deploying Applications on AWS

Annotations vs metadata


Annotations

  • Indexed key-values, so they are filterable
  • Use for things you'll search by, like customer tier

Metadata

  • Extra detail, not indexed
  • Attach it for context, but you can't search by it
Deploying Applications on AWS

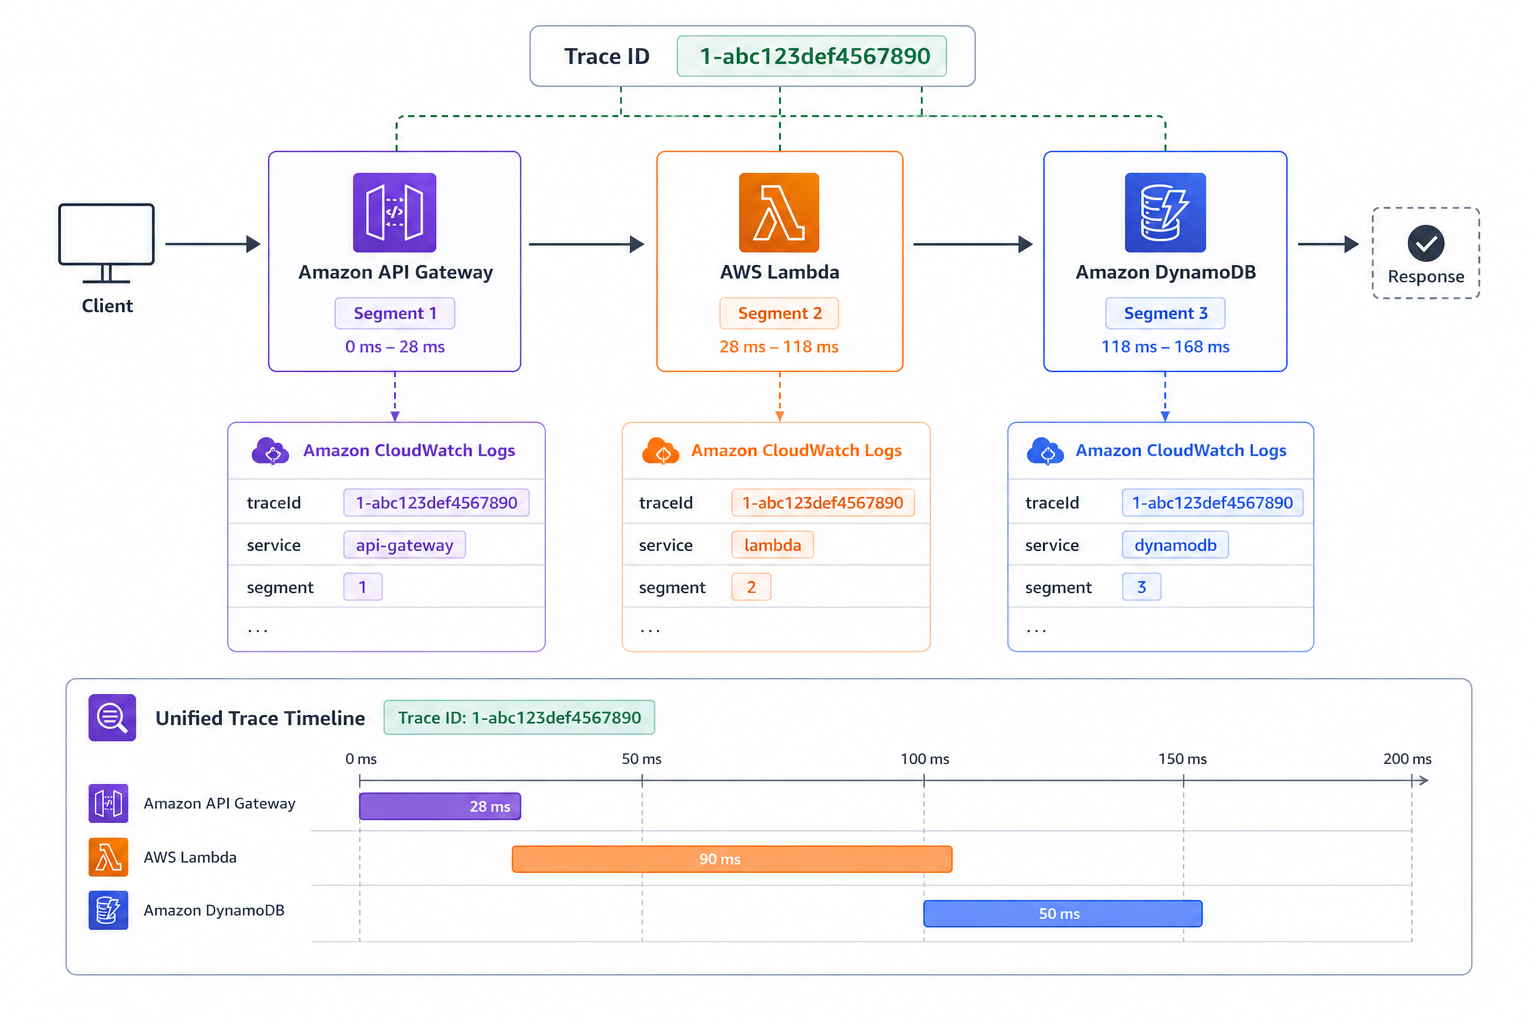
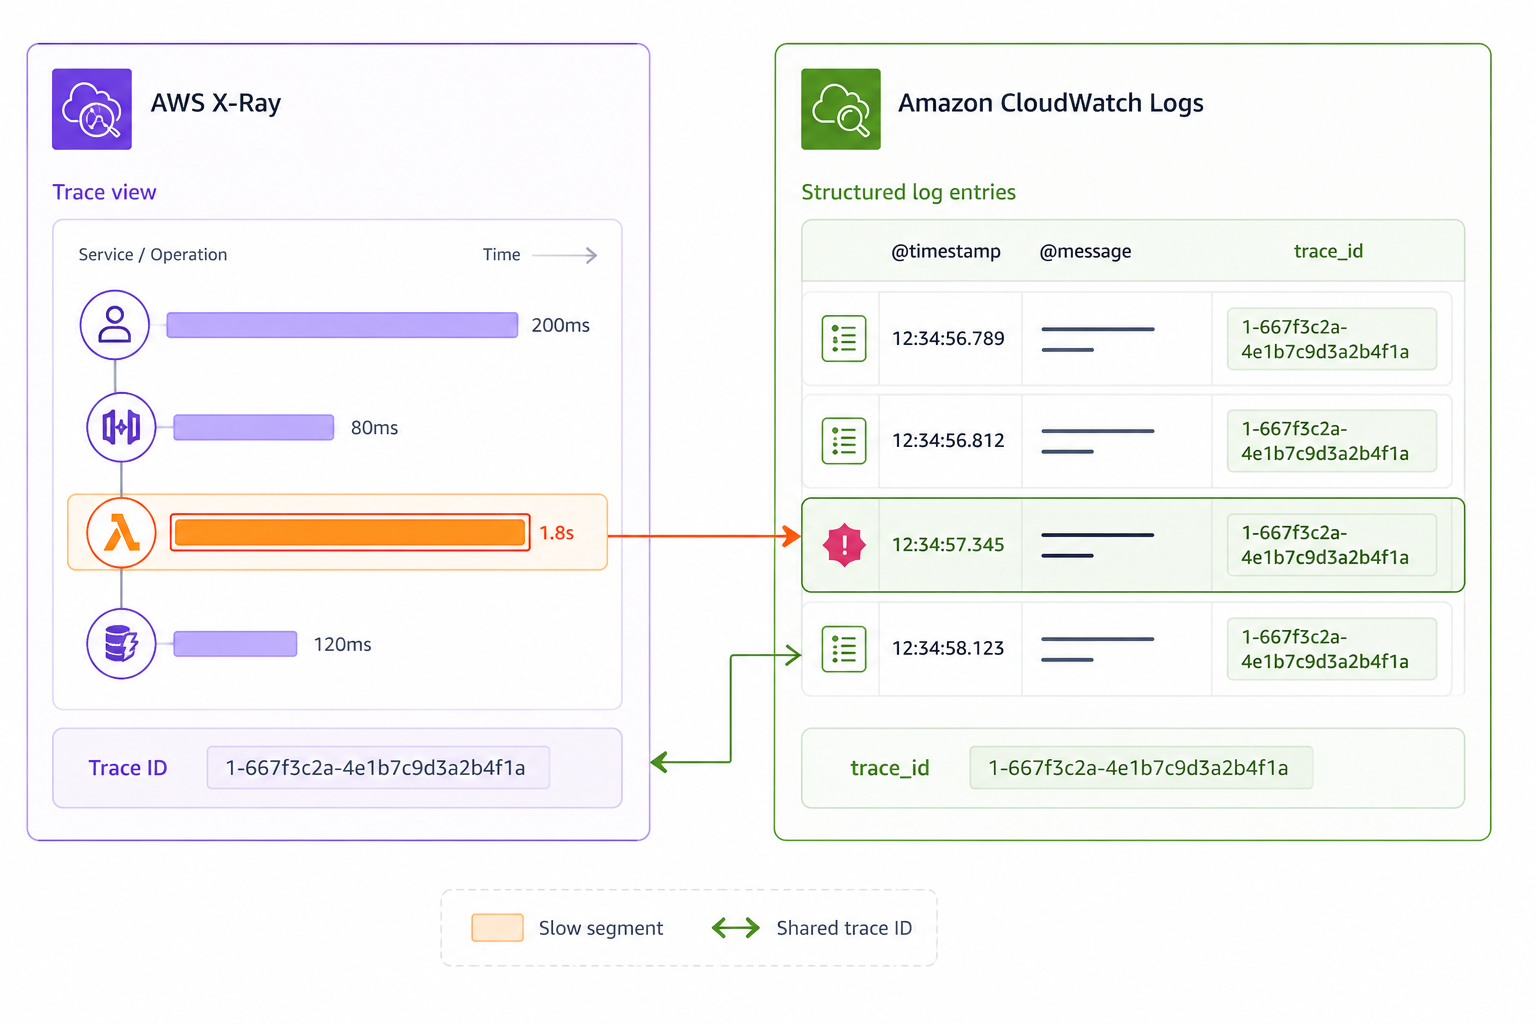
Correlating logs with trace IDs

  • Each trace has a unique trace ID
  • Include the trace ID in your structured logs
  • Jump from a slow trace to its exact log lines
  • Logs and traces become one investigation

Structured log line with xray_trace_id field highlighted, arrow pointing from X-Ray trace view to matching log lines in CloudWatch Logs for correlated investigation

Deploying Applications on AWS

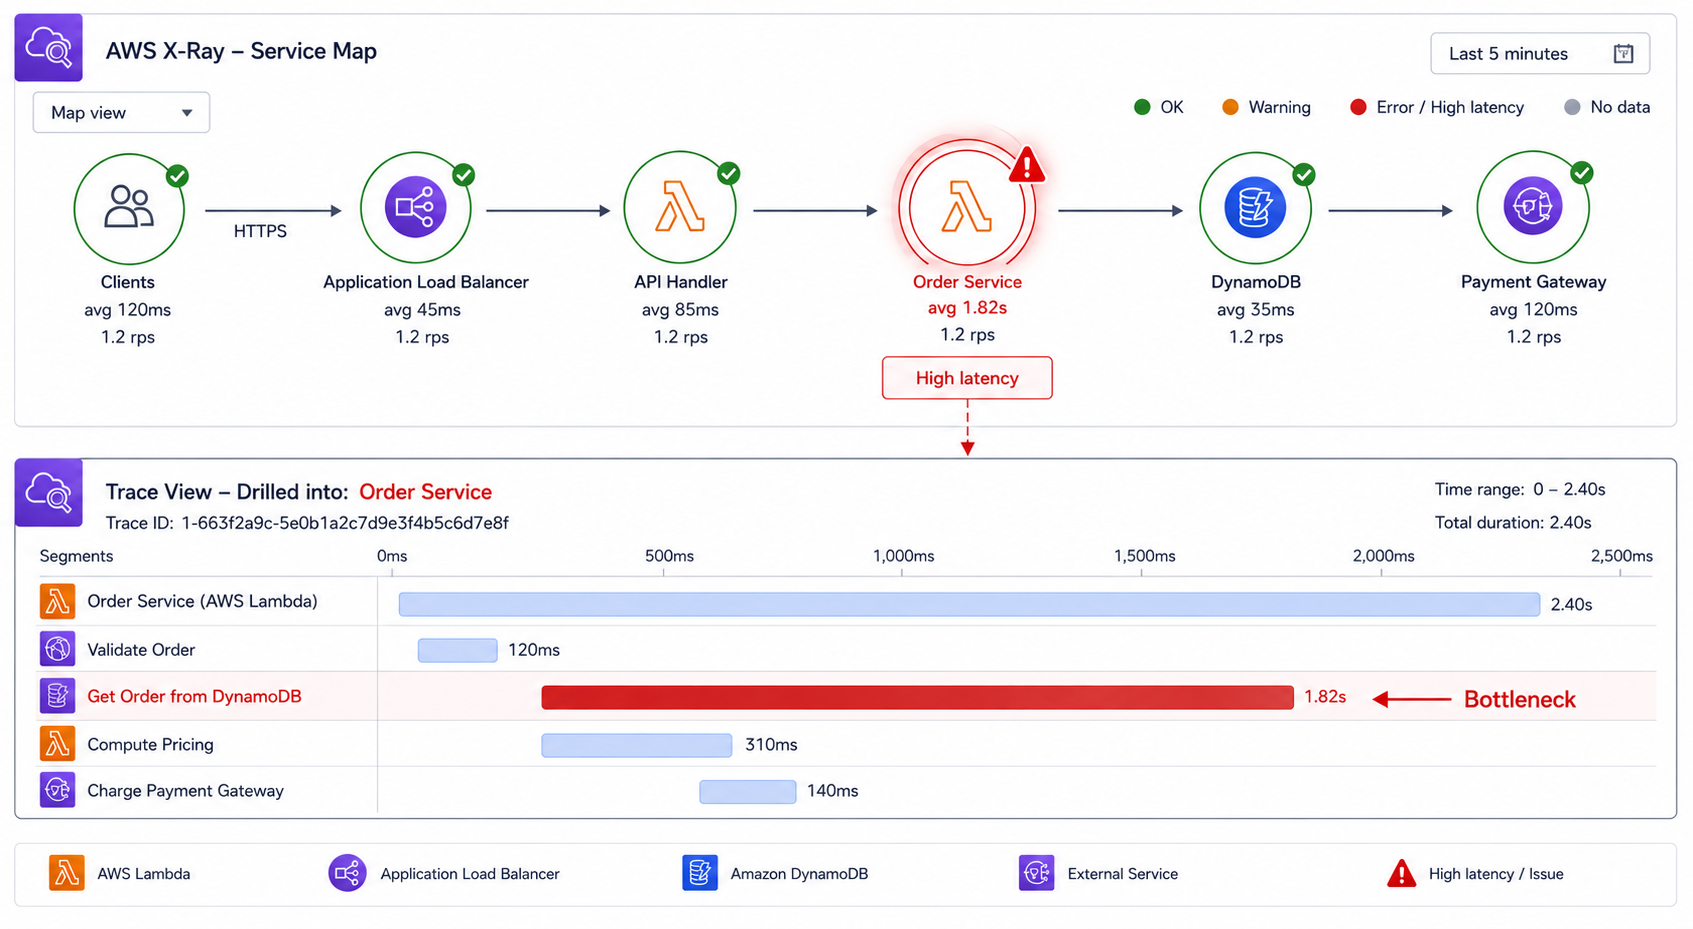
Reading the service map to find the bottleneck

X-Ray service map with a high-latency node highlighted, drill-down into trace timeline showing the longest segment bar identified as the bottleneck

  • Start at the service map, not the logs
  • Find the node with the highest latency
  • Drill into its trace timeline
  • The longest segment is your suspect
Deploying Applications on AWS

Tracing across the full request

  • API Gateway, Lambda, and downstream calls all traced
  • Each adds its segment to the same trace
  • One trace ID ties logs and segments together
  • End-to-end visibility for every request

End-to-end distributed trace from API Gateway through Lambda to DynamoDB and external API, one trace ID visible in each segment header tying all logs and segments together

Deploying Applications on AWS

Let's practice!

Deploying Applications on AWS

Preparing Video For Download...