Logging and metrics with Amazon CloudWatch

Deploying Applications on AWS

Dunieski Otano

Amazon Web Services Solutions Architect

Is it down?

  • A customer says the app is broken
  • You have no data to confirm or deny
  • CloudWatch turns guesses into answers

A monitoring dashboard with a question mark, unsure whether the service is healthy or down

Deploying Applications on AWS

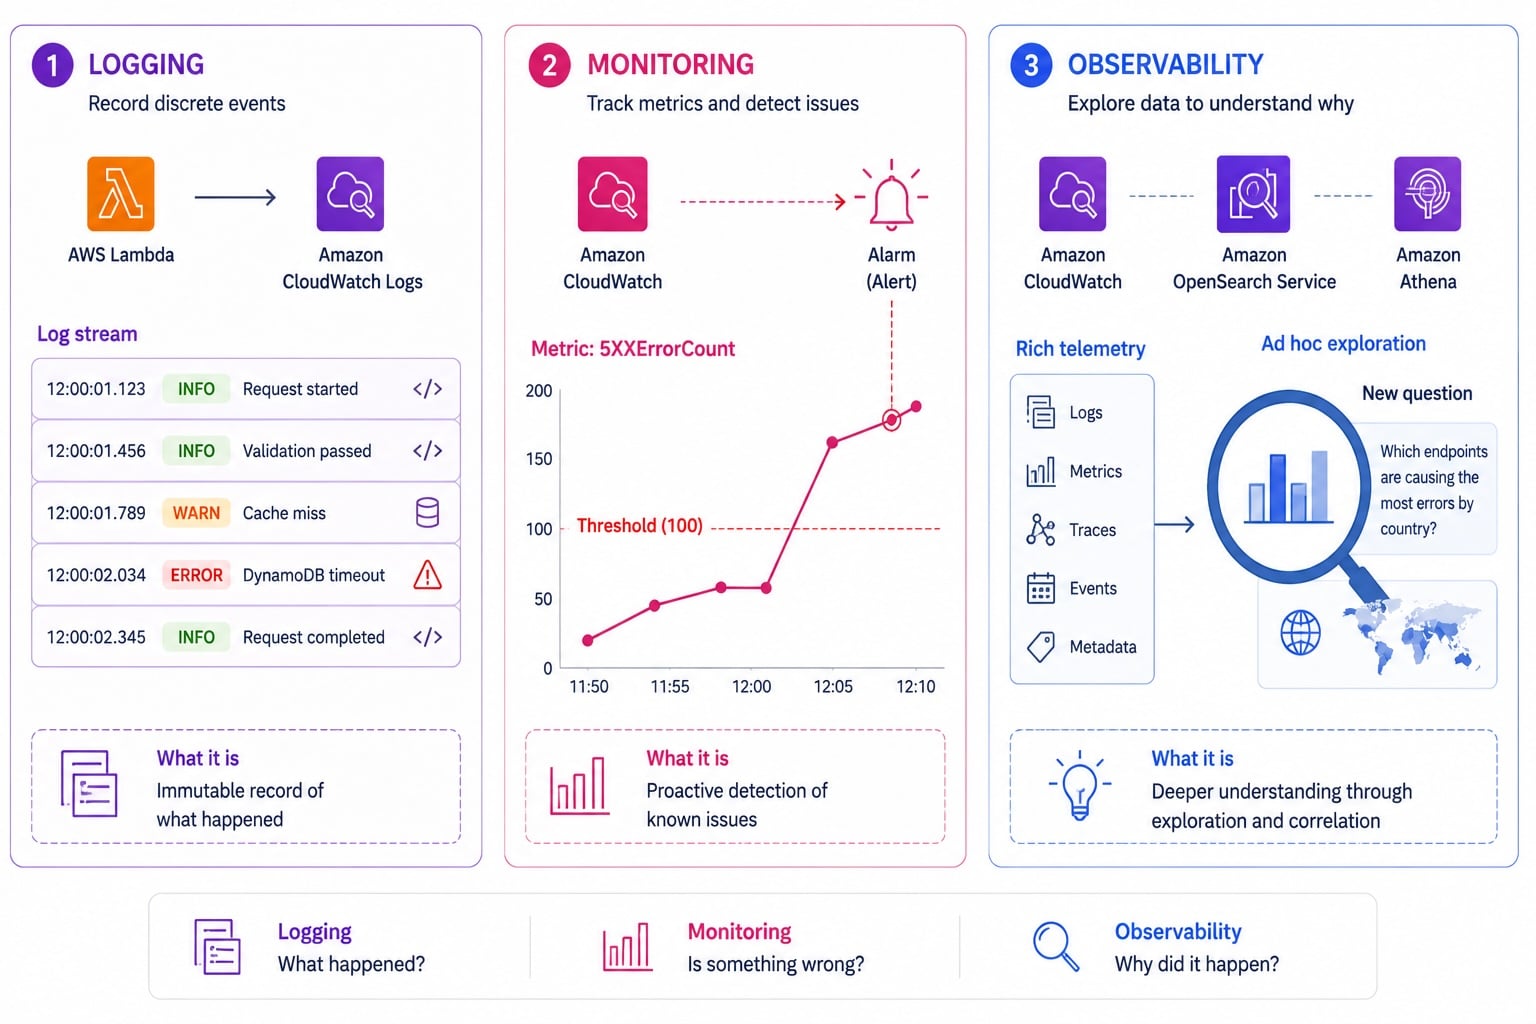
Logging vs monitoring vs observability

Three-column diagram distinguishing logging as immutable event records, monitoring as metric thresholds with alarms, and observability as correlating data to answer new questions

  • Logging: record discrete events as they happen
  • Monitoring: track known metrics against thresholds
  • Observability: ask new questions of your data
  • You need all three to operate confidently
Deploying Applications on AWS

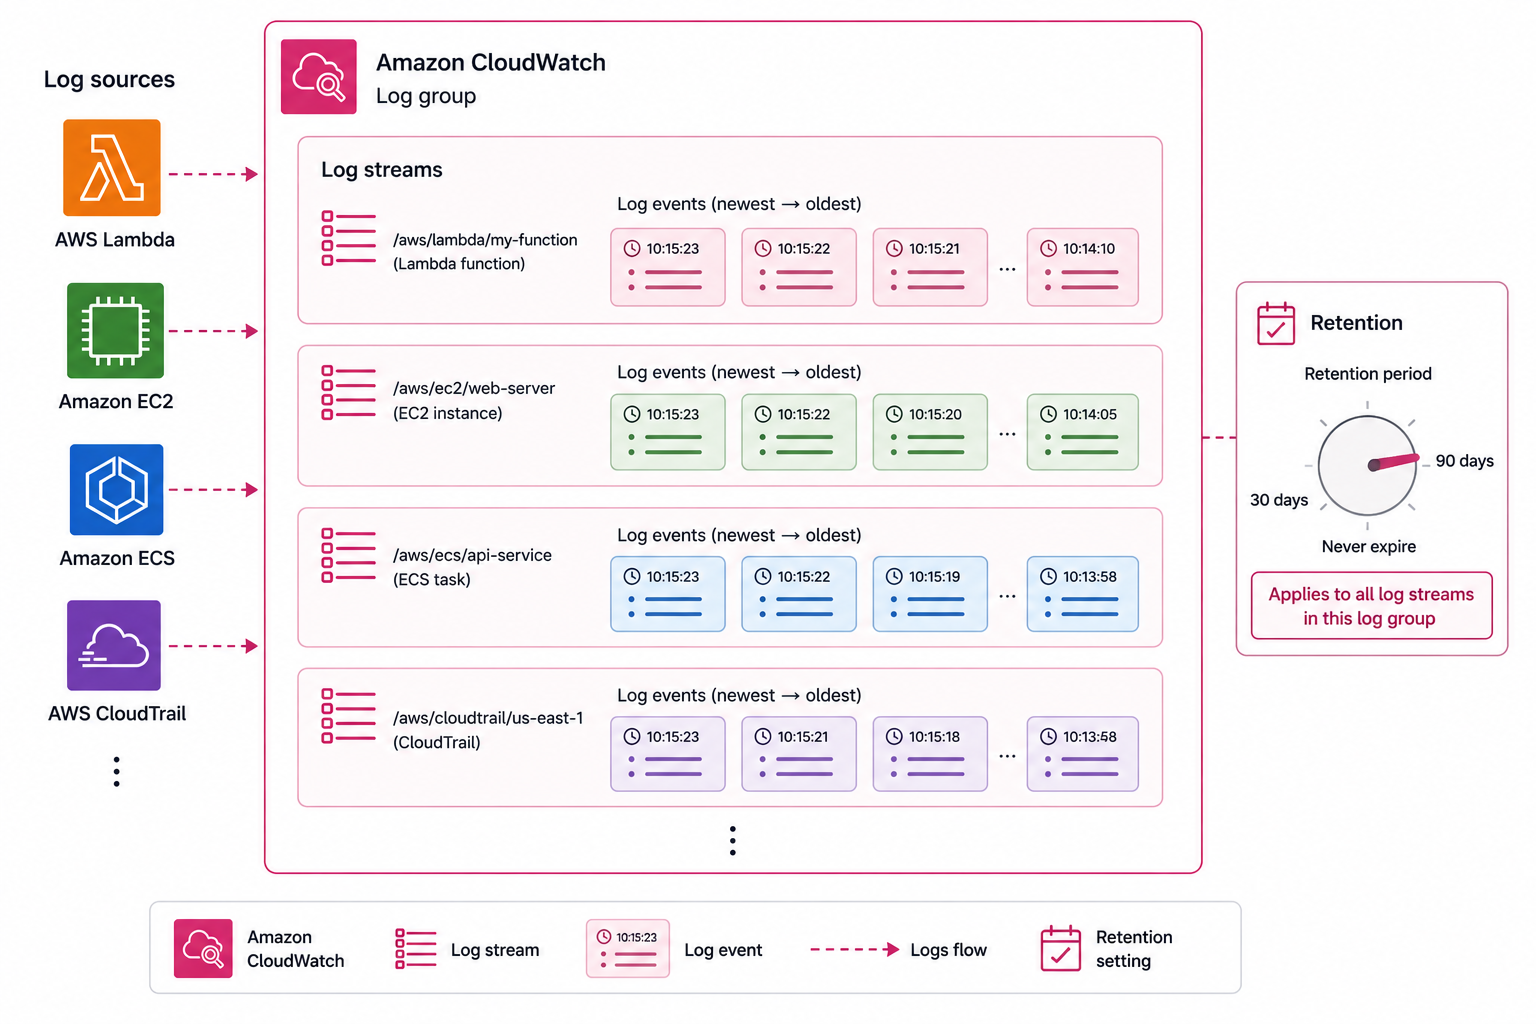
Log groups, log streams, and retention

  • Log group: a named container for related logs
  • Log stream: a sequence from one source
  • Retention: how long logs are kept
  • Logs cost money; set retention deliberately

CloudWatch Logs hierarchy: log group containing multiple log streams, each stream showing a time-ordered sequence of events, with a retention period setting and cost callout

Deploying Applications on AWS

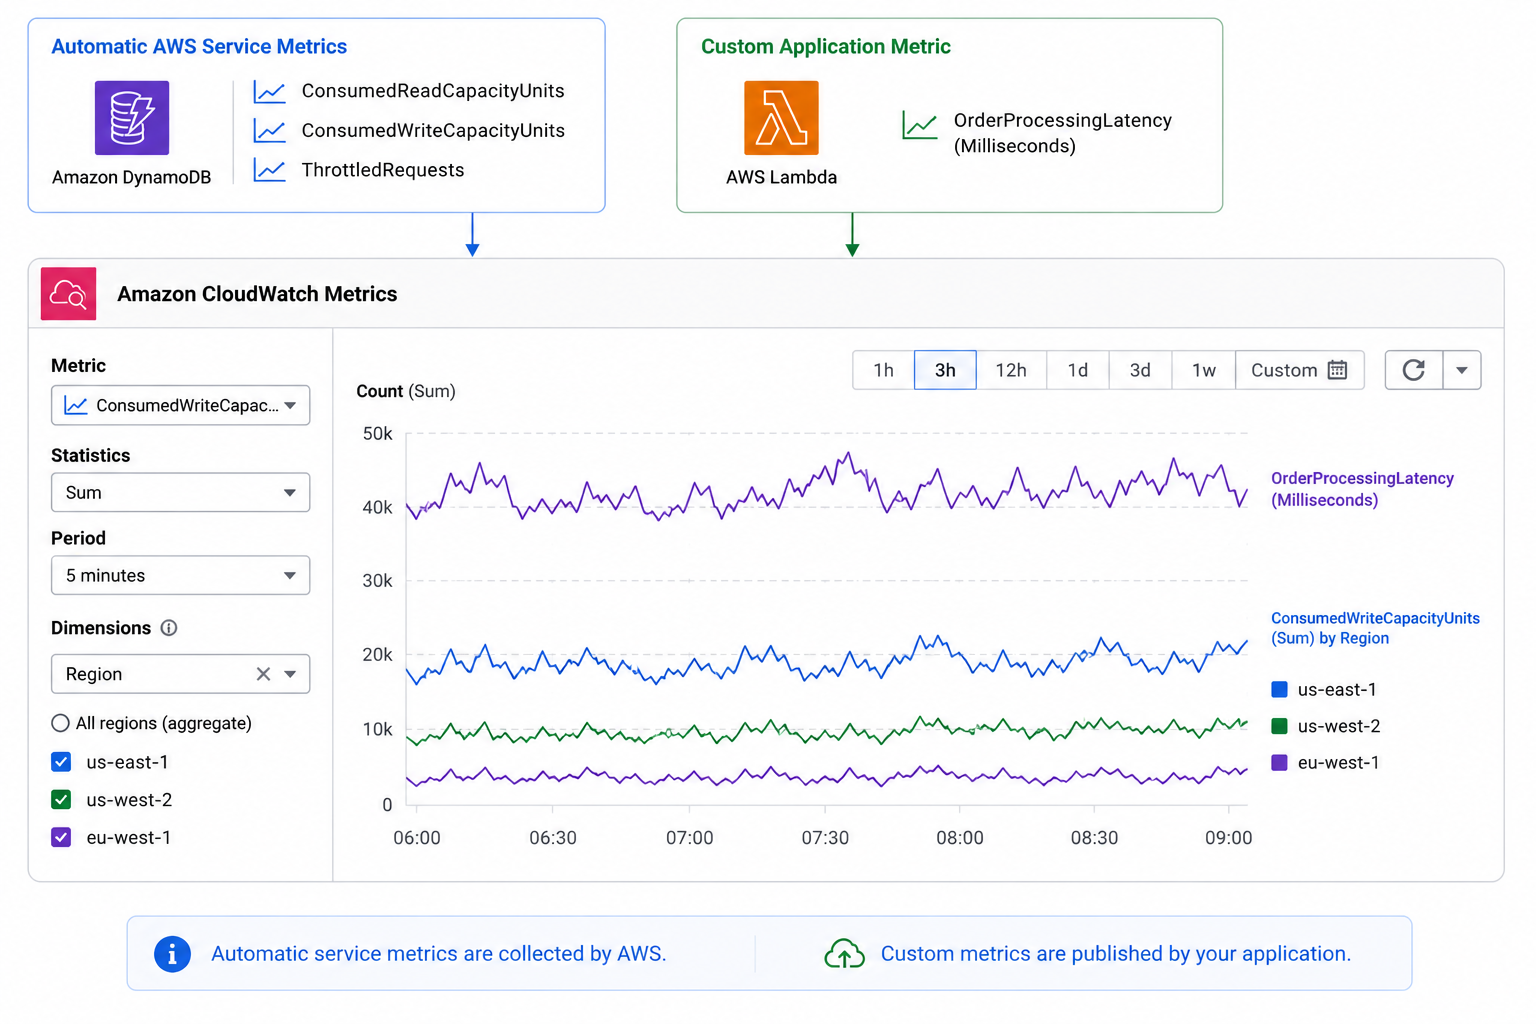
Metrics and custom metrics

  • Metrics: time-series numeric data
  • AWS publishes many service metrics automatically
  • Custom metrics: numbers your app emits
  • Dimensions slice a metric by attribute

CloudWatch metrics: AWS service metrics auto-published on the left, custom metric with dimensions on the right, and a time-series chart with a threshold alarm line

Deploying Applications on AWS

The embedded metric format

A single structured log line carries your metric values plus an _aws block that tells CloudWatch which fields are metrics:

{
  "_aws": {
    "CloudWatchMetrics": [
      {
        "Namespace": "OrdersApp",
        "Dimensions": [["customerTier"]],
        "Metrics": [{ "Name": "OrderLatencyMs", "Unit": "Milliseconds" }]
      }
    ]
  },
  "customerTier": "premium",
  "OrderLatencyMs": 142
}
Deploying Applications on AWS

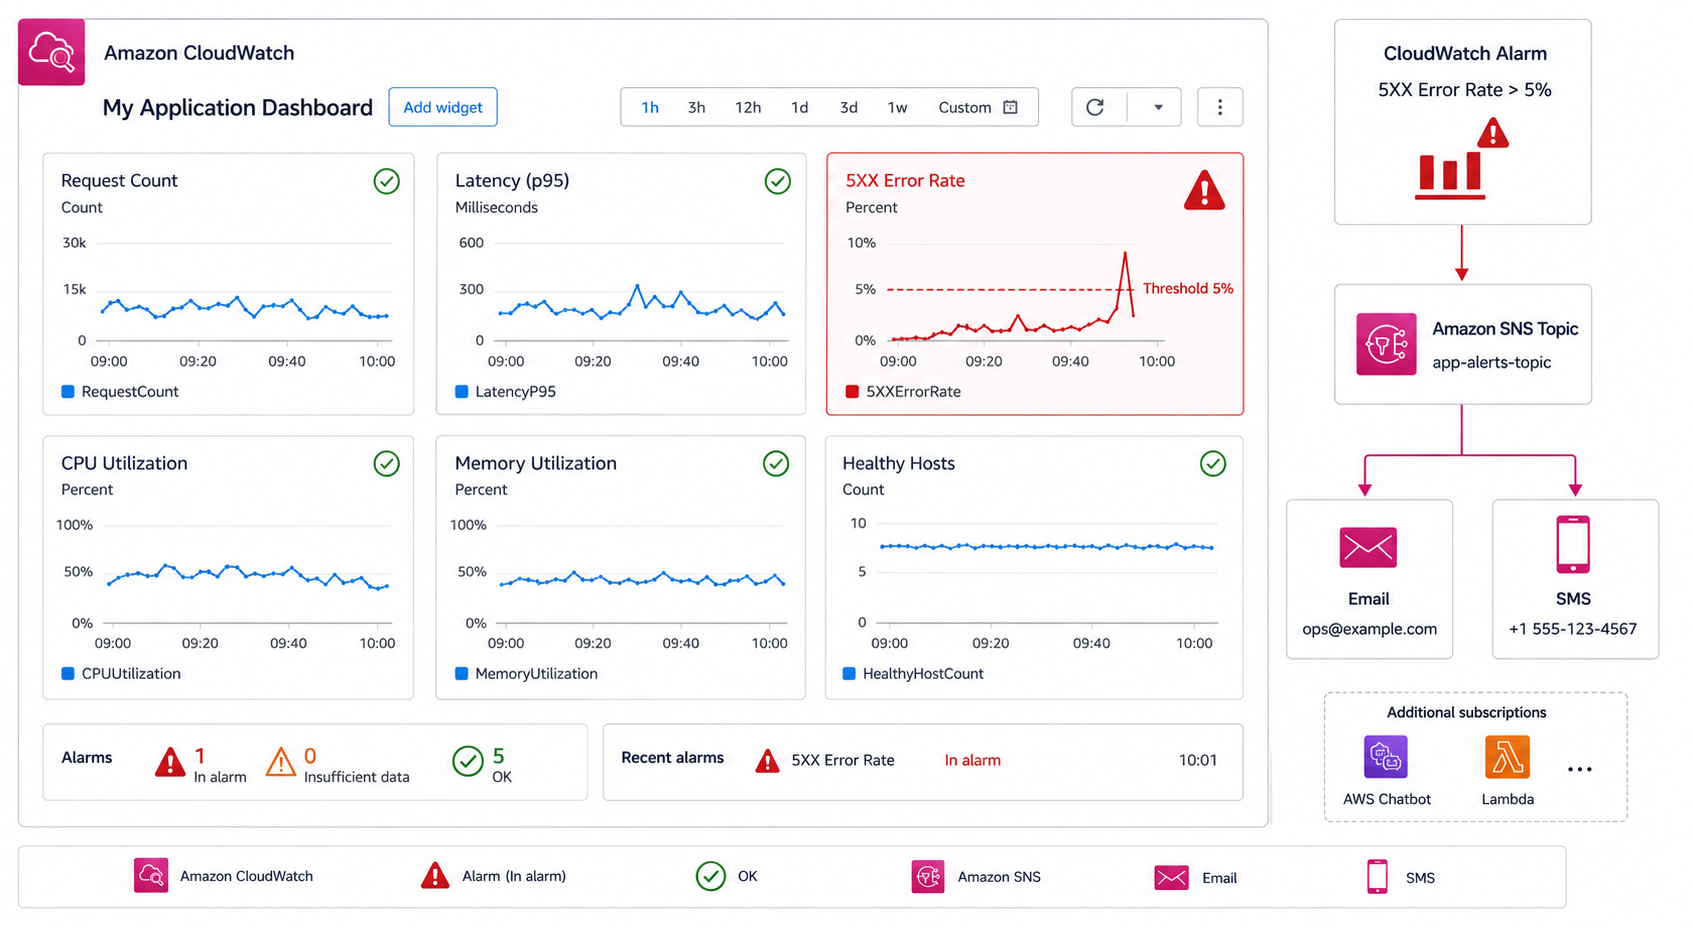
Dashboards and alarms

CloudWatch dashboard widget panel on the left and alarm state machine with OK, ALARM, and INSUFFICIENT_DATA states on the right, SNS notification routing to email and automation

  • Dashboard: one screen of charts and widgets
  • Alarm: fires when a metric crosses a threshold
  • Alarms route to SNS, then email, SMS, or automation
  • Alarm on symptoms users feel, not every metric
Deploying Applications on AWS

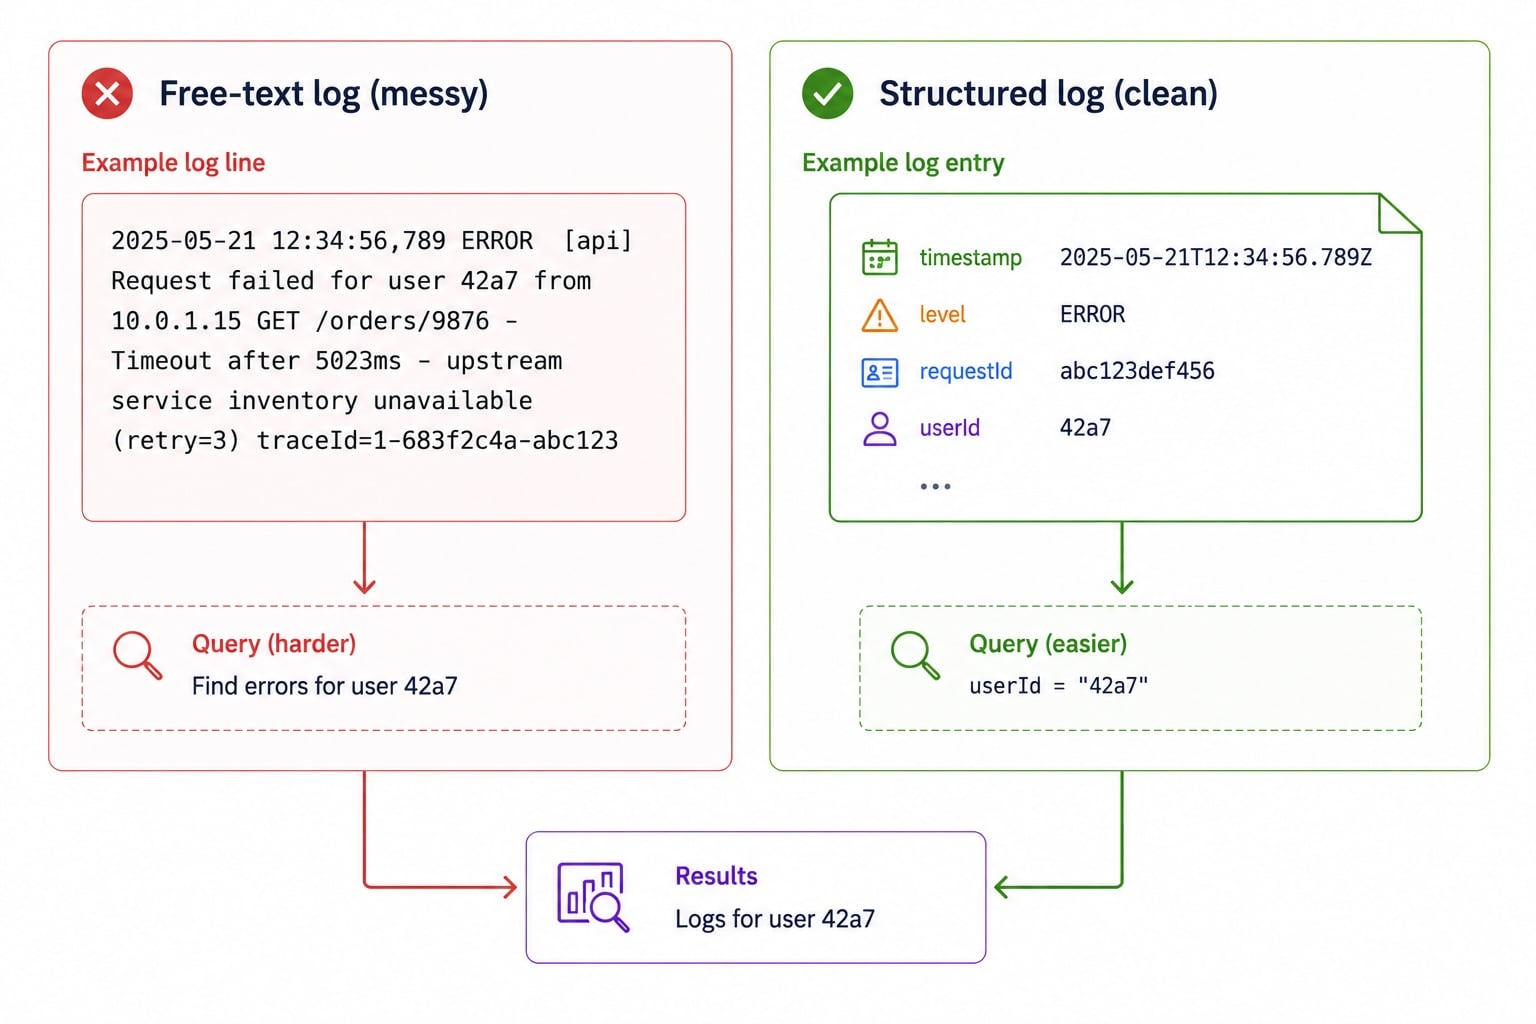
A structured logging strategy

  • Log as JSON, not free text
  • Include timestamp, level, request ID, user ID
  • Structured fields are filterable and queryable
  • Consistency across services makes correlation possible

Structured JSON log line with timestamp, level, requestId, and userId fields, and a Logs Insights query demonstrating how named fields enable precise filtering and aggregation

Deploying Applications on AWS

Let's practice!

Deploying Applications on AWS

Preparing Video For Download...