Więcej niż 2 zmienne objaśniające

Regresja średnio zaawansowana w R

Richie Cotton

Data Evangelist at DataCamp

Przypomnienie
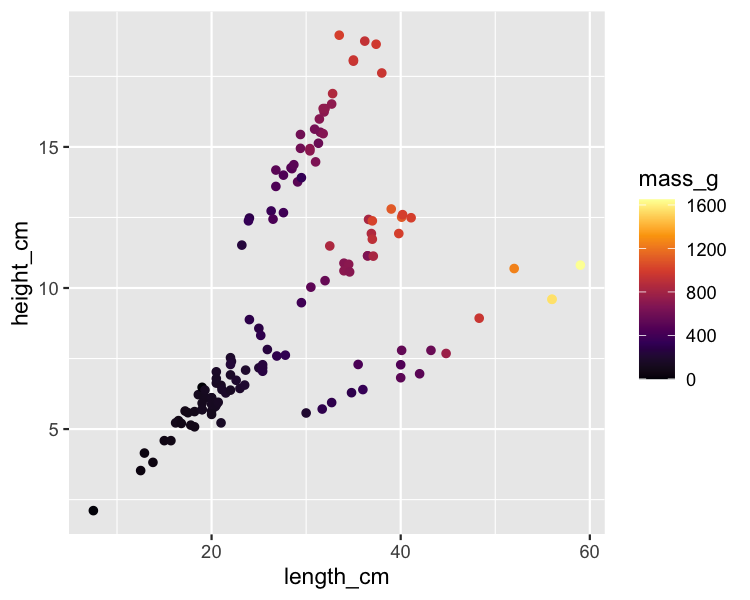
ggplot(
  fish,
  aes(length_cm, height_cm, color = mass_g)
) +
  geom_point() +
  scale_color_viridis_c(option = "inferno")

Wykres punktowy z kolorem: długość, wysokość i masa ryby (paleta inferno)

Regresja średnio zaawansowana w R

Facetowanie według gatunku

ggplot(
  fish,
  aes(length_cm, height_cm, color = mass_g)
) +
  geom_point() +
  scale_color_viridis_c(option = "inferno") +
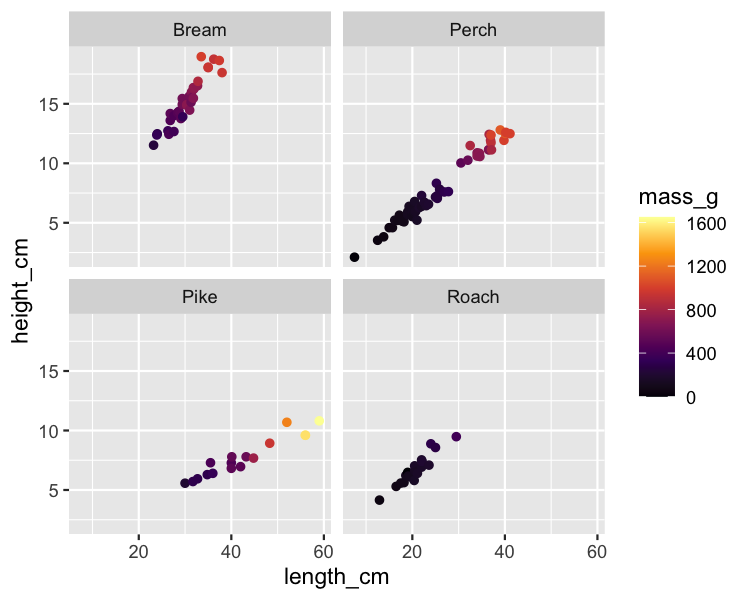
  facet_wrap(vars(species))

Wykres punktowy: długość, wysokość i masa ryby według gatunku

Regresja średnio zaawansowana w R

Poziomy interakcji

Brak interakcji

lm(mass_g ~ length_cm + height_cm + species + 0, data = fish)

Interakcje 2-kierunkowe między parami zmiennych

lm(
  mass_g ~ length_cm + height_cm + species + length_cm:height_cm + length_cm:species + height_cm:species + 0, 
  data = fish
)

Interakcja 3-kierunkowa między wszystkimi trzema zmiennymi

lm(
  mass_g ~ length_cm + height_cm + species + length_cm:height_cm + length_cm:species + height_cm:species + length_cm:height_cm:species + 0, 
  data = fish
)
Regresja średnio zaawansowana w R

Wszystkie interakcje

lm(
  mass_g ~ length_cm + height_cm + species + length_cm:height_cm + length_cm:species + height_cm:species + length_cm:height_cm:species + 0, 
  data = fish
)
lm(
  mass_g ~ length_cm * height_cm * species + 0, 
  data = fish
)
Regresja średnio zaawansowana w R

Tylko interakcje 2-kierunkowe

lm(
  mass_g ~ length_cm + height_cm + species + length_cm:height_cm + length_cm:species + height_cm:species + 0, 
  data = fish
)
lm(
  mass_g ~ (length_cm + height_cm + species) ^ 2 + 0, 
  data = fish
)
lm(
  mass_g ~ I(length_cm) ^ 2 + height_cm + species + 0, 
  data = fish
)
1 Aby podnosić zmienne objaśniające do kwadratu, zob. "Introduction to Regression in R", rozdział 2, "Transforming variables"
Regresja średnio zaawansowana w R

Przepływ prognozowania

mdl_mass_vs_all <- lm(mass_g ~ length_cm * height_cm * species * 0, data = fish)

explanatory_data <- expand_grid(
  length_cm = seq(5, 60, 6),
  height_cm = seq(2, 20, 2),
  species = unique(fish$species)
)

prediction_data <- explanatory_data %>% 
  mutate(mass_g = predict(mdl_mass_vs_all, explanatory_data))
Regresja średnio zaawansowana w R

Wizualizacja prognoz

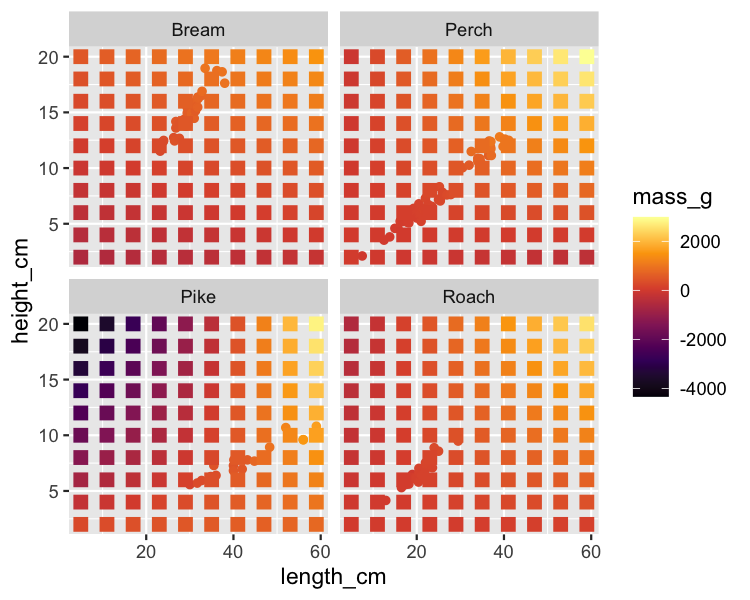
ggplot(
  fish,
  aes(length_cm, height_cm, color = mass_g)
) +
  geom_point() +
  scale_color_viridis_c(option = "inferno") +
  facet_wrap(vars(species)) +
  geom_point(
    data = prediction_data, 
    size = 3, shape = 15
  )

Wykres punktowy: długość, wysokość, masa i gatunek ryby z prognozami

Regresja średnio zaawansowana w R

Czas na ćwiczenia!

Regresja średnio zaawansowana w R

Preparing Video For Download...