Wprowadzenie do wizualizacji danych z Plotly w Pythonie
Alex Scriven
Data Scientist
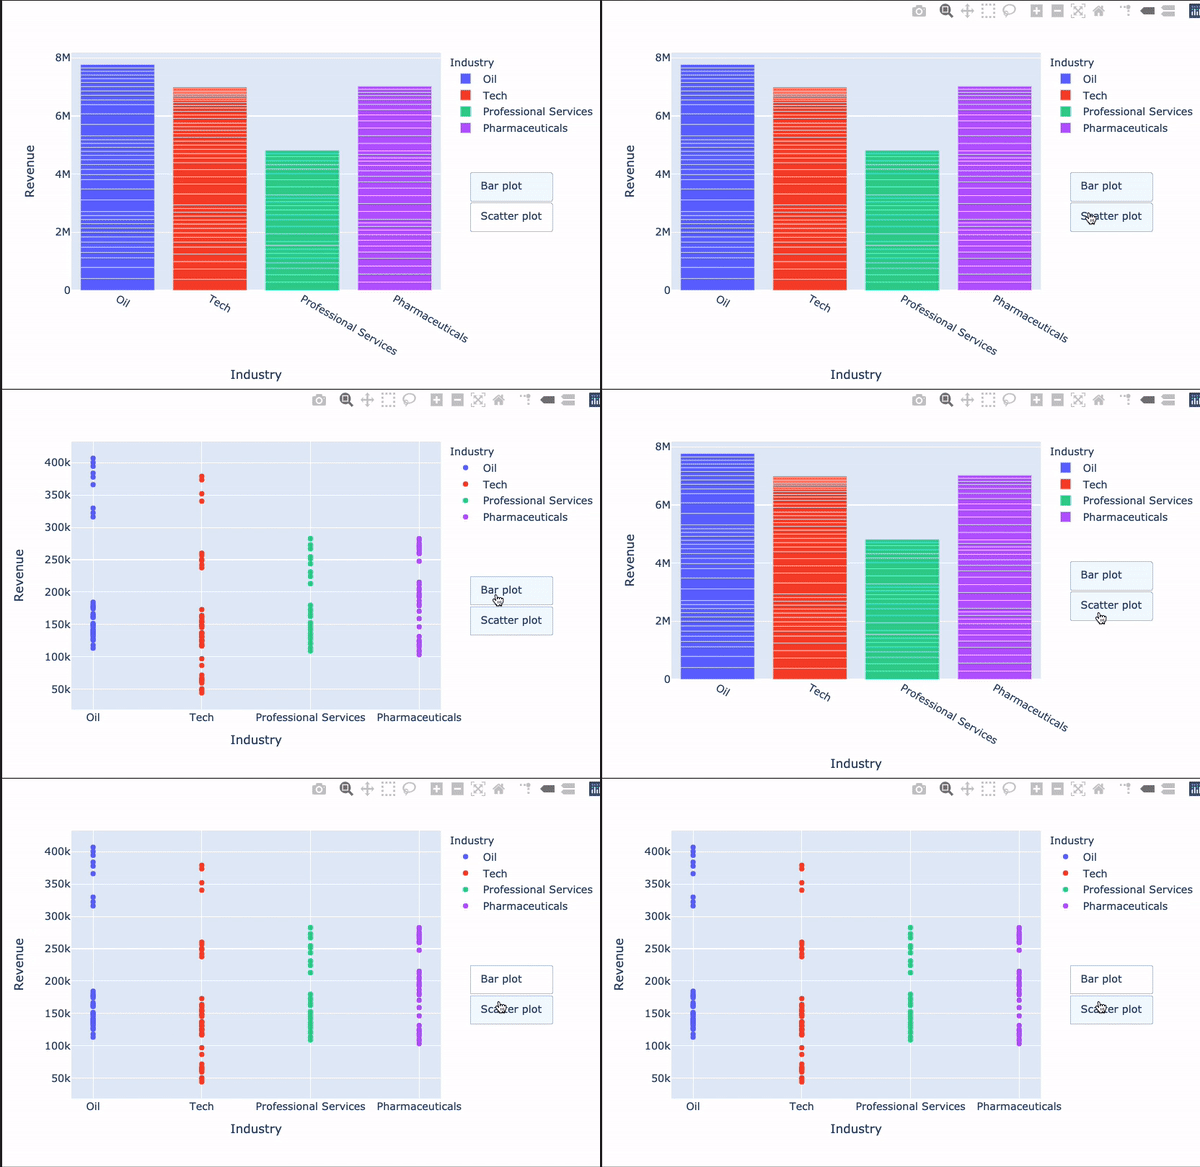
Niestandardowe przyciski mogą:
Aktualizować dane lub elementy układu wykresu
update_layout() można umieścić w przycisku!Wspomagać animacje (poza zakresem tego kursu)
Dodawane przez argument updatemenus z parametrami:
type: buttons lub dropdowndirection: Orientacja przyciskówleft) lub jeden nad drugim (down)x/y: Liczby zmiennoprzecinkowe określające pozycję przyciskówshowactive: True/False — wskazuje, czy aktywny przycisk (active, indeks) jest wciśnięty.buttons: Lista obiektów button$$
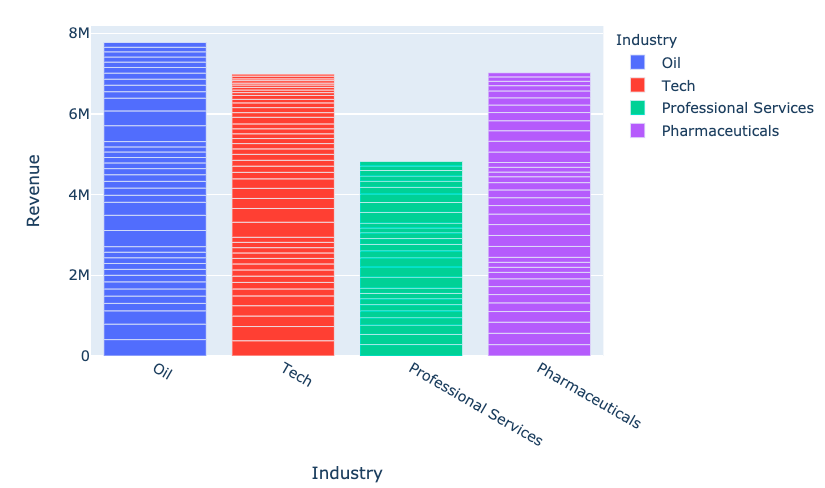
fig = px.bar(
data_frame=revenues,
x='Industry', y='Revenue',
color='Industry')
fig.show()

my_buttons = [{'label': "Bar plot",'method': "update",'args': [{"type": "bar"}]},{'label': "scatterplot",'method': "update",'args': [{"type": "scatter", 'mode': 'markers'}]}]
Jeden z najbardziej mylących elementów Plotly!
[{dictionary to send to data}, {dictionary to send to layout}]

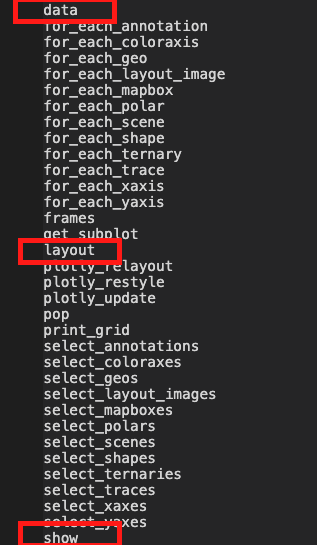
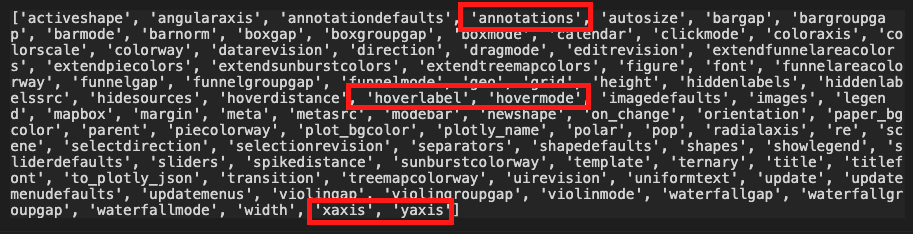
dir(fig.layout)

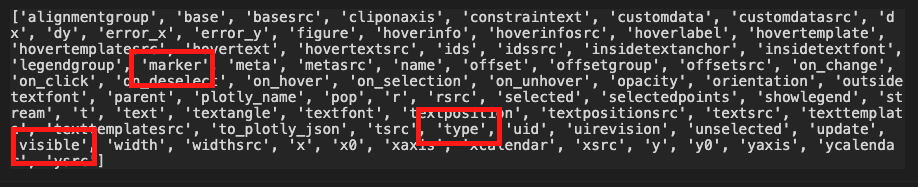
'args'dir(fig.data[0])

$$
fig.update_layout({ 'updatemenus': [{'type': "buttons",'direction': 'down', 'x': 1.3, 'y': 0.5,'showactive': True, 'active': 0,'buttons': my_buttons}] }) fig.show()
$$

Wprowadzenie do wizualizacji danych z Plotly w Pythonie