Korelacja indeksu i eksport do Excela

Manipulowanie danymi szeregów czasowych w Pythonie

Stefan Jansen

Founder & Lead Data Scientist at Applied Artificial Intelligence

Dodatkowa analiza indeksu

  • Korelacje dziennych zwrotów:

  • Obliczenie dla wszystkich składowych

  • Wizualizacja wyników jako mapa cieplna

  • Zapis wyników do Excela w formatach .xls i .xlsx:

  • Jeden arkusz

  • Wiele arkuszy

Manipulowanie danymi szeregów czasowych w Pythonie

Składowe indeksu – dane cenowe

data = DataReader(tickers, 'google', start='2016', end='2017')['Close']

data.info()
DatetimeIndex: 252 entries, 2016-01-04 to 2016-12-30
Data columns (total 12 columns):
ABB     252 non-null float64
BABA    252 non-null float64
JNJ     252 non-null float64
JPM     252 non-null float64
KO      252 non-null float64
ORCL    252 non-null float64
PG      252 non-null float64
T       252 non-null float64
TM      252 non-null float64
UPS     252 non-null float64
WMT     252 non-null float64
XOM     252 non-null float64
Manipulowanie danymi szeregów czasowych w Pythonie

Składowe indeksu: korelacje zwrotów

daily_returns = data.pct_change()

correlations = daily_returns.corr()
ABB  BABA  JNJ  JPM   KO  ORCL   PG    T   TM  UPS  WMT  XOM
ABB  1.00  0.40 0.33 0.56 0.31  0.53 0.34 0.29 0.48 0.50 0.15 0.48
BABA 0.40  1.00 0.27 0.27 0.25  0.38 0.21 0.17 0.34 0.35 0.13 0.21
JNJ  0.33  0.27 1.00 0.34 0.30  0.37 0.42 0.35 0.29 0.45 0.24 0.41
JPM  0.56  0.27 0.34 1.00 0.22  0.57 0.27 0.13 0.49 0.56 0.14 0.48
KO   0.31  0.25 0.30 0.22 1.00  0.31 0.62 0.47 0.33 0.50 0.25 0.29
ORCL 0.53  0.38 0.37 0.57 0.31  1.00 0.41 0.32 0.48 0.54 0.21 0.42
PG   0.34  0.21 0.42 0.27 0.62  0.41 1.00 0.43 0.32 0.47 0.33 0.34
T    0.29  0.17 0.35 0.13 0.47  0.32 0.43 1.00 0.28 0.41 0.31 0.33
TM   0.48  0.34 0.29 0.49 0.33  0.48 0.32 0.28 1.00 0.52 0.20 0.30
UPS  0.50  0.35 0.45 0.56 0.50  0.54 0.47 0.41 0.52 1.00 0.33 0.45
WMT  0.15  0.13 0.24 0.14 0.25  0.21 0.33 0.31 0.20 0.33 1.00 0.21
XOM  0.48  0.21 0.41 0.48 0.29  0.42 0.34 0.33 0.30 0.45 0.21 1.00
Manipulowanie danymi szeregów czasowych w Pythonie

Składowe indeksu: korelacje zwrotów

sns.heatmap(correlations, annot=True)
plt.xticks(rotation=45)
plt.title('Daily Return Correlations')
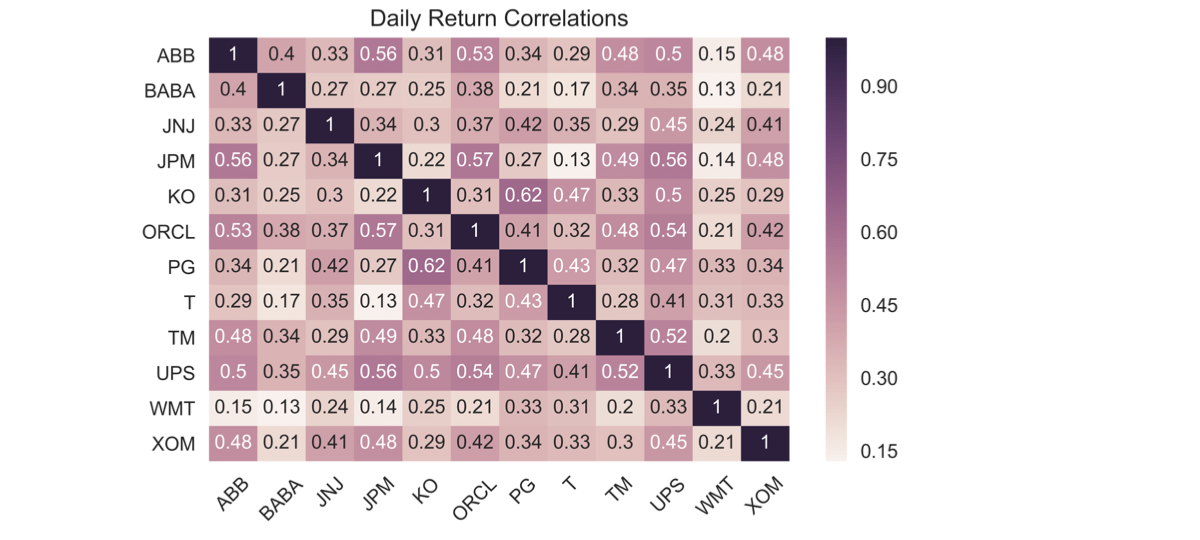
Korelacje dziennych zwrotów – mapa cieplna

Manipulowanie danymi szeregów czasowych w Pythonie

Zapis do jednego arkusza Excela

correlations.to_excel(excel_writer= 'correlations.xls',
                      sheet_name='correlations',
                      startrow=1,
                      startcol=1)
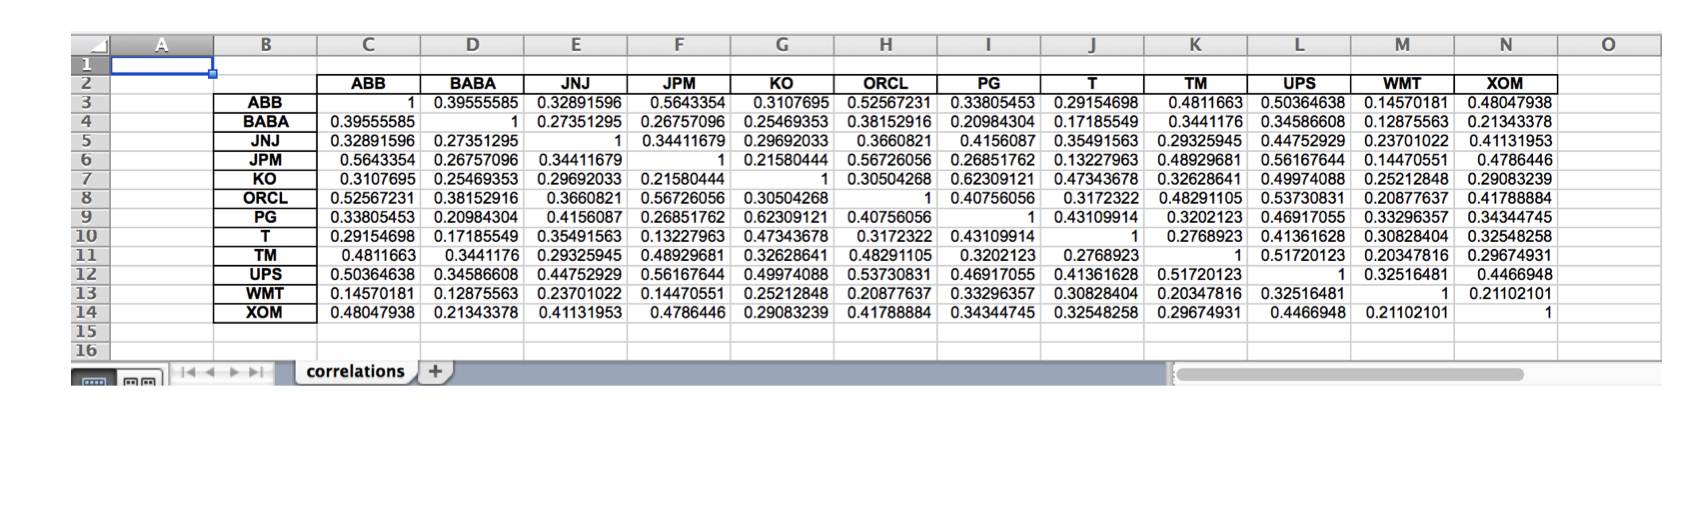
Zapis korelacji do pojedynczego arkusza Excela

Manipulowanie danymi szeregów czasowych w Pythonie

Zapis do wielu arkuszy Excela

data.index = data.index.date # Keep only date component

with pd.ExcelWriter('stock_data.xlsx') as writer:
corr.to_excel(excel_writer=writer, sheet_name='correlations')
data.to_excel(excel_writer=writer, sheet_name='prices')
data.pct_change().to_excel(writer, sheet_name='returns')
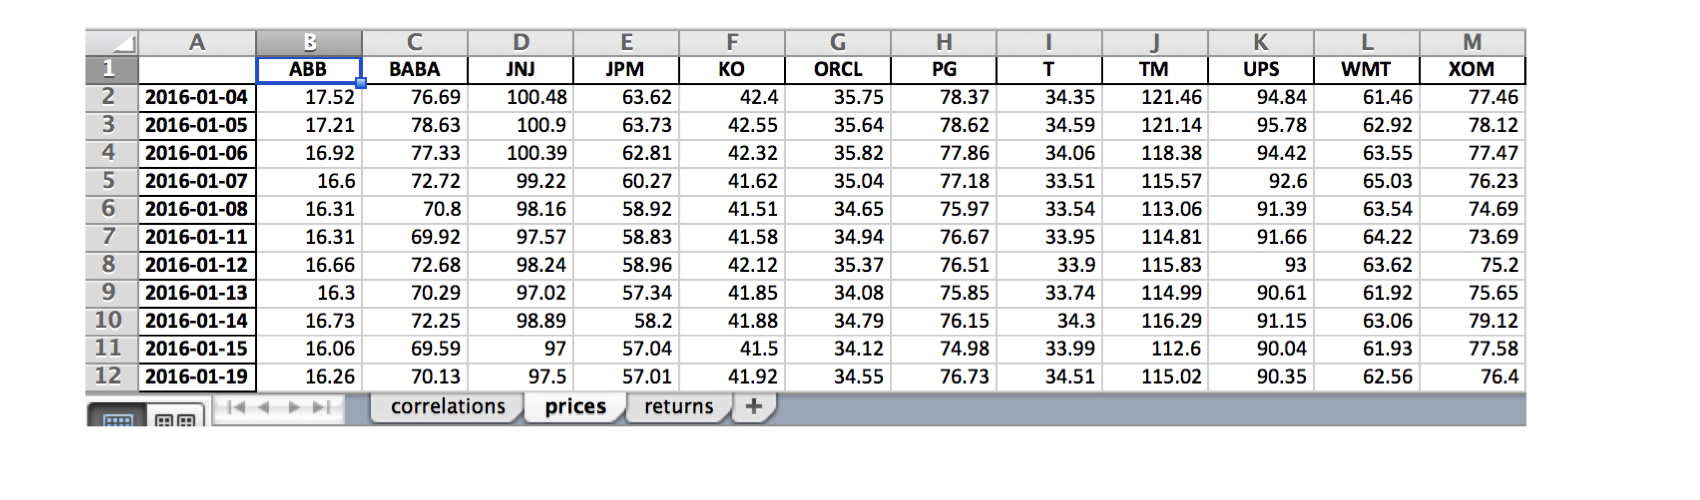
Korelacja indeksu i zapis wyników do Excela

Manipulowanie danymi szeregów czasowych w Pythonie

Czas na ćwiczenia!

Manipulowanie danymi szeregów czasowych w Pythonie

Preparing Video For Download...