Tworzenie dashboardów z Dash i Plotly
Alex Scriven
Data Scientist
dash.html
.H1()
.Div()
<div>
  <div style=
       "background-color: red;
        width:250; height:250;">
  </div>
  <div style=
       "background-color: lightblue;
        width:250; height:250;">
    <h1>This box</h1>
  </div>
</div>
.Br()
.Img()
.Ul()
.Ol()
.Li()
app.layout = [

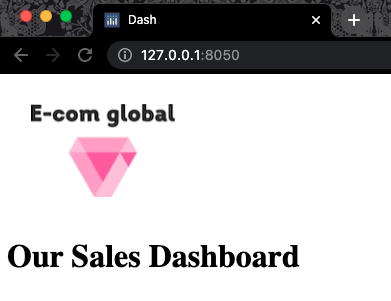
  html.Img(src='www.website.com/logo.png'),
  html.H1("Our Sales Dashboard")

]
app.layout = [
html.Img(src='www.website.com/logo.png'), html.H1("Our Sales Dashboard")
]
Ustawianie i formatowanie tekstu
.P()
.Span()
children
.B()
.I()
Bardziej złożone formatowanie:
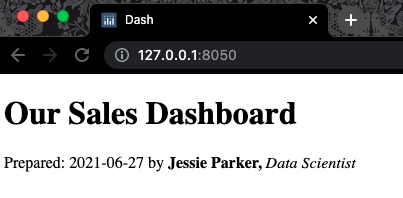
app.layout = [
   html.H1("Our Sales Dashboard"),

   html.Span(children=[

   f"Prepared: {datetime.now().date()}",

   " by ", html.B("Jessie Parker, "),

   html.I("Data Scientist")

   ])

]
app.layout = [ html.H1("Our Sales Dashboard"),
html.Span(children=[
f"Prepared: {datetime.now().date()}",
" by ", html.B("Jessie Parker, "),
html.I("Data Scientist")
])
$$
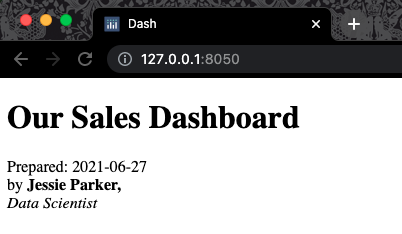
app.layout = [
   html.H1("Our Sales Dashboard"),
   html.Span(children=[
   f"Prepared: {datetime.now().date()}",
   html.Br(),
   " by ", html.B("Jessie Parker, "),
   html.Br(),
   html.I("Data Scientist")])
    ]